

Abstract
Background
Fibroblast growth factor‐23 (FGF‐23) is a hormone involved in phosphorous regulation and vitamin D metabolism that may be associated with cardiovascular risk, and it is a potential target for intervention. We tested whether elevated FGF‐23 is associated with incident coronary heart disease, heart failure, and cardiovascular mortality, even at normal kidney function.
Methods and Results
A total of 11 638 Atherosclerosis Risk In Communities study participants, median age 57 at baseline (1990–1992), were followed through 2010. Cox regression was used to evaluate the independent association of baseline serum active FGF‐23 with incident outcomes. Models were adjusted for traditional cardiovascular risk factors and estimated glomerular filtration rate. During a median follow‐up of 18.6 years, 1125 participants developed coronary heart disease, 1515 developed heart failure, and 802 died of cardiovascular causes. For all 3 outcomes, there was a threshold, whereby FGF‐23 was not associated with risk at <40 pg/mL but was positively associated with risk at >40 pg/mL. Compared with those with FGF‐23 <40 pg/mL, those in the highest FGF‐23 category (≥58.8 pg/mL) had a higher risk of incident coronary heart disease (adjusted hazard ratio, 95% CIs: 1.65, 1.40 to 1.94), heart failure (1.75, 1.52 to 2.01), and cardiovascular mortality (1.65, 1.36 to 2.01). Associations were modestly attenuated but remained statistically significant after further adjustment for estimated glomerular filtration rate. In stratified analyses, similar results were observed in African Americans and among persons with normal kidney function.
Conclusions
High levels of serum FGF‐23 were associated with increased risk of coronary heart disease, heart failure, and cardiovascular mortality in this large, biracial, population‐based cohort. This association was independent of traditional cardiovascular risk factors and kidney function.
Keywords: Atherosclerosis Risk In Communities, cardiovascular mortality, coronary heart disease, epidemiology, fibroblast growth factor 23, heart failure
Introduction
Fibroblast growth factor 23 (FGF‐23) is a hormone that is secreted primarily by osteocytes and to a lesser extent by osteoblasts. It is involved in the regulation of phosphorus homeostasis, vitamin D metabolism, and bone mineralization. Specifically, it induces urinary phosphorous excretion, inhibits activation of calcitriol [1,25(OH)2D], and suppresses parathyroid hormone (PTH) synthesis.1–3 Levels of FGF‐23 are correlated inversely with renal function,4–5 and in patients with chronic kidney disease (CKD), elevated serum FGF‐23 levels predict the progression of renal failure,6 and death.7–8
The potential role of FGF‐23 in the development of cardiovascular disease, particularly independent of kidney function, is unclear. FGF‐23 may influence cardiovascular risk through the CKD or vitamin D pathways; CKD is an established risk factor for cardiovascular disease,9 and accruing evidence suggests that low levels of vitamin D may increase cardiovascular risk.10 Furthermore, recent experimental work in rodent models suggests FGF‐23 may have a direct pathophysiologic role in inducing left ventricular hypertrophy (LVH),11 a marker of cardiac remodeling associated with increased risk of sudden cardiac death and progression to heart failure (HF).12 Several studies have shown FGF‐23 to be associated with cardiovascular events among patients with CKD13–16 and in those with prevalent coronary heart disease (CHD).17 In the general population, information is more limited,18–19 although it is suggestive of an association, particularly among individuals with impaired kidney function.18–19 Information is lacking for those with normal renal function, and prior studies have not had adequate power to examine these associations among African Americans.
Using data from the prospective, community‐based Atherosclerosis Risk In Communities (ARIC) Study, we tested the hypothesis that active, intact FGF‐23 is positively associated with risk of incident CHD, HF, and cardiovascular mortality, independent of traditional cardiovascular risk factors and markers of kidney function.
Methods
Study Population
The ARIC study is a population‐based prospective cohort of 15 792 men and women (aged 45 to 64 years at baseline) who, between 1987 and 1989, were recruited from 4 US communities: Forsyth County, North Carolina; Jackson, Mississippi; suburbs of Minneapolis, Minnesota; and Washington County, Maryland.20 A total of 4 cohort reexaminations have taken place: 1990–1992 (visit 2), 1993–1995 (visit 3), 1996–1998 (visit 4), and 2011–2013 (visit 5). Local institutional review boards approved the ARIC protocol, and all participants gave informed consent.
Serum FGF‐23 was measured in samples collected at ARIC visit 2 (1990–1992); we are therefore using visit 2, which was attended by 14 348 participants, as “baseline” for the present analysis. Excluded from the analysis are participants who had prevalent CHD or HF at visit 2 (n=1368), self‐identified as neither African American nor white and African Americans from the Minnesota and Maryland centers (n=85), had missing FGF‐23 data (n=751), and had missing data on any covariate (n=506). Our final analytic sample included 11 638 participants.
FGF‐23 and Other Variables
At visit 2, ARIC participants underwent interviews, fasting venipuncture, and measurement of blood pressure and anthropometrics. Trained interviewers ascertained basic demographic data, medical history, smoking status, and medication use. Participants were asked to bring to the visit all medications, vitamins, and supplements taken in the 2 weeks before the examination; all medication names were transcribed and coded. Physical activity (Baecke21 questionnaire) was not assessed at visit 2, so values from visit 1 were carried forward. Height and weight were measured, and body mass index (BMI) calculated as weight/height2 (kg/m2). Sitting blood pressure was measured in triplicate with a random‐zero sphygmomanometer; the mean of the latter 2 measurements were used in this analysis. Diabetes was defined by fasting blood glucose >126 mg/dL, nonfasting glucose >200 mg/dL, a self‐report of physician diagnosis, or current medication use for diabetes. Left ventricular hypertrophy was determined by the Cornell definition, based on 12‐lead electrocardiograms.22
Fasting (12‐hour) blood samples were drawn, and plasma and serum were frozen at −70°C until analyzed. Intact FGF‐23 was measured, in singlicate, in serum using a 2‐site ELISA (FGF‐23 ELISA Kit, Kainos Laboratories, Inc) at the Advanced Research and Diagnostic Laboratory, University of Minnesota, Minneapolis, Minnesota, in 2012–2013. The coefficient of variation (CV) for FGF‐23 based on ARIC blind duplicate samples was 16.6%, while the CV from internal laboratory QC samples was 8.8% at 41.4 pg/mL. Serum phosphorus was measured in 2012–2013 on a Roche Modular P Chemistry Analyzer using a colorimetric method (CV=3%), and serum B‐type natriuretic peptide (NT‐proBNP) and serum high‐sensitivity troponin T (hs‐TnT) were measured using sandwich immunoassay methods on a Roche Elecsys 2010 Analyzer (Roche Diagnostics Corporation). Lipids were measured at the time of ARIC visit 2 (1990–1992). Total plasma cholesterol23 and triglycerides24 were determined via enzymatic methods. High‐density lipoprotein cholesterol (HDL‐C) was measured after dextran‐magnesium precipitation,25 and the Friedewald equation26 was used to calculate low‐density lipoprotein cholesterol (LDL‐C) in those with triglyceride levels <400 mg/dL. Cystatin C was measured in 2012–2013 using the Gentian cystatin C reagent on the Roche Modular P Chemistry analyzer, and serum creatinine was measured in 1990–1992 using a modified kinetic Jaffé reaction. Estimated glomerular filtration rate (eGFR) was calculated using the 2012 CKD EPI equation, which incorporates both cystatin C and creatinine.27 eGFR was categorized according to established clinical cut‐points: ≥90, 60 to 89, and 15 to 59 mL/min per 1.73 m2. No participants in our sample had an eGFR <15. Urine was not collected at ARIC visit 2 but was available at visit 4. Urinary creatinine was measured by the Jaffe method and albumin by a nephelometric method either on the Dade Behring BN100 (Dade Behring, Inc, Deerfield, IL) or Beckman Image Nephelometer. The albumin–creatinine ratio (ACR) was calculated.
Prevalent CHD was defined by self‐reported prior physician diagnosis of MI or coronary revascularization, prevalent MI by 12‐lead ECG at visit 1, or an incident‐adjudicated CHD event between ARIC visits 1 and 2. Preexisting HF was defined by any of the following: (1) an affirmative response to, “Were any of the medications you took during the last 2 weeks for heart failure?” (2) stage 3 or “manifest heart failure” according to Gothenburg criteria,28–29 or (3) incident HF hospitalization between ARIC visits 1 and 2.
Outcome Ascertainment
Incident cardiovascular events and deaths through December 31, 2010, were identified through (1) annual telephone calls to ARIC cohort participants (or proxy), (2) active surveillance of local hospital discharge indexes, (3) search of state death records, and (4) linkage to the National Death Index. ARIC criterion and procedures for validating potential CHD events have been described previously.30 In brief, incident CHD was defined as the first occurrence of a validated definite or probable hospitalized MI or a definite CHD death. HF incidence was defined as the first occurrence of either a hospitalization that included an International Classification of Diseases, 9th Revision (ICD‐9) discharge code of 428 (428.0 to 428.9) among the primary or secondary diagnoses or a death certificate with an ICD‐9 code of 428 or an ICD‐10 code of I50 among any of the listed diagnoses or underlying causes of death.29 Cardiovascular mortality was defined as death with ICD‐9 code 401‐459 or ICD‐10 code I10‐I99.
Statistical Analysis
Characteristics of participants at visit 2 are described using means and proportions, stratified by categories of FGF‐23. Pearson's correlation coefficients between key biomarkers are also provided. For the primary analysis, Cox proportional hazards regression was used to determine associations between FGF‐23 and risk of incident CHD, HF, and cardiovascular mortality. Restricted cubic splines were used to explore the dose–response association between FGF‐23 and outcomes and to aid in selecting the most appropriate exposure modeling. For all outcomes, there appeared to be a threshold whereby FGF‐23 was unrelated to risk at levels <40 pg/mL but was associated with greater risk beyond that point. To convey this association, we used levels <40 pg/mL as the reference category (contains 45.3% of the analytic sample). Levels ≥40 pg/mL were divided into quartiles (each quartile contains 13.7% of the full study population). Given inherent interest, we also report the linear association (per 1 SD) between FGF‐23 and outcomes. FGF‐23 is a novel biomarker; as such, there are presently no cut‐points used clinically for elevated FGF‐23. Our first model adjusted for basic demographics (age, sex, and race). Model 2 additionally adjusted for education, physical activity, smoking status, and BMI. Model 3 further adjusted for prevalent diabetes, systolic BP, hypertension medication use, lipid medication use, LDL‐C, and HDL‐C. In additional models, we also adjusted, separately, for eGFR, serum phosphorus, PTH, NT‐proBNP, hs‐TnT, and LVH. Cross‐product terms were used to evaluate whether age, race, sex, or eGFR modified associations between FGF‐23 categories and outcomes. The proportional hazards assumption was evaluated by inspection of ln(−ln) survival curves for FGF‐23 categories. SAS version 9.3 was used.
Results
Our analytic sample included a total of 11 638 participants (female participants 57%, African American 25%, and mean age 57 years). Mean (±SD) FGF‐23 was 43.9 (±16.4) pg/mL. Levels of FGF‐23 were correlated positively with serum phosphorous (r=0.11) and PTH (r=0.11) and inversely with eGFR (r=−0.25). Relative to participants with FGF‐23 concentrations below 40 pg/mL, those in the highest category (≥58.8 pg/mL) were slightly older, more likely to be African American, and overall had a worse cardiovascular risk factor profile, particularly in regard to hypertension and CKD (Table 1). For example, 9.3% of participants in the top category of FGF‐23 had an eGFR <60 mL/min per 1.73 m2, while among participants in the lowest category of FGF‐23 only 1.0% had an eGFR <60 mL/min per 1.73 m2.
Table 1.
Participant Characteristics by Serum FGF‐23 Category: The ARIC Study 1990–1992
| Serum FGF‐23 (pg/mL) | Group 1 | Group 2 | Group 3 | Group 4 | Group 5 |
|---|---|---|---|---|---|
| Median | 32.8 | 42.2 | 47.2 | 53.5 | 67.2 |
| Range | 2.9 to 40.0 | 40.1 to 44.6 | 44.7 to 50.1 | 50.2 to 58.7 | 58.8 to 481.0 |
| N total (%) | 5272 (45.3) | 1591 (13.7) | 1592 (13.7) | 1591 (13.7) | 1592 (13.7) |
| Demographics | |||||
| Age, mean±SD y | 56.3±5.7 | 56.6±5.6 | 56.9±5.6 | 56.9±5.7 | 57.5±5.7 |
| Female, n (%) | 3131 (59.4) | 885 (55.6) | 888 (55.8) | 872 (54.8) | 916 (57.5) |
| African American, n (%) | 1237 (23.5) | 361 (22.7) | 399 (25.1) | 412 (25.9) | 426 (26.8) |
| Education, n (%) | |||||
| <High school | 1002 (19.0) | 320 (20.1) | 323 (20.3) | 339 (21.3) | 357 (22.4) |
| High school | 2288 (43.4) | 642 (40.4) | 646 (40.6) | 638 (40.1) | 653 (41.0) |
| >High school | 1982 (37.6) | 629 (39.5) | 623 (39.1) | 614 (38.6) | 582 (36.6) |
| Behavioral characteristics | |||||
| Sport index, mean±SD | 2.5±0.8 | 2.5±0.8 | 2.4±0.8 | 2.4±0.8 | 2.4±0.8 |
| Smoking, n (%) | |||||
| Current | 1263 (24.0) | 325 (20.4) | 335 (21.0) | 324 (20.4) | 280 (17.6) |
| Former | 1924 (36.5) | 564 (35.5) | 607 (38.1) | 600 (37.7) | 605 (38.0) |
| Never | 2085 (39.6) | 702 (44.1) | 650 (40.8) | 667 (41.9) | 707 (44.4) |
| Physiologic characteristics | |||||
| BMI, kg/m2±SD | 27.2±5.2 | 27.7±5.1 | 28.1±5.2 | 28.2±5.2 | 29.1±5.8 |
| Prevalent diabetes, n (%) | 613 (11.6) | 169 (10.6) | 218 (13.7) | 218 (13.7) | 274 (17.3) |
| Prevalent hypertension, n (%) | 1463 (27.8) | 492 (31.0) | 555 (35.0) | 583 (36.7) | 707 (44.5) |
| Systolic BP, mm Hg±SD | 120±18 | 121±18 | 121±18 | 122±19 | 123±19 |
| Diastolic BP, mm Hg±SD | 72±10 | 72±10 | 73±10 | 73±11 | 73±10 |
| Hypertension medications, n (%) | 1188 (22.5) | 422 (26.5) | 495 (31.1) | 496 (31.2) | 657 (41.3) |
| Lipid‐lowering medications, n (%) | 229 (4.4) | 71 (4.5) | 97 (6.1) | 96 (6.1) | 110 (6.9) |
| HDL‐C, mg/dL±SD | 52.3±17.0 | 50.2±16.6 | 49.4±16.4 | 48.8±15.9 | 48.3±16.6 |
| LDL‐C, mg/dL±SD | 131±36 | 135±36 | 134±36 | 135±36 | 137±38 |
| Triglycerides, mg/dL±SD | 119±60 | 128±66 | 131±64 | 134±67 | 143±70 |
| hs‐CRP, mg/dL | 4.0±7.2 | 3.7±5.4 | 4.4±7.1 | 4.0±6.1 | 4.9±6.9 |
| PTH, pg/mL | 40.6±15.1 | 41.4±15.9 | 42.3±15.5 | 42.8±16.9 | 44.6±22.5 |
| Phosphorous, mg/dL | 3.5±0.5 | 3.5±0.5 | 3.6±0.5 | 3.6±0.5 | 3.6±0.5 |
| eGFR*, mL/min per 1.73 m2±SD | 95.4±14.4 | 92.8±14.4 | 91.3±15.0 | 89.6±15.8 | 84.2±18.5 |
| eGFR* category, n (%) | |||||
| >90 mL/min per 1.73 m2 | 3491 (66.2) | 938 (59.0) | 882 (55.4) | 808 (50.8) | 617 (38.8) |
| 60 to 90 mL/min per 1.73 m2 | 1730 (32.8) | 630 (39.6) | 682 (42.8) | 724 (45.5) | 827 (52.0) |
| <60 mL/min per 1.73 m2 | 51 (1.0) | 23 (1.5) | 28 (1.8) | 59 (3.7) | 148 (9.3) |
ARIC indicates Atherosclerosis Risk In Communities; FGF‐23, fibroblast growth factor‐23; BMI, body mass index; BP, blood pressure; HDL‐C, high‐density lipoprotein cholesterol; LDL‐C, low‐density lipoprotein cholesterol; hs‐CRP, high‐sensitivity C‐reactive protein; PTH, parathyroid hormone; eGFR, estimated glomerular filtration rate.
eGFR was estimated using the 2012 Inker equation, which incorporates both cystatin C and serum creatinine.
Incident CHD
During a median of 18.6 (maximum 20.9) years of follow‐up, 1125 incident CHD events accrued (median [SD] time to event 10.2 [5.4] years). FGF‐23 was positively and significantly associated with risk of incident CHD when modeled linearly (per 1 SD), regardless of level of adjustment (Table 2). However, as illustrated in the restricted cubic spline models (Figure – Panel A), there was a threshold effect whereby there was no association between FGF‐23 and risk at levels <40 pg/mL, but at >40 pg/mL there was a positive association. Hence, the reference group, which contains 45.3% of the full analytic sample, includes participants with FGF‐23 concentrations <40 pg/mL. Levels >40 pg/mL were split into quartiles. After demographic adjustments, people in the highest category of FGF‐23 (≥58.8 pg/mL) were at 1.65 (95% CI 1.40 to 1.94) times greater risk of incident CHD, relative to those at <40 pg/mL (Table 2). The association was similar with additional adjustment for behaviors (model 2: 1.63 [1.38 to 1.92]) and only modestly attenuated with further adjustment for cardiovascular risk factors (model 3: 1.44 [1.22 to 1.70]) and eGFR (model 4: 1.32 [1.11 to 1.56]). Results were essentially unchanged when model 4 was additionally adjusted for serum phosphorous (hazard ratio [HR] 1.30 [1.09 to 1.54]) and PTH (HR 1.31 [1.10 to 1.55]). In sensitivity analyses when follow‐up time was restricted to the first 5 years, a total of 229 events accrued (53 in the upper category), and results were somewhat stronger: model 1: 1.89 (1.34 to 2.66) and model 4: 1.40 (0.97 to 2.02).
Table 2.
Serum FGF‐23 and Risk of Incident CHD, HF, and Cardiovascular Mortality: The ARIC Study 1990–2010
| Serum FGF‐23 (pg/mL) | Group 1 | Group 2 | Group 3 | Group 4 | Group 5 | Per 1 SD (16.40 pg/mL) |
|---|---|---|---|---|---|---|
| Median | 32.8 | 42.2 | 47.2 | 53.5 | 67.2 | |
| Range | 2.9 to 40.0 | 40.1 to 44.6 | 44.7 to 50.1 | 50.2 to 58.7 | 58.8 to 481.0 | |
| N total (%) | 5272 (45.3) | 1591 (13.7) | 1592 (13.7) | 1591 (13.7) | 1592 (13.7) | |
| Incident CHD | ||||||
| N events | 438 | 141 | 145 | 183 | 218 | 1125 |
| Model 1 | 1.00 (Ref) | 1.05 (0.87, 1.27) | 1.05 (0.87, 1.27) | 1.34 (1.13, 1.60) | 1.65 (1.40, 1.94) | 1.14 (1.09, 1.18) |
| Model 2 | 1.00 (Ref) | 1.06 (0.88, 1.28) | 1.06 (0.88, 1.29) | 1.35 (1.13, 1.60) | 1.63 (1.38, 1.92) | 1.12 (1.08, 1.17) |
| Model 3 | 1.00 (Ref) | 1.02 (0.84, 1.23) | 1.00 (0.83, 1.21) | 1.24 (1.04, 1.48) | 1.44 (1.22, 1.70) | 1.11 (1.06, 1.16) |
| Model 4 | 1.00 (Ref) | 1.01 (0.83, 1.22) | 0.98 (0.81, 1.19) | 1.19 (1.00, 1.42) | 1.32 (1.11, 1.56) | 1.08 (1.03, 1.13) |
| Incident HF | ||||||
| N events | 583 | 183 | 221 | 220 | 308 | 1515 |
| Model 1 | 1.00 (Ref) | 1.04 (0.88, 1.22) | 1.21 (1.03, 1.41) | 1.22 (1.05, 1.43) | 1.75 (1.52, 2.01) | 1.15 (1.11, 1.18) |
| Model 2 | 1.00 (Ref) | 1.04 (0.88, 1.23) | 1.19 (1.02, 1.39) | 1.21 (1.03, 1.41) | 1.63 (1.42, 1.88) | 1.12 (1.09, 1.15) |
| Model 3 | 1.00 (Ref) | 1.04 (0.88, 1.23) | 1.14 (0.97, 1.33) | 1.14 (0.97, 1.33) | 1.46 (1.27, 1.68) | 1.11 (1.07, 1.15) |
| Model 4 | 1.00 (Ref) | 1.03 (0.87, 1.21) | 1.12 (0.96, 1.31) | 1.08 (0.92, 1.26) | 1.30 (1.13, 1.51) | 1.08 (1.04, 1.13) |
| Incident cardiovascular mortality | ||||||
| N events | 295 | 114 | 110 | 126 | 157 | 802 |
| Model 1 | 1.00 (Ref) | 1.26 (1.01, 1.56) | 1.15 (0.92, 1.43) | 1.32 (1.07, 1.62) | 1.65 (1.36, 2.01) | 1.15 (1.10, 1.20) |
| Model 2 | 1.00 (Ref) | 1.27 (1.03, 1.58) | 1.17 (0.94, 1.46) | 1.33 (1.08, 1.64) | 1.65 (1.36, 2.01) | 1.14 (1.10, 1.19) |
| Model 3 | 1.00 (Ref) | 1.26 (1.02, 1.55) | 1.10 (0.89, 1.38) | 1.25 (1.02, 1.55) | 1.51 (1.24, 1.84) | 1.13 (1.08, 1.19) |
| Model 4 | 1.00 (Ref) | 1.24 (0.99, 1.54) | 1.07 (0.86, 1.34) | 1.14 (0.92, 1.41) | 1.28 (1.04, 1.57) | 1.08 (1.02, 1.15) |
Model 1: Adjusted for age, sex, and race. Model 2: Adjusted for model 1 plus education, physical activity, smoking, and BMI. Model 3: Adjusted for model 2 plus prevalent diabetes, systolic BP, HTN medication use, lipid medication use, LDL cholesterol, and HDL cholesterol. Model 4: Adjusted for model 3 plus eGFR category (Inker 2012 cystatin C and creatinine; 3‐level category). FGF‐23 indicates fibroblast growth factor‐23; CHD, coronary heart disease; HF, heart failure; ARIC, Atherosclerosis Risk In Communities; BMI, body mass index; BP, blood pressure; eGFR, estimated glomerular filtration rate; HDL, high‐density lipoprotein; HTN, hypertension; LDL, low‐density lipoprotein.
Figure 1.
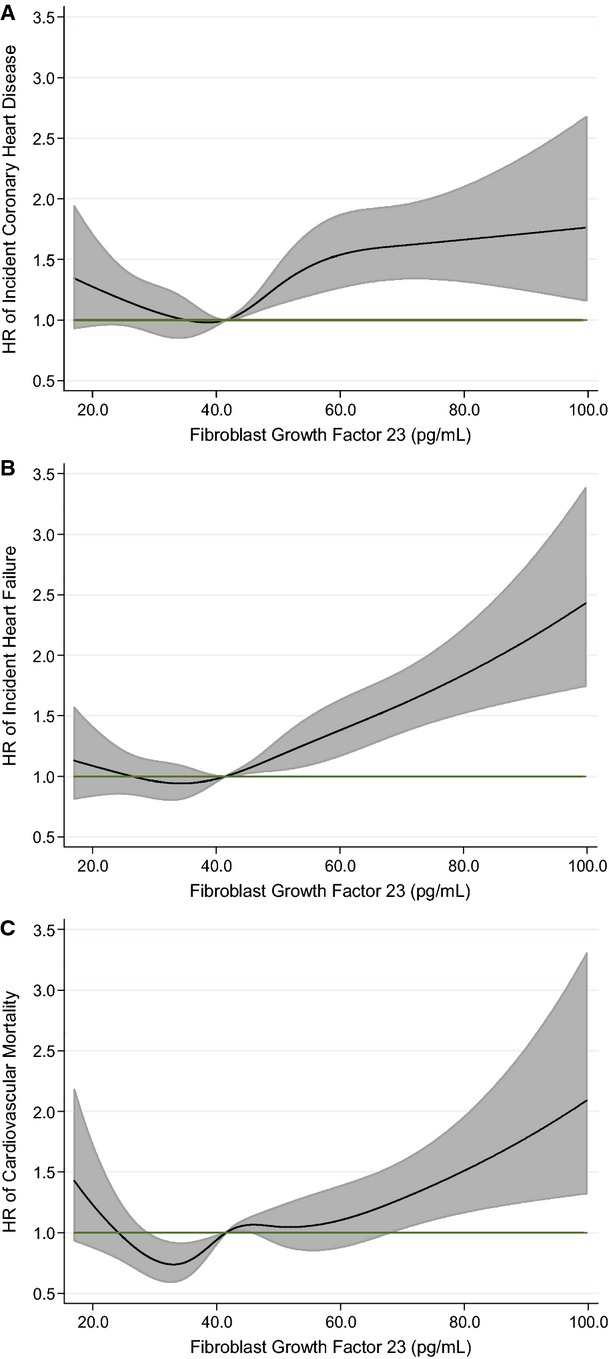
Association of serum FGF‐23 with risk of incident CHD, HF, and cardiovascular mortality: the ARIC Study 1987–2010. Biomarkers modeled as restricted cubic splines with knots at the 5th, 27.5th, 50th, 72.5th, and 95th percentiles and are adjusted for age, sex, and race. Black line represents hazard ratio; gray shaded area, 95% confidence interval. A, FGF‐23 and incident CHD. B, FGF‐23 and incident HF. C, FGF‐23 and incident cardiovascular mortality. ARIC indicates Atherosclerosis Risk In Communities; CHD, coronary heart disease; FGF‐23, fibroblast growth factor‐23; HF, heart failure.
There was no evidence of interaction by age, sex, race, or eGFR on the association between FGF‐23 and incident CHD. Given inherent interest, race‐ and eGFR‐stratified results are presented in Tables 3 and 4, respectively. Associations were qualitatively stronger in African Americans, relative to whites. It is important to note that in the analytic sample, only 309 ARIC participants had an eGFR <60 mL/min per 1.73 m2 at visit 2. Thus, power is more limited when restricted to this group.
Table 3.
Serum FGF‐23 and Risk of Incident CHD, HF, and Cardiovascular Mortality Stratified by Race: The ARIC Study 1990–2010
| Serum FGF‐23 (pg/mL) | Group 1 | Group 2 | Group 3 | Group 4 | Group 5 | Per 1 SD (16.40 pg/mL) |
|---|---|---|---|---|---|---|
| Median | 32.8 | 42.2 | 47.2 | 53.5 | 67.2 | |
| Range | 2.9 to 40.0 | 40.1 to 44.6 | 44.7 to 50.1 | 50.2 to 58.7 | 58.8 to 481.0 | |
| N total | ||||||
| Blacks | 1237 | 361 | 399 | 412 | 426 | 2835 |
| Whites | 4035 | 1230 | 1193 | 1179 | 1166 | 8803 |
| Incident CHD | ||||||
| African Americans | ||||||
| N events | 112 | 46 | 33 | 56 | 71 | 318 |
| Model 1 | 1.00 (Ref) | 1.39 (0.98 to 1.96) | 0.90 (0.61 to 1.33) | 1.48 (1.07 to 2.04) | 1.88 (1.39 to 2.53) | 1.26 (1.16 to 1.38) |
| Model 2 | 1.00 (Ref) | 1.41 (0.99 to 1.99) | 0.90 (0.61 to 1.33) | 1.27 (0.91 to 1.76) | 1.41 (1.03 to 1.94) | 1.13 (1.03 to 1.24) |
| Whites | ||||||
| N events | 326 | 95 | 112 | 127 | 147 | 807 |
| Model 1 | 1.00 (Ref) | 0.94 (0.75 to 1.18) | 1.11 (0.89 to 1.37) | 1.29 (1.05 to 1.59) | 1.56 (1.28 to 1.89) | 1.11 (1.05 to 1.17) |
| Model 2 | 1.00 (Ref) | 0.89 (0.71 to 1.12) | 1.01 (0.81 to 1.25) | 1.17 (0.95 to 1.44) | 1.28 (1.04 to 1.57) | 1.06 (0.99 to 1.13) |
| Incident HF | ||||||
| African Americans | ||||||
| N events | 184 | 50 | 75 | 73 | 114 | 496 |
| Model 1 | 1.00 (Ref) | 0.91 (0.67 to 1.25) | 1.26 (0.96 to 1.64) | 1.19 (0.91 to 1.56) | 1.88 (1.49 to 2.38) | 1.28 (1.19 to 1.37) |
| Model 2 | 1.00 (Ref) | 0.97 (0.71 to 1.33) | 1.23 (0.94 to 1.61) | 0.97 (0.74 to 1.29) | 1.32 (1.02 to 1.69) | 1.12 (1.04 to 1.21) |
| Whites | ||||||
| N events | 399 | 133 | 146 | 147 | 194 | 1019 |
| Model 1 | 1.00 (Ref) | 1.09 (0.90 to 1.33) | 1.18 (0.98 to 1.43) | 1.24 (1.03 to 1.50) | 1.67 (1.41 to 1.99) | 1.12 (1.08 to 1.17) |
| Model 2 | 1.00 (Ref) | 1.07 (0.88 to 1.30) | 1.08 (0.89 to 1.30) | 1.12 (0.93 to 1.36) | 1.30 (1.09 to 1.56) | 1.07 (1.02 to 1.12) |
| Incident cardiovascular mortality | ||||||
| African Americans | ||||||
| N events | 97 | 43 | 55 | 51 | 74 | 320 |
| Model 1 | 1.00 (Ref) | 1.47 (1.03 to 2.11) | 1.71 (1.23 to 2.39) | 1.51 (1.07 to 2.12) | 2.18 (1.61 to 2.96) | 1.30 (1.22 to 1.40) |
| Model 2 | 1.00 (Ref) | 1.48 (1.03 to 2.13) | 1.65 (1.18 to 2.31) | 1.21 (0.86 to 1.72) | 1.58 (1.14 to 2.18) | 1.15 (1.07 to 1.24) |
| Whites | ||||||
| N events | 198 | 71 | 55 | 75 | 83 | 482 |
| Model 1 | 1.00 (Ref) | 1.16 (0.88 to 1.52) | 0.87 (0.65 to 1.17) | 1.23 (0.94 to 1.60) | 1.38 (1.06 to 1.78) | 1.07 (0.99 to 1.16) |
| Model 2 | 1.00 (Ref) | 1.13 (0.86 to 1.49) | 0.78 (0.58 to 1.06) | 1.10 (0.84 to 1.44) | 1.11 (0.85 to 1.45) | 1.00 (0.91 to 1.10) |
Model 1: Adjusted for age, sex, and race. Model 2: Adjusted for model 1 plus education, physical activity, smoking, BMI, prevalent diabetes, systolic BP, HTN medication use, lipid medication use, LDL cholesterol, HDL cholesterol, and eGFR category (Inker 2012 cystatin C and creatinine; 3‐level category). ARIC indicates Atherosclerosis Risk in Communities; BMI, body mass index; BP, blood pressure; CHD, coronary heart disease; eGFR, estimated glomerular filtration rate; FGF‐23, fibroblast growth factor‐23; HDL, high‐density lipoprotein; HF, heart failure; HTN, hypertension; LDL, low‐density lipoprotein.
Table 4.
Serum FGF‐23 and Risk of Incident CHD, HF, and Cardiovascular Mortality Stratified by Baseline Kidney Function: The ARIC Study 1990–2010
| Serum FGF‐23 (pg/mL) | Group 1 | Group 2 | Group 3 | Group 4 | Group 5 | Per 1 SD (16.40 pg/mL) |
|---|---|---|---|---|---|---|
| Median | 32.8 | 42.2 | 47.2 | 53.5 | 67.2 | |
| Range | 2.9 to 40.0 | 40.1 to 44.6 | 44.7 to 50.1 | 50.2 to 58.7 | 58.8 to 481.0 | |
| N total | ||||||
| eGFR ≥90 | 3491 | 938 | 882 | 808 | 617 | 6736 |
| eGFR 60 to <90 | 1730 | 630 | 682 | 724 | 827 | 4593 |
| eGFR <60 | 51 | 23 | 28 | 59 | 148 | 309 |
| Incident CHD | ||||||
| eGFR ≥90 | ||||||
| N events | 273 | 57 | 50 | 68 | 75 | 523 |
| Model 1 | 1.00 (Ref) | 0.75 (0.56 to 0.99) | 0.70 (0.52 to 0.95) | 1.05 (0.80 to 1.36) | 1.56 (1.21 to 2.01) | 1.07 (0.97 to 1.17) |
| Model 2 | 1.00 (Ref) | 0.76 (0.57 to 1.02) | 0.68 (0.50 to 0.92) | 1.04 (0.79 to 1.35) | 1.50 (1.16 to 1.94) | 1.06 (0.96 to 1.17) |
| eGFR 60 to <90 | ||||||
| N events | 157 | 81 | 91 | 99 | 107 | 535 |
| Model 1 | 1.00 (Ref) | 1.46 (1.12 to 1.91) | 1.44 (1.11 to 1.86) | 1.49 (1.16 to 1.92) | 1.45 (1.13 to 1.85) | 1.10 (1.03 to 1.16) |
| Model 2 | 1.00 (Ref) | 1.38 (1.06 to 1.81) | 1.38 (1.06 to 1.79) | 1.36 (1.05 to 1.75) | 1.28 (1.00 to 1.64) | 1.07 (1.00 to 1.14) |
| eGFR <60 | ||||||
| N events | 8 | 3 | 4 | 16 | 36 | 67 |
| Model 1 | 1.00 (Ref) | 0.97 (0.26 to 3.70) | 0.92 (0.28 to 3.07) | 1.87 (0.80 to 4.39) | 1.60 (0.74 to 3.45) | 1.16 (1.02 to 1.32) |
| Model 2 | 1.00 (Ref) | 1.04 (0.26 to 4.14) | 0.89 (0.26 to 3.01) | 1.74 (0.72 to 4.20) | 1.46 (0.66 to 3.25) | 1.12 (0.97 to 1.30) |
| Incident HF | ||||||
| eGFR ≥90 | ||||||
| N events | 322 | 72 | 93 | 85 | 87 | 659 |
| Model 1 | 1.00 (Ref) | 0.81 (0.63 to 1.05) | 1.10 (0.87 to 1.38) | 1.13 (0.89 to 1.44) | 1.49 (1.17 to 1.89) | 1.09 (1.00 to 1.18) |
| Model 2 | 1.00 (Ref) | 0.84 (0.65 to 1.09) | 1.04 (0.83 to 1.31) | 1.10 (0.86 to 1.40) | 1.34 (1.06 to 1.71) | 1.06 (0.98 to 1.16) |
| eGFR 60 to <90 | ||||||
| N events | 241 | 105 | 118 | 114 | 159 | 737 |
| Model 1 | 1.00 (Ref) | 1.26 (1.00 to 1.58) | 1.24 (0.99 to 1.54) | 1.14 (0.91 to 1.43) | 1.47 (1.20 to 1.80) | 1.08 (1.03 to 1.14) |
| Model 2 | 1.00 (Ref) | 1.23 (0.98 to 1.55) | 1.19 (0.96 to 1.49) | 1.10 (0.88 to 1.37) | 1.29 (1.05 to 1.58) | 1.05 (0.99 to 1.12) |
| eGFR <60 | ||||||
| N events | 20 | 6 | 10 | 21 | 62 | 119 |
| Model 1 | 1.00 (Ref) | 0.72 (0.29 to 1.80) | 1.00 (0.47 to 2.15) | 1.01 (0.54 to 1.86) | 1.10 (0.66 to 1.82) | 1.19 (1.09 to 1.30) |
| Model 2 | 1.00 (Ref) | 0.74 (0.28 to 1.92) | 1.02 (0.46 to 2.23) | 0.84 (0.43 to 1.61) | 1.21 (0.70 to 2.08) | 1.22 (1.11 to 1.34) |
| Incident cardiovascular mortality | ||||||
| eGFR ≥90 | ||||||
| N events | 158 | 55 | 43 | 39 | 38 | 333 |
| Model 1 | 1.00 (Ref) | 1.24 (0.91 to 1.69) | 1.01 (0.72 to 1.41) | 1.02 (0.72 to 1.44) | 1.28 (0.90 to 1.83) | 1.06 (0.94 to 1.20) |
| Model 2 | 1.00 (Ref) | 1.31 (0.96 to 1.79) | 0.97 (0.69 to 1.36) | 1.03 (0.72 to 1.46) | 1.31 (0.92 to 1.88) | 1.08 (0.96 to 1.21) |
| eGFR 60 to <90 | ||||||
| N events | 130 | 54 | 60 | 74 | 82 | 400 |
| Model 1 | 1.00 (Ref) | 1.19 (0.86 to 1.63) | 1.14 (0.84 to 1.55) | 1.31 (0.98 to 1.74) | 1.33 (1.01 to 1.75) | 1.06 (0.98 to 1.16) |
| Model 2 | 1.00 (Ref) | 1.16 (0.84 to 1.59) | 1.13 (0.83 to 1.54) | 1.25 (0.94 to 1.67) | 1.23 (0.93 to 1.64) | 1.04 (0.95 to 1.14) |
| eGFR <60 | ||||||
| N events | 7 | 5 | 7 | 13 | 37 | 69 |
| Model 1 | 1.00 (Ref) | 2.31 (0.72 to 7.39) | 1.98 (0.69 to 5.69) | 1.63 (0.65 to 4.12) | 1.77 (0.79 to 3.99) | 1.14 (1.03 to 1.25) |
| Model 2 | 1.00 (Ref) | 3.23 (0.93 to 11.19) | 1.85 (0.62 to 5.50) | 1.41 (0.53 to 3.76) | 1.51 (0.64 to 3.52) | 1.05 (0.94 to 1.17) |
Model 1: Adjusted for age, sex, and race. Model 2: Adjusted for model 1 plus education, physical activity, smoking, BMI, prevalent diabetes, systolic BP, HTN medication use, lipid medication use, LDL cholesterol, and HDL cholesterol. FGF‐23 indicates fibroblast growth factor‐23; CHD, coronary heart disease; HF, heart failure; ARIC, Atherosclerosis Risk In Communities; BMI, body mass index; BP, blood pressure; HTN, hypertension; eGFR, estimated glomerular filtration rate; HDL, high‐density lipoprotein; LDL, low‐density lipoprotein.
Incident HF
A total of 1515 incident HF events occurred through a median of 18.6 years of follow‐up (maximum 20.9 years). Among those who experienced events, median (SD) time to event was 11.4 (5.3) years. When modeled continuously (per 1 SD), FGF‐23 was positively associated with HF risk, regardless of degree of adjustment (Table 2). A threshold effect was also observed between FGF‐23 and risk of incident HF (Figure – Panel B). Compared with those in the referent category (<40 pg/mL), the HR (95% CI) among those in the top category of FGF‐23 (≥58.8 pg/mL) was 1.75 (1.52 to 2.01) after demographic adjustments (Table 2). Further adjustment for behaviors (1.63 [1.42 to 1.88]), cardiovascular risk factors (1.46 [1.27 to 1.68]), and eGFR (1.30 [1.13 to 1.51]) modestly attenuated the association. Also adjusting for serum phosphorous and PTH had little impact on the HRs: 1.27 (1.09 to 1.47) for phosphorous and 1.30 (1.12 to 1.51) for PTH. Results were stronger in sensitivity analyses when follow‐up time was restricted to the first 5 years of follow‐up: N events total/top category (230/62); model 1: 2.28 (1.63 to 3.18) and model 4: 1.48 (1.03 to 2.11).
The relation between FGF‐23 and incident HF was not modified by age, sex, or race, although qualitatively associations were somewhat stronger in blacks than in whites (Table 3). There was no statistically significant interaction of the HF and FGF‐23 association by eGFR category; however, stratified results are presented in Table 4.
Incident Cardiovascular Mortality
A total of 802 participants died of cardiovascular causes during follow‐up. The median time to event was 11.2 (SD 4.1) years. A positive association was observed between FGF‐23 when modeled per 1 SD and cardiovascular mortality. Similar to other outcomes, there was evidence of a threshold association (Figure – Panel C). Relative to those with FGF‐23 concentrations <40 pg/mL, those in the highest category (≥58.8 pg/mL) had a HR for cardiovascular mortality of 1.65 (1.36 and 2.01) after demographic adjustments (model 1) (Table 2). In the fully adjusted model (model 4), the HR (top versus bottom category) for cardiovascular mortality was 1.28 (1.04 to 1.57). Results were similar when serum phosphorus was included with model 4 covariates (1.23 [1.01 to 1.52]) and when PTH was included with model 4 covariates (1.28 [1.04 to 1.58]). Restricting follow‐up time to the first 5 years did yield stronger magnitudes of association: N events total/top category (96/30); model 1: 2.45 (1.50 to 3.99) and model 4: 1.61 (0.96 to 2.70).
There were no statistically significant interactions by age, or sex. The association between FGF‐23 and cardiovascular mortality was stronger among blacks relative to whites (P‐interaction model 1=0.02; P‐interaction model 4=0.02) (Table 3). eGFR category modified the association between FGF‐23 and cardiovascular mortality in demographic‐adjusted models (P‐interaction=0.05) but not after accounting for behaviors and cardiovascular risk factors. eGFR‐stratified results are presented in Table 4.
Sensitivity Analyses
In sensitivity analyses, we explored the impact of adjusting for eGFR as a continuous variable and estimating GFR by using alternate equations. Results were similar regardless of how eGFR was modeled or calculated (data not shown). We also adjusted (separately) for ln(NT‐proBNP) and ln(hs‐TnT) and LVH presence by using the Cornell criteria. The results were attenuated only slightly (data not shown). Notably, the ARIC population was relatively young at visit 2, when the serum used for FGF‐23 measurement was collected, and only 2% of the sample had LVH according to the Cornell criteria.
In order to further isolate our sample to people free of renal impairment, we restricted our analysis to participants who attended visit 4 (when urine was collected), were at visit 4 free of prevalent CHD or HF, had an albumin‐to‐creatinine ratio of >30 at visit 4, and an eGFR ≥60 at visit 2 (analytic sample=8397). After adjustment for cardiovascular risk factors, the HR's comparing those in the top FGF‐23 category to those with FGF‐23 <40 pg/mL were as follows: MI: 1.36 (1.06, 1.76); HF: 1.29 (1.04, 1.60), cardiovascular mortality: 1.57 (1.15, 2.14).
Discussion
In this large, biracial, population‐based cohort, we observed a threshold effect in the association of FGF‐23 and risk of incident CHD, HF, and cardiovascular mortality. A positive association was present between FGF‐23 and risk of outcomes at FGF‐23 levels above 40 pg/mL, whereas at levels <40 pg/mL there was no association. Relative to participants at <40 pg/mL, those in the highest category of FGF‐23 (≥58.8 pg/mL) were at 44% greater risk of incident CHD, 46% greater risk of HF, and 51% greater risk of cardiovascular mortality, after adjustment for demographics, behaviors, and traditional cardiovascular risk factors. These associations were independent of serum phosphorus, and additional adjustment for markers of kidney function only modestly attenuated the associations. Furthermore, even when our analysis was restricted to individuals estimated to have normal kidney function (eGFR ≥90 mL/min per 1.73 m2), elevated FGF‐23 was associated with greater risk of incident CHD and HF independent of traditional cardiovascular risk factors. Finally, the associations were at least as strong, and in some cases qualitatively stronger, among African Americans, a relatively understudied group. These findings extend the results of prior studies by showing that FGF‐23 may be a risk factor for cardiovascular disease and mortality among those with normal kidney function, that elevated FGF‐23 is associated with greater risk of CHD, and by having adequate power to examine the association between FGF‐23 and outcomes in African Americans.
There are several mechanisms through which elevated FGF‐23 may increase the risk of CHD and HF. First, FGF‐23 may directly contribute to remodeling of the left ventricle by eccentric or concentric hypertrophy. This is supported by experimental rodent models11 and observational human studies that have shown high circulating FGF‐23 to be associated with LVH in the elderly31 and both LVH prevalence32–33 and incidence11 in populations with kidney impairment. Additionally, high circulating FGF‐23 has been associated with endothelial dysfunction33–35 and inflammation.36–37 Whether FGF‐23 is associated with atherosclerosis is controversial.2–3 It is possible that phosphate excess, which is upstream to high FGF‐23, induces vascular calcification and atherosclerosis, independent of FGF‐23.2–3 Prior work has shown elevated serum phosphorous to be associated with vascular calcification,38 myocardial fibrosis,39 the development of LVH,40 and greater risk of incident cardiovascular disease41–45 (P. L. Lutsey, PhD, MPH, unpublished data, 2014).
Enhanced understanding of the relation between FGF‐23 and cardiac pathophysiology may also provide insight into the mechanisms through which CKD increases the risk of CHD and HF. Levels of FGF‐23 are correlated inversely with renal function4–5 and are known to increase dramatically in advanced CKD.4,46 It is difficult to disentangle the relations between FGF‐23 and kidney function as estimated by using GFR. However, in the present analysis, associations between FGF‐23 and incident CHD and HF were independent of eGFR and remained present when analyses were restricted to those with normal kidney function (eGFR ≥90 mL/min per 1.73 m2), suggesting that FGF‐23 may have actions independent of kidney disease quantified by reduced eGFR. We used both serum creatinine and cystatin to provide a better estimate of eGFR.27
The Heart and Soul Study previously reported a positive association between FGF‐23 and recurrent cardiovascular disease.17 FGF‐23 was also positively associated with risk of incident HF and total cardiovascular events in the Cardiovascular Health Study18 and with cardiovascular mortality in the Uppsala Longitudinal Study of Adult Men.19 Both of these cohorts are population‐based studies of elderly individuals, and in both interactions were present, whereby associations were stronger among individuals with impaired kidney function but substantially weaker or absent among those with normal kidney function. We observed no such interaction in the younger ARIC study population; associations between FGF‐23 and incident HF and CHD were equally strong among individuals with normal kidney function. In ARIC, elevated FGF‐23 was associated with an ≈50% greater risk of incident CHD. This is in contrast to 3 smaller population‐based studies which have shown no relation between FGF‐23 and risk of CHD.17–18,47 FGF‐23 has, however, been associated with greater risk of atherosclerotic events among patients with CKD.13
Identifying novel biomarkers for cardiovascular disease may enhance our etiologic understanding and improve our ability to identify high‐risk individuals and possibly lead to new therapeutic targets. Importantly, given the relatively modest magnitudes of association between FGF‐23 and the outcomes presented here, it is unlikely that the use of FGF‐23 would improve risk prediction. However, because FGF‐23 is physiologically active (unlike cystatin C and serum creatinine, which are markers for CKD, as opposed to causal risk factors), it may be a potential target for intervention. Three pharmacologic strategies have been proposed: oral phosphate binders, FGF‐23 blocking agents, and FGF receptor antagonists.3 Oral phosphate binders, the only of these options presently available, are commonly given to patients on dialysis and those with severe renal failure and have been shown to be effective in lowering FGF‐23 levels.48–49 Clinical trials will need to demonstrate that lowering FGF‐23 is efficacious in reducing cardiovascular disease (or possibly surrogates) and/or mortality before there would be justification for the widespread use of these agents.
Strengths of this study are the prospective design, biracial population‐based sample, detailed ascertainment of established cardiovascular risk factors, active outcome surveillance, large number of events, and corresponding power for subgroup analyses. Also, importantly, the assay used in the present study detects biologically active intact FGF‐23, while many prior studies have used an assay that measures inactive C‐terminal FGF‐23 concentrations. Perhaps the major limitation of the present study is that FGF‐23 was measured in singlicate at a single point in time and was associated with moderate analytic error (CV 16%). As a result, regression dilution bias may have attenuated relative hazard estimates.50 This concept is supported by associations between FGF‐23 and incident events being of greater magnitude when we restricted our analysis to the first 5 years of follow‐up. HF events were identified through ICD codes from hospital discharge and death certificates; thus, cases of HF that were managed exclusively in outpatient settings would have been missed. However, ARIC has shown HF ICD codes to have high validity.51 Last, as with all observational studies, it is possible that both residual and unmeasured confounding remained, despite our attempts at adjustment.
In conclusion, in this large, population‐based cohort, high levels of FGF‐23 were associated with greater risk of incident CHD, HF, and cardiovascular mortality. These associations were independent of traditional cardiovascular disease risk factors and were present both in the absence of reduced kidney function and among African Americans. These data are of interest from a pathophysiologic perspective and suggest the potential of FGF‐23 as a target for therapeutic intervention to reduce risk of CHD, HF, and cardiovascular mortality.
Sources of Funding
This research was supported by grants from the National Heart, Lung, and Blood Institute (R01 HL103706, Lutsey PI) and the National Institute of Diabetes and Digestive and Kidney Diseases (R01 DK089174, Selvin PI). The Atherosclerosis Risk In Communities Study is carried out as a collaborative study supported by National Heart, Lung, and Blood Institute contracts (HHSN268201100005C, HHSN268201100006C, HHSN268201100007C, HHSN268201100008C, HHSN268201100009C, HHSN268201100010C, HHSN268201100011C, and HHSN268201100012C).
Disclosures
None.
Acknowledgments
The authors thank the staff and participants of the ARIC Study for their important contributions.
References
- 1.Shimada T, Hasegawa H, Yamazaki Y, Muto T, Hino R, Takeuchi Y, Fujita T, Nakahara K, Fukumoto S, Yamashita T. FGF‐23 is a potent regulator of vitamin D metabolism and phosphate homeostasis. J Bone Miner Res. 2004; 19:429-435. [DOI] [PubMed] [Google Scholar]
- 2.Wolf M. Update on fibroblast growth factor 23 in chronic kidney disease. Kidney Int. 2012; 82:737-747. [DOI] [PMC free article] [PubMed] [Google Scholar]
- 3.Heine GH, Seiler S, Fliser D. FGF‐23: the rise of a novel cardiovascular risk marker in CKD. Nephrol Dial Transplant. 2012; 27:3072-3081. [DOI] [PubMed] [Google Scholar]
- 4.Shigematsu T, Kazama JJ, Yamashita T, Fukumoto S, Hosoya T, Gejyo F, Fukagawa M. Possible involvement of circulating fibroblast growth factor 23 in the development of secondary hyperparathyroidism associated with renal insufficiency. Am J Kidney Dis. 2004; 44:250-256. [DOI] [PubMed] [Google Scholar]
- 5.Gutierrez O, Isakova T, Rhee E, Shah A, Holmes J, Collerone G, Juppner H, Wolf M. Fibroblast growth factor‐23 mitigates hyperphosphatemia but accentuates calcitriol deficiency in chronic kidney disease. J Am Soc Nephrol. 2005; 16:2205-2215. [DOI] [PubMed] [Google Scholar]
- 6.Fliser D, Kollerits B, Neyer U, Ankerst DP, Lhotta K, Lingenhel A, Ritz E, Kronenberg Ffor the MSG. Fibroblast growth factor 23 (FGF‐23) predicts progression of chronic kidney disease: the Mild to Moderate Kidney Disease (MMKD) Study. J Am Soc Nephrol. 2007; 18:2600-2608. [DOI] [PubMed] [Google Scholar]
- 7.Gutierrez OM, Mannstadt M, Isakova T, Rauh‐Hain JA, Tamez H, Shah A, Smith K, Lee H, Thadhani R, Juppner H, Wolf M. Fibroblast growth factor 23 and mortality among patients undergoing hemodialysis. N Engl J Med. 2008; 359:584-592. [DOI] [PMC free article] [PubMed] [Google Scholar]
- 8.Isakova T, Xie H, Yang W, Xie D, Anderson AH, Scialla J, Wahl P, Gutierrez OM, Steigerwalt S, He J, Schwartz S, Lo J, Ojo A, Sondheimer J, Hsu CY, Lash J, Leonard M, Kusek JW, Feldman HI, Wolf M. Fibroblast growth factor 23 and risks of mortality and end‐stage renal disease in patients with chronic kidney disease. JAMA. 2011; 305:2432-2439. [DOI] [PMC free article] [PubMed] [Google Scholar]
- 9.Go AS, Chertow GM, Fan D, McCulloch CE, Hsu C‐Y. Chronic kidney disease and the risks of death, cardiovascular events, and hospitalization. N Engl J Med. 2004; 351:1296-1305. [DOI] [PubMed] [Google Scholar]
- 10.Wang L, Song Y, Manson JE, Pilz S, März W, Michaëlsson K, Lundqvist A, Jassal SK, Barrett‐Connor E, Zhang C, Eaton CB, May HT, Anderson JL, Sesso HD. Circulating 25‐hydroxy‐vitamin D and risk of cardiovascular disease: a meta‐analysis of prospective studies. Circ Cardiovasc Qual Outcomes. 2012; 5:819-829. [DOI] [PMC free article] [PubMed] [Google Scholar]
- 11.Faul C, Amaral AP, Oskouei B, Hu M‐C, Sloan A, Isakova T, Gutiérrez OM, Aguillon‐Prada R, Lincoln J, Hare JM, Mundel P, Morales A, Scialla J, Fischer M, Soliman EZ, Chen J, Go AS, Rosas SE, Nessel L, Townsend RR, Feldman HI, St. John Sutton M, Ojo A, Gadegbeku C, Di Marco GS, Reuter S, Kentrup D, Tiemann K, Brand M, Hill JA, Moe OW, Kuro‐o M, Kusek JW, Keane MG, Wolf M. FGF‐23 induces left ventricular hypertrophy. J Clin Invest. 2011; 121:4393-4408. [DOI] [PMC free article] [PubMed] [Google Scholar]
- 12.Desai CS, Ning H, Lloyd‐Jones DM. Competing cardiovascular outcomes associated with electrocardiographic left ventricular hypertrophy: the Atherosclerosis Risk in Communities Study. Heart. 2012; 98:330-334. [DOI] [PMC free article] [PubMed] [Google Scholar]
- 13.Scialla JJ, Xie H, Rahman M, Anderson AH, Isakova T, Ojo A, Zhang X, Nessel L, Hamano T, Grunwald JE, Raj DS, Yang W, He J, Lash JP, Go AS, Kusek JW, Feldman H, Wolf MInvestigators tCRICS. Fibroblast growth factor‐23 and cardiovascular events in CKD. J Am Soc Nephrol. 2014; 25:349-360. [DOI] [PMC free article] [PubMed] [Google Scholar]
- 14.Kendrick J, Cheung AK, Kaufman JS, Greene T, Roberts WL, Smits G, Chonchol MInvestigators tH. FGF‐23 associates with death, cardiovascular events, and initiation of chronic dialysis. J Am Soc Nephrol. 2011; 22:1913-1922. [DOI] [PMC free article] [PubMed] [Google Scholar]
- 15.Seiler S, Reichart B, Roth D, Seibert E, Fliser D, Heine GH. FGF‐23 and future cardiovascular events in patients with chronic kidney disease before initiation of dialysis treatment. Nephrol Dial Transplant. 2010; 25:3983-3989. [DOI] [PubMed] [Google Scholar]
- 16.Nakano C, Hamano T, Fujii N, Obi Y, Matsui I, Tomida K, Mikami S, Inoue K, Shimomura A, Nagasawa Y, Okada N, Tsubakihara Y, Rakugi H, Isaka Y. Intact fibroblast growth factor 23 levels predict incident cardiovascular event before but not after the start of dialysis. Bone. 2012; 50:1266-1274. [DOI] [PubMed] [Google Scholar]
- 17.Parker BD, Schurgers LJ, Brandenburg VM, Christenson RH, Vermeer C, Ketteler M, Shlipak MG, Whooley MA, Ix JH. The associations of fibroblast growth factor 23 and uncarboxylated matrix Gla protein with mortality in coronary artery disease: the Heart and Soul Study. Ann Intern Med. 2010; 152:640-648. [DOI] [PMC free article] [PubMed] [Google Scholar]
- 18.Ix JH, Katz R, Kestenbaum BR, de Boer IH, Chonchol M, Mukamal KJ, Rifkin D, Siscovick DS, Sarnak MJ, Shlipak MG. Fibroblast growth factor‐23 and death, heart failure, and cardiovascular events in community‐living individuals: CHS (Cardiovascular Health Study). J Am Coll Cardiol. 2012; 60:200-207. [DOI] [PMC free article] [PubMed] [Google Scholar]
- 19.Arnlov J, Carlsson AC, Sundstrom J, Ingelsson E, Larsson A, Lind L, Larsson TE. Higher fibroblast growth factor‐23 increases the risk of all‐cause and cardiovascular mortality in the community. Kidney Int. 2013; 83:160-166. [DOI] [PubMed] [Google Scholar]
- 20.The ARIC I. The Atherosclerosis Risk in Communities (ARIC) Study: design and objectives. Am J Epidemiol. 1989; 129:687-702. [PubMed] [Google Scholar]
- 21.Baecke JB, Burema J, Frijters JER. A short questionnaire for the measurement of habitual physical activity in epidemiological studies. Am J Clin Nutr. 1982; 36:936-942. [DOI] [PubMed] [Google Scholar]
- 22.Machado DB, Crow RS, Boland LL, Hannan PJ, Taylor HA, Jr, Folsom AR. Electrocardiographic findings and incident coronary heart disease among participants in the Atherosclerosis Risk in Communities (ARIC) study. Am J Cardiol. 2006; 97:1176-1181.e1173. [DOI] [PubMed] [Google Scholar]
- 23.Siedel J, Hagele EO, Ziegenhorn J, Wahlefeld AW. Reagent for the enzymatic determination of serum total cholesterol with improved lipolytic efficiency. Clin Chem. 1983; 29:1075-1080. [PubMed] [Google Scholar]
- 24.Nagele U, Hagele EO, Sauer G, Wiedemann E, Lehmann P, Wahlefeld AW, Gruber W. Reagent for the enzymatic determination of serum total triglycerides with improved lipolytic efficiency. J Clin Chem Clin Biochem. 1984; 22:165-174. [DOI] [PubMed] [Google Scholar]
- 25.Warnick GR, Benderson J, Albers JJ. Dextran sulfate‐Mg2+ precipitation procedure for quantitation of high‐density‐lipoprotein cholesterol. Clin Chem. 1982; 28:1379-1388. [PubMed] [Google Scholar]
- 26.Friedewald WT, Levy RI, Fredrickson DS. Estimation of the concentration of low‐density lipoprotein cholesterol in plasma, without use of the preparative ultracentrifuge. Clin Chem. 1972; 18:499-502. [PubMed] [Google Scholar]
- 27.Inker LA, Schmid CH, Tighiouart H, Eckfeldt JH, Feldman HI, Greene T, Kusek JW, Manzi J, Van Lente F, Zhang YL, Coresh J, Levey AS. Estimating glomerular filtration rate from serum creatinine and cystatin C. N Engl J Med. 2012; 367:20-29. [DOI] [PMC free article] [PubMed] [Google Scholar]
- 28.Eriksson H, Caidaul K, Larsson B, Ohlson L‐O, Welin L, Wilhelmsen L, Svardsudd K. Cardiac and pulmonary causes of dyspnoea—validation of a scoring test for clinical‐epidemiological use: the Study of Men Born in 1913. Eur Heart J. 1987; 8:1007-1014. [DOI] [PubMed] [Google Scholar]
- 29.Loehr LR, Rosamond WD, Chang PP, Folsom AR, Chambless LE. Heart failure incidence and survival (from the Atherosclerosis Risk in Communities Study). Am J Cardiol. 2008; 101:1016-1022. [DOI] [PubMed] [Google Scholar]
- 30.Folsom AR, Yatsuya H, Nettleton JA, Lutsey PL, Cushman M, Rosamond WD. Community prevalence of ideal cardiovascular health, by the American Heart Association definition, and relationship with cardiovascular disease incidence. J Am Coll Cardiol. 2011; 57:1690-1696. [DOI] [PMC free article] [PubMed] [Google Scholar]
- 31.Mirza MA, Larsson A, Melhus H, Lind L, Larsson TE. Serum intact FGF‐23 associate with left ventricular mass, hypertrophy and geometry in an elderly population. Atherosclerosis. 2009; 207:546-551. [DOI] [PubMed] [Google Scholar]
- 32.Gutierrez OM, Januzzi JL, Isakova T, Laliberte K, Smith K, Collerone G, Sarwar A, Hoffmann U, Coglianese E, Christenson R, Wang TJ, deFilippi C, Wolf M. Fibroblast growth factor 23 and left ventricular hypertrophy in chronic kidney disease. Circulation. 2009; 119:2545-2552. [DOI] [PMC free article] [PubMed] [Google Scholar]
- 33.Stevens K, McQuarrie E, Sands W, Hillyard D, Patel R, Mark P, Jardine A. Fibroblast growth factor 23 predicts left ventricular mass and induces cell adhesion molecule formation. Int J Nephrol. 2011; 2011:297070. [DOI] [PMC free article] [PubMed] [Google Scholar]
- 34.Mirza MA, Larsson A, Lind L, Larsson TE. Circulating fibroblast growth factor‐23 is associated with vascular dysfunction in the community. Atherosclerosis. 2009; 205:385-390. [DOI] [PubMed] [Google Scholar]
- 35.Yilmaz MI, Sonmez A, Saglam M, Yaman H, Kilic S, Demirkaya E, Eyileten T, Caglar K, Oguz Y, Vural A, Yenicesu M, Zoccali C. FGF‐23 and vascular dysfunction in patients with stage 3 and 4 chronic kidney disease. Kidney Int. 2010; 78:679-685. [DOI] [PubMed] [Google Scholar]
- 36.Manghat P, Fraser WD, Wierzbicki AS, Fogelman I, Goldsmith DJ, Hampson G. Fibroblast growth factor‐23 is associated with C‐reactive protein, serum phosphate and bone mineral density in chronic kidney disease. Osteoporos Int. 2010; 21:1853-1861. [DOI] [PubMed] [Google Scholar]
- 37.Munoz Mendoza J, Isakova T, Ricardo AC, Xie H, Navaneethan SD, Anderson AH, Bazzano LA, Xie D, Kretzler M, Nessel L, Hamm LL, Negrea L, Leonard MB, Raj D, Wolf MCohort ftCRI. Fibroblast growth factor 23 and inflammation in CKD. Clin J Am Soc Nephrol. 2012; 7:1155-1162. [DOI] [PMC free article] [PubMed] [Google Scholar]
- 38.Foley RN, Collins AJ, Herzog CA, Ishani A, Kalra PA. Serum phosphorus levels associate with coronary atherosclerosis in young adults. J Am Soc Nephrol. 2009; 20:397-404. [DOI] [PMC free article] [PubMed] [Google Scholar]
- 39.Amann K, Tornig J, Kugel B, Gross M‐L, Tyralla K, El‐Shakmak A, Szabo A, Ritz E. Hyperphosphatemia aggravates cardiac fibrosis and microvascular disease in experimental uremia. Kidney Int. 2003; 63:1296-1301. [DOI] [PubMed] [Google Scholar]
- 40.Foley RN, Collins AJ, Herzog CA, Ishani A, Kalra PA. Serum phosphate and left ventricular hypertrophy in young adults: the coronary artery risk development in young adults study. Kidney Blood Press Res. 2009; 32:37-44. [DOI] [PubMed] [Google Scholar]
- 41.Foley RN, Collins AJ, Ishani A, Kalra PA. Calcium‐phosphate levels and cardiovascular disease in community‐dwelling adults: the Atherosclerosis Risk in Communities (ARIC) Study. Am Heart J. 2008; 156:556-563. [DOI] [PubMed] [Google Scholar]
- 42.Tonelli M, Sacks F, Pfeffer M, Gao Z, Curhan G. Relation between serum phosphate level and cardiovascular event rate in people with coronary disease. Circulation. 2005; 112:2627-2633. [DOI] [PubMed] [Google Scholar]
- 43.Dhingra R, Sullivan LM, Fox CS, Wang TJ, D'Agostino RB, Sr, Gaziano JM, Vasan RS. Relations of serum phosphorus and calcium levels to the incidence of cardiovascular disease in the community. Arch Intern Med. 2007; 167:879-885. [DOI] [PubMed] [Google Scholar]
- 44.Dhingra R, Gona P, Benjamin EJ, Wang TJ, Aragam J, D'Agostino RB, Kannel WB, Vasan RS. Relations of serum phosphorus levels to echocardiographic left ventricular mass and incidence of heart failure in the community. Eur J Heart Fail. 2010; 12:812-818. [DOI] [PMC free article] [PubMed] [Google Scholar]
- 45.Lopez FL, Agarwal SK, Grams ME, Loehr LR, Soliman EZ, Lutsey PL, Chen LY, Huxley RR, Alonso A. Relation of serum phosphorus levels to the incidence of atrial fibrillation (from the Atherosclerosis Risk in Communities [ARIC] Study). Am J Cardiol. 2013; 111:857-862. [DOI] [PMC free article] [PubMed] [Google Scholar]
- 46.Isakova T, Wahl P, Vargas GS, Gutierrez OM, Scialla J, Xie H, Appleby D, Nessel L, Bellovich K, Chen J, Hamm L, Gadegbeku C, Horwitz E, Townsend RR, Anderson CAM, Lash JP, Hsu C‐Y, Leonard MB, Wolf M. Fibroblast growth factor 23 is elevated before parathyroid hormone and phosphate in chronic kidney disease. Kidney Int. 2011; 79:1370-1378. [DOI] [PMC free article] [PubMed] [Google Scholar]
- 47.Taylor EN, Rimm EB, Stampfer MJ, Curhan GC. Plasma fibroblast growth factor 23, parathyroid hormone, phosphorus, and risk of coronary heart disease. Am Heart J. 2011; 161:956-962. [DOI] [PMC free article] [PubMed] [Google Scholar]
- 48.Koiwa F, Kazama JJ, Tokumoto A, Onoda N, Kato H, Okada T, Nii‐Kono T, Fukagawa M, Shigematsu TGroup RODCR. Sevelamer hydrochloride and calcium bicarbonate reduce serum fibroblast growth factor 23 levels in dialysis patients. Ther Apher Dial. 2005; 9:336-339. [DOI] [PubMed] [Google Scholar]
- 49.Nagano N, Miyata S, Abe M, Kobayashi N, Wakita S, Yamashita T, Wada M. Effect of manipulating serum phosphorus with phosphate binder on circulating PTH and FGF‐23 in renal failure rats. Kidney Int. 2006; 69:531-537. [DOI] [PubMed] [Google Scholar]
- 50.Clarke R, Shipley M, Lewington S, Youngman L, Collins R, Marmot M, Peto R. Underestimation of risk associations due to regression dilution in long‐term follow‐up of prospective studies. Am J Epidemiol. 1999; 150:341-353. [DOI] [PubMed] [Google Scholar]
- 51.Rosamond WD, Chang PP, Baggett C, Johnson A, Bertoni AG, Shahar E, Deswal A, Heiss G, Chambless LE. Classification of heart failure in the Atherosclerosis Risk in Communities (ARIC) Study: a comparison of diagnostic criteria. Circ Heart Fail. 2012; 5:152-159. [DOI] [PMC free article] [PubMed] [Google Scholar]