Abstract
Background
Myocardial infarction remains the leading cause of morbidity and mortality associated with coronary artery disease. The L‐type calcium channel (ICa‐L) is critical to excitation and contraction. Activation of the channel also alters mitochondrial function. Here, we investigated whether application of a alpha‐interacting domain/transactivator of transcription (AID‐TAT) peptide, which immobilizes the auxiliary β2 subunit of the channel and decreases metabolic demand, could alter mitochondrial function and myocardial injury.
Methods and Results
Treatment with AID‐TAT peptide decreased ischemia‐reperfusion injury in guinea‐pig hearts ex vivo (n=11) and in rats in vivo (n=9) assessed with uptake of nitroblue tetrazolium, release of creatine kinase, and lactate dehydrogenase. Contractility (assessed with catheterization of the left ventricle) was improved after application of AID‐TAT peptide in hearts ex vivo (n=6) and in vivo (n=8) up to 12 weeks before sacrifice. In search of the mechanism for the effect, we found that intracellular calcium ([Ca2+]i, Fura‐2), superoxide production (dihydroethidium fluorescence), mitochondrial membrane potential (Ψm, JC‐1 fluorescence), reduced nicotinamide adenine dinucleotide production, and flavoprotein oxidation (autofluorescence) are decreased after application of AID‐TAT peptide.
Conclusions
Application of AID‐TAT peptide significantly decreased infarct size and supported contractility up to 12 weeks postcoronary artery occlusion as a result of a decrease in metabolic demand during reperfusion.
Keywords: ion channels, ischemia, peptides, reperfusion
Introduction
Minimizing myocardial damage and oxidative stress (OS) during reperfusion after ischemia is associated with a decrease in morbidity and mortality.1 Reperfusion of the ischemic heart during coronary occlusion remains the primary objective to prevent further cardiac damage in the clinical setting. However, the reperfusion period imposes deleterious effects as a result of the generation of reactive oxygen species (ROS) and increases in intracellular calcium ([Ca2+]i, Fura‐2) that contribute to development of cardiac hypertrophy and cardiac failure.2–3 ROS produced as a result of rapid changes in oxygen can influence the activity of ion channels. The function of the L‐type calcium channel (ICa‐L) is altered during changes in OS as a result of redox modification of the channel protein by H2O2.4–10 This leads to an increase in protein synthesis and cell size consistent with the development of myocyte hypertrophy.11–12 Increased calcium influx through the channel is sufficient to induce cardiac hypertrophy in mice overexpressing the alpha subunit,13 and increased expression of the β2 auxiliary subunit alters contractility and leads to single‐channel activity characteristic of heart failure.14–15 Therefore, ICa‐L represents a viable target for reduction of injury and prevention of remodeling after ischemia‐reperfusion (I/R).
ICa‐L is a heterotetramer comprised of the α1, β2, and α2‐δ subunits. The α1 subunit contains the pore‐forming (S5‐S6) and voltage‐sensing (S4) regions responsible for ion conductance. The β2 subunit binds to the α1 subunit at the alpha‐interacting domain (AID) and assists with the trafficking and insertion of the α1 subunit in the cell membrane.16 The β2 subunit also regulates inactivation of the current and couples to cytoskeletal proteins.16–18 ICa‐L is critical to cardiac excitation and contraction. Activation of the channel can also alter mitochondrial function. Calcium influx through the channel is sufficient to increase cytosolic calcium, mitochondrial calcium uptake, reduction of nicotinamide adenine dinucleotide (NAD+) to reduced nicotinamide adenine dinucleotide (NADH), superoxide production, and metabolic activity in a calcium‐dependent manner.19 Activation of the channel can also increase mitochondrial membrane potential (MMP). The response is reversible upon inactivation of the channel during voltage clamp and is mediated through the movement of cytoskeletal proteins.19 Application of a peptide derived against the AID of the channel using a transactivator of transcription (TAT) sequence to facilitate transfer across the membrane (AID‐TAT peptide) attenuates the increase in MMP and metabolic activity after activation of the channel.19 The peptide immobilizes the auxiliary β2 subunit and induces functional uncoupling from the actin cytoskeleton.20 Therefore, the channel can modulate mitochondrial function and metabolic activity in cardiac myocytes.
In this study, we tested the efficacy of AID‐TAT peptide in reducing damage in hearts exposed to I/R injury ex vivo. We demonstrate that the peptide significantly decreased infarct size. In addition, contractility was improved within 30 minutes after exposure to the peptide ex vivo and up to 12 weeks post‐CAL (coronary artery ligation) in rats in vivo. Superoxide production, NADH, flavoprotein oxidation, and metabolic activity were decreased after application of the peptide, suggesting that the peptide “supported” myocardial metabolism during the critical reperfusion period. Therefore, application of the AID‐TAT peptide may represent a viable therapy in the prevention of myocardial damage and support of contractile function post‐MI (myocardial infarction).
Methods
Synthesis of Peptides
A peptide corresponding to the α1‐β interaction domain in the I‐II linker of the α1C subunit was synthesized using the amino acid sequence, QQLEEDLKGYLDWITQAE20 (Auspep Pty. Ltd., Parkville, VIC, Australia). The scrambled peptide control was also synthesized (QKILGEWDLAQYTDQELE). A cell‐penetrating TAT sequence was tethered to the peptides with the amino acids, RKKRRQRRR‐(6‐aminohexanoic acid).
Animal Models
In vitro studies
Freshly isolated myocytes from 8‐week‐old male C57BL mice were used for all fluorescent studies.21–22 Animals were anesthetized with intraperitoneal injection of pentobarbitone sodium (240 mg/kg) before excision of the heart, as approved by the animal ethics committee of The University of Western Australia in accord with the Australian Code of Practice for the Care and Use of Animals for Scientific Purposes (NH&MRC, 8th Edition, 2013). A total number of 33 mice were used. All experiments were performed in Hepes‐buffered solution containing (in mmol/L) 5.3 KCl, 0.4 MgSO4.7H2O, 139 NaCl, 5.6 Na2HPO4.2H2O, 2.5 CaCl2, 5 glucose, 20 Hepes, and 2 glutamine (pH=7.4 at 37°C).
Ex vivo studies
Adult tricolor guinea pigs weighing ≈250 g were used for all ex vivo infarct size and contractility studies. Animals were anesthetized with intraperitoneal injection of pentobarbitone sodium (240 mg/kg) before excision of the heart, as approved by the animal ethics committee of The University of Western Australia in accord with the Australian Code of Practice for the Care and Use of Animals for Scientific Purposes (NH&MRC, 8th Edition, 2013). A total number of 76 guinea pigs were used.
In vivo studies
Adult Fischer rats weighing ≈250 g were used for all in vivo infarct size and contractility studies. Animals were anesthetized with 50 mg/kg of sodium pentobarbital, as approved by The UCLA Chancellor's Office of Animal Research Oversight in accord with the USPHS Policy and the Guide for the Care and Use of Laboratory Animals. A total number of 46 rats were used.
Ischemia‐Reperfusion
In vitro
Intact ventricular myocytes were exposed to 40 μmol/L of H2O2 for 5 minutes, followed by 10 U/mL of catalase (CAT) to degrade the H2O2, to mimic the effect of a transient OS in vivo associated with I/R injury, as previously described.10
Ex vivo studies
Hearts excised from guinea pigs were perfused retrogradely by a Langendorff apparatus. Hearts were exposed to 30 minutes of coronary perfusion with calcium‐containing Krebs‐Henseleit buffer solution at 7 mL/min, followed by 30 minutes of no‐flow ischemia and, finally, 30 minutes of reperfusion. AID‐TAT peptide or AID(S)‐TAT peptide (1 or 10 μmol/L) was administered immediately upon reperfusion.
In vivo studies
MI was induced under aseptic conditions in Fischer rats with ligation of the coronary artery for 30 minutes using methods adapted from previous studies.23–24 Three minutes after reperfusion, AID‐TAT peptide or AID(S)‐TAT peptide, or saline, was injected into the chamber of the left ventricle (LV) such that the final circulating concentration of the peptide in the blood of the rat was 1 or 10 μmol/L, the chest was closed, and the rats were allowed to recover for up to 12 weeks.
Measurement of Intracellular Calcium
[Ca2+]i was monitored in myocytes using the fluorescent indicator, Fura‐2 AM (Fura‐2, 1 μmol/L, excitation 340/380 nm, emission 510 nm; Molecular Probes, Eugene, OR) at 37°C, as previously described.10 Fluorescence at 340/380‐nm excitation and 510‐nm emission were measured at 1‐minute intervals with an exposure of 50 ms on a Hamamatsu Orca ER digital camera (Hamamatsu Photonics, K.K., Hamamatsu City, Japan) attached to an inverted Nikon TE2000‐U microscope (Nikon Corporation, Tokyo, Japan). Ratiometric 340/380‐nm signal of individual myocytes was quantified using MetaMorph 6.3 (Molecular Devices, Sunnyvale, CA) to measure signal intensity of manually traced cell regions. An equivalent region not containing cells was used for background and was subtracted. Fluorescent ratios recorded over 3 minutes were averaged 2 minutes after incubation with drugs and reported as a percentage change from the baseline pretreatment average.
Measurement of Superoxide
Superoxide generation was assessed in myocytes using fluorescent DHE (5 μmol/L, 515 to 560‐nm excitation filter, 590‐nm long‐pass emission) at 37°C, as previously described.10 Fluorescent signal was acquired at 1‐minute intervals with 200‐ms exposure on a Hamamatsu Orca ER digital camera (Hamamatsu Photonics, K.K.) attached to an inverted Nikon TE2000‐U microscope (Nikon Corporation). MetaMorph 6.3 (Molecular Devices) was used to quantify the signal by manually tracing myocytes. An equivalent region not containing cells was used as background and was subtracted. Fluorescence was reported as the slope of the signal measured at 16 to 30 minutes (treatment) as a percentage change from the slope measured at 1 to 15 minutes (basal).
Measurement of MMP (Ψm)
The fluorescent indicator, 5,5′,6,6′‐tetrachloro‐1,1′,3,3′‐tetraethylbenzimidazolylcarbocyanine iodide (JC‐1; 200 nmol/L, excitation 480 nm, emission 580/535 nm; Molecular Probes), was used to measure Ψm at 37°C, as previously described.10 Fluorescence at 480‐nm excitation and 580/535‐nm emission signal were measured at 2‐minute intervals with an exposure of 50 ms on a Hamamatsu Orca ER digital camera (Hamamatsu Photonics, K.K.) attached to an inverted Nikon TE2000‐U microscope (Nikon Corporation). Ratiometric 580/535‐nm signal of individual myocytes were quantified using MetaMorph 6.3 (Molecular Devices) to measure signal intensity of manually traced myocytes. An equivalent region not containing cells was used as background and was subtracted. Fluorescent ratios recorded over 3 minutes before and 7 minutes after addition of drugs were averaged and alterations in fluorescent ratios reported as a percentage increase from the basal average. To confirm that the JC‐1 signal was indicative of Ψm, 4 mmol/L of sodium cyanide (NaCN) was added at the end of each experiment to collapse Ψm. In addition, individual 580‐ and 535‐nm signals were assessed in each experiment to confirm that the fluorescent indicator was accurately measuring Ψm.
Measurement of Mitochondrial Flavoprotein Oxidation
Flavoprotein autofluorescence was used to measure flavoprotein oxidation in myocytes at 37°C based on previously described methods (excitation 480 nmol/L, emission 535 nm).25 Fluorescent images were taken at 1‐minute intervals with 1.5 seconds of exposure on a Hamamatsu Orca ER digital camera (Hamamatsu Photonics, K.K.) attached to an inverted Nikon TE2000‐U microscope (Nikon Corporation). MetaMorph 6.3 (Molecular Devices) was used to quantify the signal by manually tracing myocytes. An equivalent region not containing cells was used as background and was subtracted. Fluorescent values recorded over 5 minutes before and 7 minutes after addition of drugs were averaged and alterations in fluorescent ratios reported as percentage increase from the basal average. FCCP (10 μmol/L) was added at the end of each experiment to achieve a maximum fluorescence value indicative of maximum flavoprotein oxidation.
Measurement of Mitochondrial NADH
Autofluorescence of NADH was monitored in myocytes at 37°C, as previously described (excitation 365 nmol/L, emission 460/535 nm).12 Fluorescence at 365‐nm exciation and 460/535‐nm emission were measured at 1‐minute intervals with 1.5 seconds of exposure on a Hamamatsu Orca ER digital camera (Hamamatsu Photonics, K.K.) attached to an inverted Nikon TE2000‐U microscope (Nikon Corporation). Ratiometric 460/535‐nm signal of individual myocytes were quantified using MetaMorph 6.3 (Molecular Devices) to measure signal intensity of manually traced myocytes. An equivalent region not containing cells was used as background and was subtracted. Fluorescent ratios recorded over 3 minutes before and 7 minutes after treatments were averaged and alterations in fluorescent ratio were reported as percentage increase from the baseline average. To confirm that the NADH signal was indicative of mitochondrial NADH production, 4 mM of sodium cyanide was added at the end of each experiment to deplete mitochondria of NADH after collapse of Ψm.
Creatine Kinase and Lactate Dehydrogenase Assays
Creatine kinase (CK) and lactate dehydrogenase (LDH) levels were determined from perfusate from ex vivo hearts before and after ischemia, as previously described.4 CK activity was determined using a Randox CK N‐acetyl‐l‐cysteine‐activated diagnostic kit (Randox Laboratories Ltd., Crumlin, UK). The rate of increase in absorbance was measured at 340 nm (PowerWave XS; BioTek Instruments, Inc., Winooski, VT) over 15 minutes at 30°C. CK activity was calculated using the following equation: CK activity (U/L)=4127×Δ Abs 340 nm/min. To determine LDH activity, 150 μL of perfusate was mixed with 50 μL of LDH assay buffer (50 mmol/L of imidazole, 375 μmol/L of NADH, 4 mmol/L of pyruvate, and 0.05% BSA; pH 7.0) and the rate of decrease in absorbance was measured at 340 nm (PowerWave XS; BioTek) over 15 minutes at 25°C. LDH activity was calculated using the following equation: LDH activity (U/mL)=([Δ Abs 340 nm/min TEST−Δ Abs 340 nm/min BLANK][3][dilution factor])/([6.22][0.1]).
Measurement of Infarct Size
Following ex vivo or in vivo I/R protocols, hearts were stained with 0.1% nitroblue tetrazolium dye to assess infarct size. Area of damage was quantitated using ImageJ software (National Institutes of Health, Bethesda, MD) and reported as percentage (%) of LV area.
Glutathione Assay
Reduced glutathione/oxidized glutathione (GSH/GSSG) ratio was determined in ischemia‐reperfused hearts based on previously described methods.4,26 Tissue homogenates were centrifuged at 8000×g for 10 minutes at 4°C, and GSH/GSSG ratio was measured from the supernatant. Fluorescence was detected using a spectrophotometer (PowerWave XS; BioTek) at 412 nm.
Contractility Studies
Ex vivo
LV pressure (LVP) was assessed in guinea pig hearts exposed to I/R by inserting a fluid‐filled latex balloon connected to a pressure transducer into the left ventricular chamber. LVP measurements were recorded using a PowerLab data acquisition system and LabChart7 (ADInstruments, Bella Vista, NSW, Australia). The balloon was inflated to an end‐diastolic pressure of 10 mm Hg, and the volume was maintained throughout the experiment. Coronary perfusion was maintained at 7 mL/min. LV developed pressure was calculated as follows: max pressure (mm Hg)–min pressure (mm Hg).
In vivo
Ventricular function was assessed at 12 weeks post‐MI (end of study) by catheterization of the LV with a 2.0‐Fr catheter (Millar Instruments, Houston, TX), as previously described.23 Rats were anesthetized with isoflurane, intubated, the chest opened, and the Millar catheter inserted directly into the LV through a 20‐Ga angiocatheter. After stabilization, LVPs, contractility, and relaxation (±dP/dT) data were acquired and analyzed with HEM V4.2 software (Notocord Systems, Croissy sur Seine, France). All hemodynamic data were recorded continuously for at least 30 minutes to ensure physiological levels of pressures and heart rates. For the peptide control study without an infarct, a femoral artery was also catheterized for pressure recording and peptide infusion. At the end of the functional evaluation, the rat was euthanized with an overdose of anesthetic, the hearts removed, weighed, and stained for infarct size.
Statistical Analysis
Results are reported as mean±SEM. Statistical comparisons of responses between unpaired data were made using the Student's t‐test or between groups of cells using 1‐way ANOVA and Tukey's post‐hoc test. Where sample sizes were small and did not fit a Gaussian distribution, we used the nonparametric Kruskal‐Wallis test, followed by Dunn's multiple comparison test to identify the significant data (GraphPad Prism version 3.02; GraphPad Software, Inc., La Jolla, CA).
Results
AID‐TAT Peptide Decreases I/R Injury in Hearts Ex Vivo
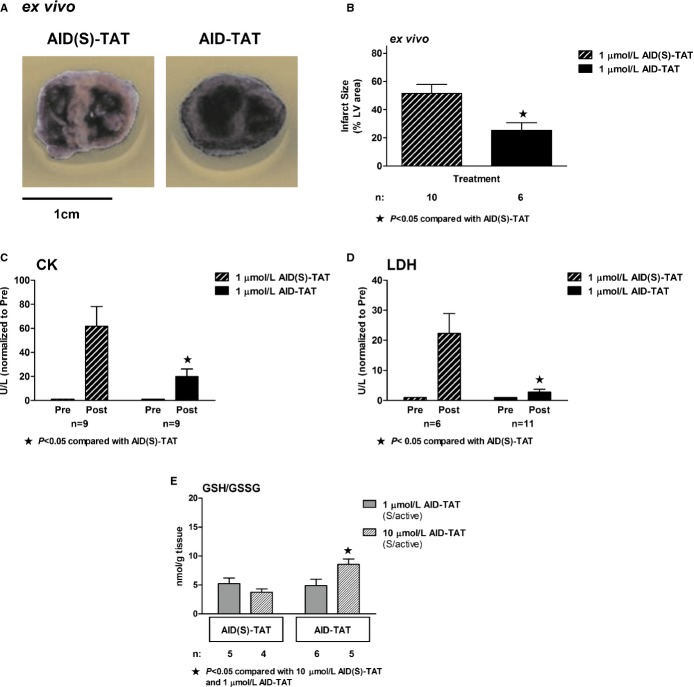
We examined the effect of a single application of 1 μmol/L of AID‐TAT peptide injected into the coronaries through the aorta within 5 minutes after commencement of reperfusion in hearts exposed to 30 minutes of no‐flow ischemia on a Langendorff apparatus. In hearts exposed to active peptide, infarct size was significantly decreased, compared to hearts exposed to 1 μmol/L of scrambled peptide (AID(S)‐TAT) (Figure 1A and 1B). Release of CK (Figure 1C) and LDH (Figure 1D) was significantly less in hearts exposed to active peptide. However, the ratio of GSH/GSSG was not altered after administration of 1 μmol/L of AID‐TAT. When the concentration of the active peptide was increased to 10 μmol/L, GSH increased, suggesting an attenuation of OS (Figure 1E).
Figure 1.
AID‐TAT peptide decreases ischemia‐reperfusion (I/R) injury in hearts ex vivo. A, Representative sections from guinea pig hearts after I/R treated with 1 μmol/L of scrambled (AID(S)‐TAT) or active (AID‐TAT) peptides. Infarct size is assessed as area that did not take up nitroblue tetrazolium dye. B, Mean±SEM of infarct size expressed as percentage (%) of total left ventricular (LV) area for all hearts treated with AID(S)‐TAT or AID‐TAT as indicated. C, Creatine kinase (CK) activity of hearts treated with 1 μmol/L of scrambled (AID(S)‐TAT) or active (AID‐TAT) peptides before (Pre) and after (Post) ischemia as indicated. D, Lactate dehydrogenase (LDH) activity of hearts treated with 1 μmol/L of scrambled (AID(S)‐TAT) or active (AID‐TAT) peptides before (Pre) and after (Post) ischemia as indicated. E, GSH/GSSG ratio of hearts treated with 1 or 10 μmol/L of scrambled (AID(S)‐TAT) or active (AID‐TAT) peptides before (Pre) and after (Post) ischemia as indicated. n represents number of hearts. Statistical significance was determined using the Kruskal‐Wallis test followed by Dunn's multiple comparison test. AID indicates alpha‐interacting domain; GSH/GSSG, glutathione to oxidized glutathione; TAT, transactivator of transcription.
AID‐TAT Peptide Improves Developed Pressure in Hearts Ex Vivo
We examined the effect of AID‐TAT peptide on contractility ex vivo in hearts exposed to ischemia then reperfusion. In hearts exposed to scrambled peptide, developed pressure decreased during reperfusion and did not improve during the 30 minutes after ischemia (Figure 2A and 2B). Application of 1 μmol/L of AID‐TAT had no effect on postischemia recovery; however, 10 μmol/L of AID‐TAT significantly improved developed pressure 20 to 30 minutes after ischemia (Figure 2D and 2E). Application of 10 μmol/L of AID‐TAT peptide did not alter developed pressure over 60 minutes in the absence of I/R (Figure 2E).
Figure 2.
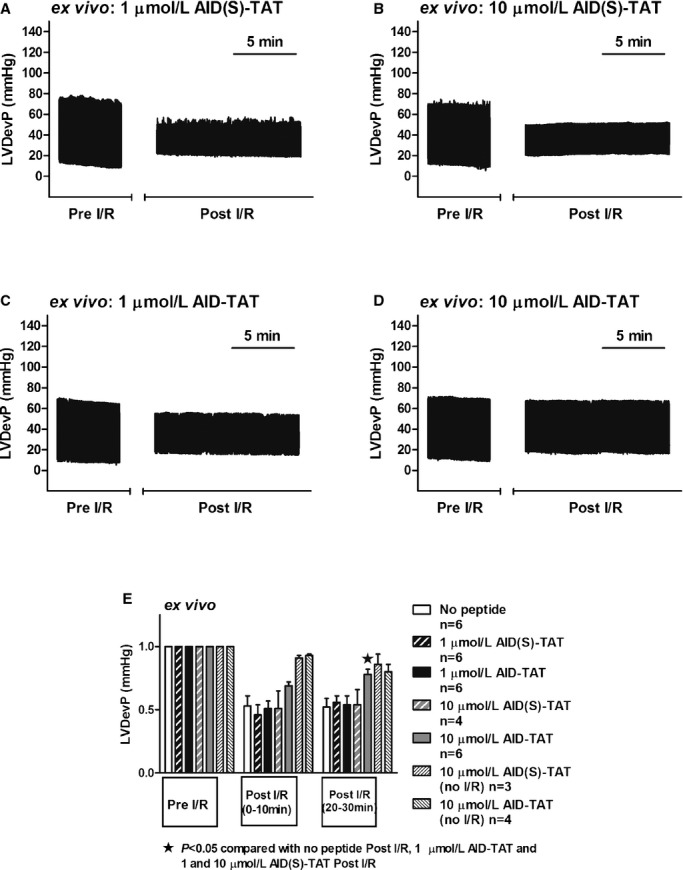
AID‐TAT peptide improves developed pressure in hearts ex vivo. A through D, Left ventricular developed pressure (LVDevP) traces over time (compressed) of ex vivo hearts treated with 1 (A) or 10 μmol/L (B) of scrambled (AID(S)‐TAT) peptide or 1 (C) or 10 μmol/L (D) of active (AID‐TAT) peptide before ischemia‐reperfusion (Pre I/R) and after (Post I/R) as indicated. E, Mean±SEM of LVDevP for all hearts treated with 1 or 10 μmol/L of AID(S)‐TAT or AID‐TAT peptide as indicated (n represents number of hearts). Statistical significance was determined using the Kruskal‐Wallis test followed by Dunn's multiple comparison test. AID indicates alpha‐interacting domain; TAT, transactivator of transcription.
Effect of AID‐TAT Peptide on Calcium Influx In Vitro
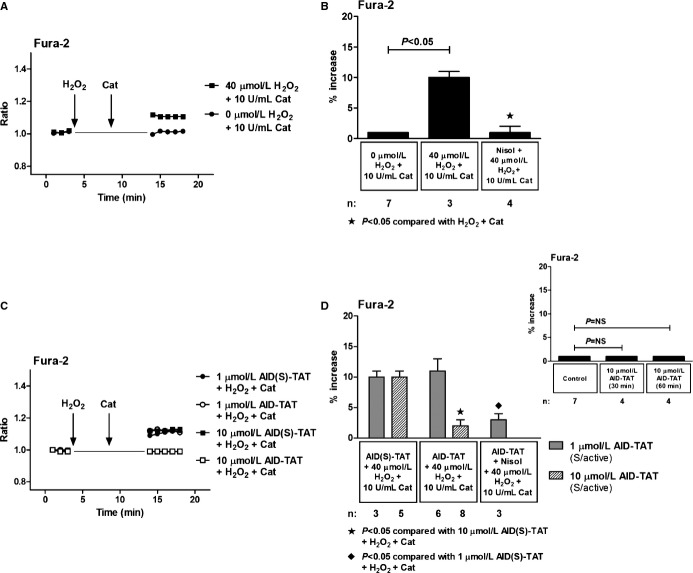
Because AID‐TAT peptide slows the inactivation rate of ICa‐L current,19–20 we examined the effect of the peptide on changes in [Ca2+]i after activation of the channel. We and others have shown previously that application of H2O2 can directly increase ICa‐L current.4,10–11 As little as 5 minutes of exposure to 30 to 50 μmol/L of H2O2 can cause further release of superoxide from the mitochondria without inducing apoptosis or necrosis and is sufficient to increase protein synthesis, consistent with the development of myocyte hypertrophy.10,12 ROS‐induced ROS‐release is proposed to occur during reperfusion and can lead to mitochondrial permeability transition pore opening and arrhythmia.27–29 We mimicked the OS associated with reperfusion by applying 40 μmol/L of H2O2 to ventricular myocytes for 5 minutes, followed by 10 U/mL of CAT to degrade the H2O2. Consistent with previous studies,10 addition of H2O2 resulted in a small, but significant, increase in [Ca2+]i assessed as changes in Fura‐2 that could be attenuated with addition of the ICa‐L antagonist, nisoldipine (Figure 3A and 3B). Application of 1 μmol/L of AID‐TAT peptide had no effect on the increase in Fura‐2 signal induced by 40 μmol/L of H2O2. However, the addition of 10 μmol/L of AID‐TAT peptide attenuated the increase in Fura‐2 signal induced by H2O2 by ≈75% (Figure 3C and 3D). Application of AID‐TAT peptide did not alter basal Fura‐2 signal, indicating that the peptide did not prevent calcium influx through the alpha subunit of the channel (Figure 3D, inset right). These data suggest that 10 μmol/L, but not 1 μmol/L, of AID‐TAT peptide can alter ICa‐L‐activated calcium influx in myocytes.
Figure 3.
Effect of AID‐TAT peptide on calcium influx in vitro. A, Representative traces of ratiometric Fura‐2 fluorescence recorded in a myocyte before and after 5 minutes of exposure to 40 μmol/L of H2O2 followed by 5 minutes of exposure to 10 U/mL of catalase and a myocyte before and after 5 minutes of exposure to 0 μmol/L of H2O2 followed by 5 minutes of exposure to 10 U/mL of catalase. Vertical arrows indicate when drugs were added. B, Mean±SEM of changes in ratiometric Fura‐2 fluorescence for all myocytes exposed to 40 μmol/L of H2O2, 10 U/mL of catalase, and 10 μmol/L of nisoldipine (Nisol) as indicated. C, Representative traces of ratiometric Fura‐2 fluorescence recorded in myocytes before and after 5 minutes of exposure to 40 μmol/L of H2O2 followed by 5 minutes of exposure to 10 U/mL of catalase in the presence of either 1 or 10 μmol/L of AID(S)‐TAT or AID‐TAT peptide as indicated. Vertical arrows indicate when drugs were added. D, Mean±SEM of changes in ratiometric Fura‐2 fluorescence for all myocytes exposed to 40 μmol/L of H2O2, 10 U/mL of catalase, 1 or 10 μmol/L of AID(S)‐TAT or AID‐TAT peptide, and 10 μmol/L of nisoldipine (Nisol) as indicated. Statistical significance was determined using the Kruskal‐Wallis test followed by Dunn's multiple comparison test. Inset above: mean±SEM of changes in ratiometric Fura‐2 fluorescence for myocytes before and 30 and 60 minutes after exposure to 10 μmol/L of AID‐TAT peptide as indicated. AID indicates alpha‐interacting domain; TAT, transactivator of transcription.
Effect of AID‐TAT Peptide on Cellular Superoxide In Vitro
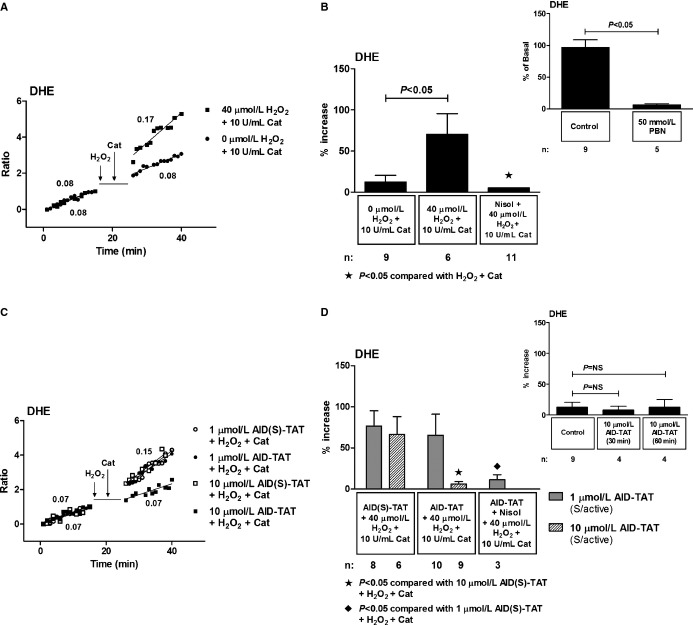
We have shown previously that 5 minutes of exposure of myocytes to H2O2 results in a significant further increase in superoxide assessed as changes in dihydroethidium (DHE) fluorescence in guinea pig ventricular myocytes.10,30 The further increase in superoxide occurred as a result of increased calcium uptake into mitochondria, increased reduction of NAD+, and increased electron flow into mitochondrial complex II.30 We assessed the effect of AID‐TAT peptide on DHE fluorescence in ventricular myocytes from C57BL mice. Application of 40 μmol/L of H2O2 resulted in 70.3±25.1% further increase in DHE signal that was completely attenuated with nisoldipine (Figure 4A and 4B). Application of the superoxide scavenger, N‐tert‐butyl‐α‐phenyl‐nitrone (PBN), completely abolished DHE signal, confirming specificity of the indicator for superoxide (Figure 4B, inset right). Application of 1 μmol/L of AID‐TAT peptide had no effect on the H2O2‐induced increase in DHE signal, but 10 μmol/L of AID‐TAT peptide significantly attenuated the increase in DHE signal (Figure 4C and 4D). AID‐TAT peptide had no effect on the DHE signal in the absence of H2O2, indicating that basal production of superoxide was unaffected by the peptide (Figure 4D, inset right).
Figure 4.
Effect of AID‐TAT peptide on cellular superoxide in vitro. A, Representative traces of DHE recorded in a myocyte before and after 5 minutes exposure to 40 μmol/L of H2O2 followed by 5 minutes of exposure to 10 U/mL of catalase and a myocyte before and after 5 minutes of exposure to 0 μmol/L of H2O2 followed by 5 minutes of exposure to 10 U/mL of catalase. Vertical arrows indicate when drugs were added. B, Mean±SEM of changes in DHE for all myocytes exposed to 40 μmol/L of H2O2, 10 U/mL of catalase, and 10 μmol/L of nisoldipine (Nisol) as indicated. Inset above: the superoxide scavenger, N‐tert‐butyl‐α‐phenyl‐nitrone (PBN), caused a 93.6±1.9% decrease in the rate of DHE signal. C, Representative traces of DHE recorded in myocytes before and after 5 minutes of exposure to 40 μmol/L of H2O2 followed by 5 minutes of exposure to 10 U/mL of catalase in the presence of either 1 or 10 μmol/L of AID(S)‐TAT or AID‐TAT peptide as indicated. Vertical arrow indicates when drugs were added. D, Mean±SEM of changes in DHE for all myocytes exposed to 40 μmol/L of H2O2, 10 U/mL of catalase, 1 or 10 μmol/L of AID(S)‐TAT or AID‐TAT peptide, and 10 μmol/L of nisoldipine (Nisol) as indicated. Inset above: Mean±SEM of changes in DHE for myocytes before and 30 and 60 minutes after exposure to 10 μmol/L of AID‐TAT peptide as indicated. Statistical significance was determined using the Kruskal‐Wallis test followed by Dunn's multiple comparison test. AID indicates alpha‐interacting domain; DHE, dihydroethidium; TAT, transactivator of transcription.
Effect of AID‐TAT Peptide on Reduction of NAD+ to NADH In Vitro
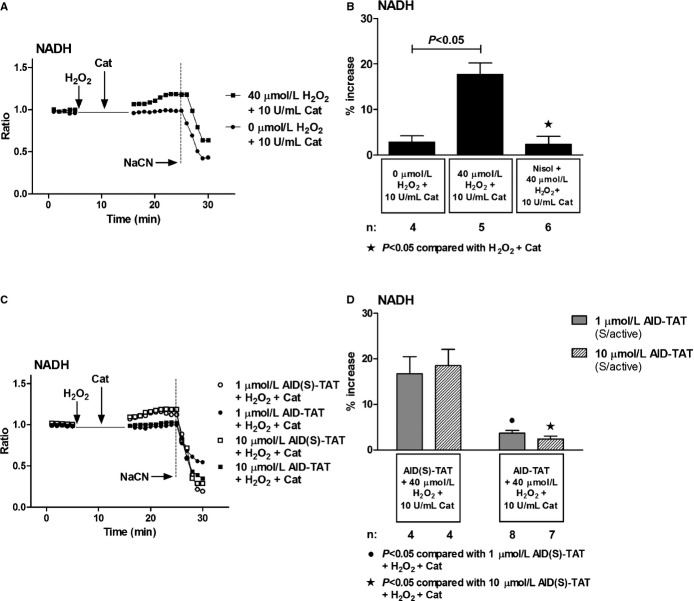
We assessed changes in mitochondrial NADH as autofluorescence in myocytes. Consistent with previous results,19 addition of H2O2 significantly increased NADH signal that could be attenuated with nisoldipine (Figure 5A and 5B). Collapse of the signal with addition of NaCN indicated that the signal was mitochondrial in origin. Application of 1 and 10 μmol/L of AID‐TAT peptide attenuated the increase in NADH associated with application of H2O2 (Figure 5C and 5D). This suggested that AID‐TAT peptide was altering NADH as a result of effects on MMP or oxygen consumption.
Figure 5.
Effect of AID‐TAT peptide on reduction of NAD+ to NADH in vitro. A, Representative traces of NADH autofluorescence recorded in a myocyte before and after 5 minutes of exposure to 40 μmol/L of H2O2 followed by 5 minutes of exposure to 10 U/mL of catalase and a myocyte before and after 5 minutes of exposure to 0 μmol/L of H2O2 followed by 5 minutes of exposure to 10 U/mL of catalase. Vertical arrows indicate when drugs were added. NADH fluorescence decreased after addition of 4 mmol/L of sodium cyanide (NaCN), consistent with depletion of NADH after collapse of Ψm. B, Mean±SEM of changes in NADH autofluorescence for all myocytes exposed to 40 μmol/L of H2O2, 10 U/mL of catalase, and 10 μmol/L of nisoldipine (Nisol) as indicated. C, Representative traces of NADH autofluorescence recorded in myocytes before and after 5 minutes of exposure to 40 μmol/L of H2O2 followed by 5 minutes of exposure to 10 U/mL of catalase in the presence of either 1 or 10 μmol/L of AID(S)‐TAT or AID‐TAT peptide as indicated. Vertical arrows indicate when drugs were added. NADH fluorescence decreased after addition of 4 mmol/L of NaCN, consistent with depletion of NADH after collapse of Ψm. D, Mean±SEM of changes in NADH autofluorescence for all myocytes exposed to 40 μmol/L of H2O2, 10 U/mL of catalase, and 1 or 10 μmol/L of AID(S)‐TAT or AID‐TAT peptide as indicated. Statistical significance was determined using the Kruskal‐Wallis test followed by Dunn's multiple comparison test. AID indicates alpha‐interacting domain; NAD+, nicotinamide adenine dinucleotide; NADH, reduced nicotinamide adenine dinucleotide; TAT, transactivator of transcription.
Effect of AID‐TAT Peptide on Ψm and Flavoprotein Oxidation In Vitro
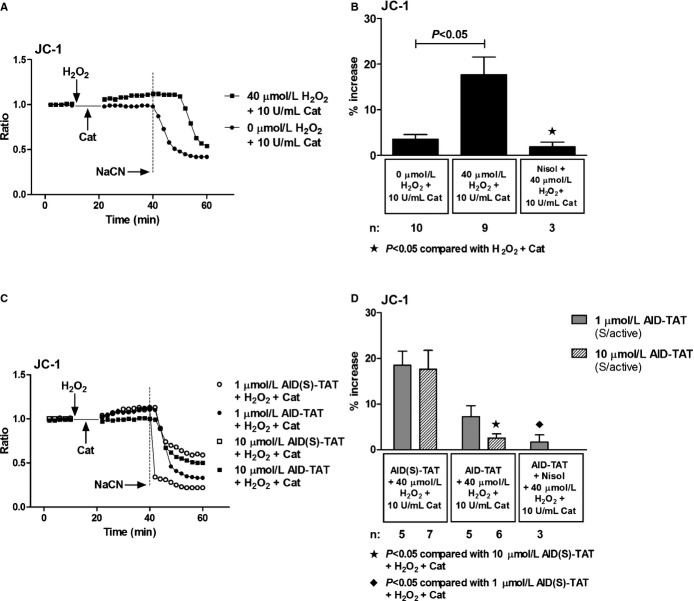
We assessed effects of the peptide on Ψm assessed as changes in JC‐1 fluorescence. Consistent with previous work,10,19,30 application of H2O2 increased JC‐1 signal and the response could be attenuated with nisoldipine (Figure 6A and 6B). Collapse of the signal with application of NaCN demonstrated that the signal was mitochondrial in origin. Application of 10 μmol/L of AID‐TAT peptide significantly decreased the signal induced by H2O2 (Figure 6C and 6D). Addition of H2O2 to myocytes also increased flavoprotein oxidation measured as flavoprotein autofluorescence (Figure 7A and 7B). An increase in flavoprotein autofluorescence is indicative of an increase in flavoprotein oxidation in myocytes. It is also a measure of oxygen consumption in myocytes. The response is dependent on Ψm, and addition of the cyanide derivative, carbonyl cyanide‐4‐(trifluoromethoxy)phenylhydrazone (FCCP), significantly increased flavoprotein signal (Figure 7A through 7C).25 Application of 10 μmol/L of AID‐TAT significantly decreased flavoprotein fluorescence, indicating that the peptide decreased flavoprotein oxidation induced by H2O2 (Figure 7C and 7D). Consistent with this result, we have previously demonstrated that application of 1 μmol/L of AID‐TAT peptide decreased the formation of formazan from tetrozolium salt in guinea pig ventricular myocytes induced by activation of the channel with the dihydropyridine agonist, BayK(–) (Figure 7E).19 This is a measure of oxygen consumption, suggesting that the peptide can decrease metabolic activity in myocytes.
Figure 6.
Effect of AID‐TAT peptide on Ψm in vitro. A, Representative traces of ratiometric JC‐1 fluorescence recorded in a myocyte before and after 5 minutes of exposure to 40 μmol/L of H2O2 followed by 5 minutes of exposure to 10 U/mL of catalase and a myocyte before and after 5 minutes of exposure to 0 μmol/L of H2O2 followed by 5 minutes of exposure to 10 U/mL of catalase. Vertical arrows indicate when drugs were added. Sodium cyanide (NaCN; 4 mmol/L) was added to collapse Ψm as indicated. B, Mean±SEM of changes in ratiometric JC‐1 fluorescence for all myocytes exposed to 40 μmol/L of H2O2, 10 U/mL of catalase, and 10 μmol/L of nisoldipine (Nisol) as indicated. C, Representative traces of ratiometric JC‐1 fluorescence recorded in myocytes before and after 5 minutes of exposure to 40 μmol/L of H2O2 followed by 5 minutes of exposure to 10 U/mL of catalase in the presence of either 1 or 10 μmol/L of AID(S)‐TAT or AID‐TAT peptide as indicated. Vertical arrows indicate when drugs were added. NaCN (4 mmol/L) was added to collapse Ψm as indicated. D, Mean±SEM of changes in ratiometric JC‐1 fluorescence for all myocytes exposed to 40 μmol/L of H2O2, 10 U/mL of catalase, 1 or 10 μmol/L of AID(S)‐TAT or AID‐TAT peptide, and 10 μmol/L of nisoldipine (Nisol) as indicated. Statistical significance was determined using the Kruskal‐Wallis test followed by Dunn's multiple comparison test. AID indicates alpha‐interacting domain; TAT, transactivator of transcription.
Figure 7.
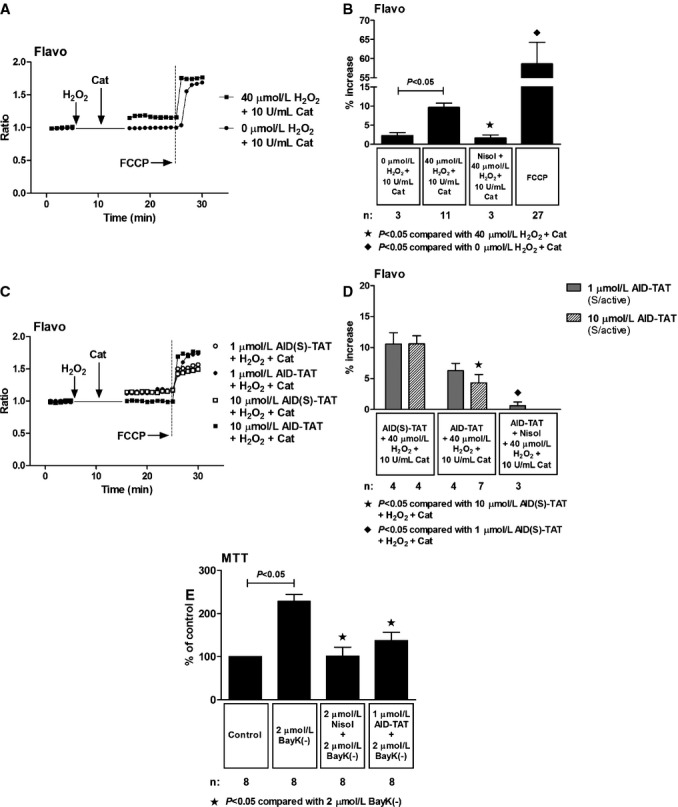
Effect of AID‐TAT peptide on flavoprotein oxidation in vitro. A, Representative traces of flavoprotein autofluorescence recorded in a myocyte before and after 5 minutes of exposure to 40 μmol/L of H2O2 followed by 5 minutes of exposure to 10 U/mL of catalase and a myocyte before and after 5 minutes of exposure to 0 μmol/L of H2O2 followed by 5 minutes of exposure to 10 U/mL of catalase. Vertical arrows indicate when drugs were added. Carbonyl cyanide‐4‐(trifluoromethoxy)phenylhydrazone (FCCP; 10 μmol/L) was added to increase flavoprotein signal, confirming the signal was mitochondrial in origin. B, Mean±SEM of changes flavoprotein autofluorescence for all myocytes exposed to 40 μmol/L of H2O2, 10 U/mL of catalase, 10 μmol/L of nisoldipine (Nisol), and 10 μmol/L of FCCP as indicated. C, Representative traces of flavoprotein autofluorescence recorded in myocytes before and after 5 minutes of exposure to 40 μmol/L of H2O2 followed by 5 minutes of exposure to 10 U/mL of catalase in the presence of either 1 or 10 μmol/L of AID(S)‐TAT or AID‐TAT peptide derived against the AID of the L‐type calcium channel as indicated. Vertical arrows indicate when drugs were added. FCCP (10 μmol/L) was added to increase flavoprotein signal, confirming the signal was mitochondrial in origin. D, Mean±SEM of changes in flavoprotein autofluorescence for all myocytes exposed to 40 μmol/L of H2O2, 10 U/mL of catalase, 1 or 10 μmol/L of AID(S)‐TAT or AID‐TAT peptide, and 10 μmol/L of nisoldipine (Nisol) as indicated. Statistical significance was determined using the Kruskal‐Wallis test followed by Dunn's multiple comparison test. E, Exposure of guinea pig myocytes to BayK(–) causes a significant increase in formation of formazan from tetrozolium salt that can be attenuated by nisoldipine and by AID‐TAT peptide.19 AID indicates alpha‐interacting domain; TAT, transactivator of transcription.
AID‐TAT Peptide Decreases Infarct Size and Supports Contractility In Vivo
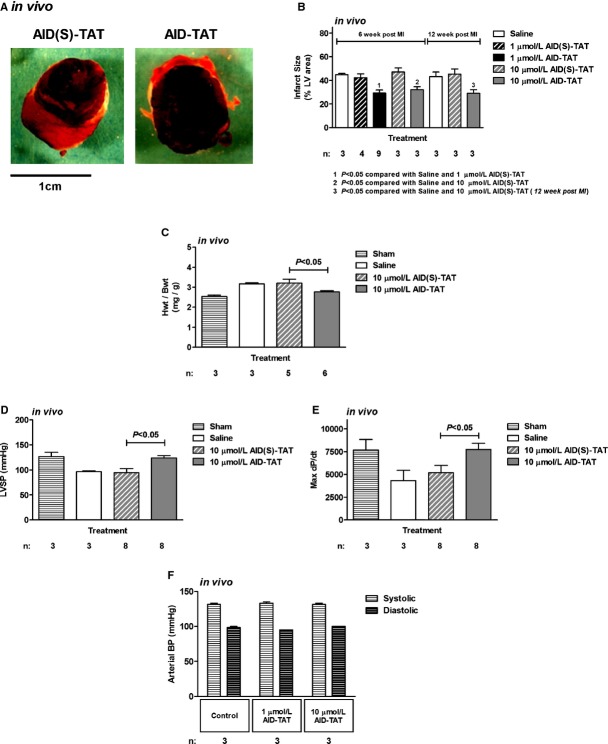
Rats underwent coronary artery ligation, and within 5 minutes after commencement of reperfusion, 1 or 10 μmol/L of AID‐TAT peptide or AID(S)‐TAT peptide was injected into the LV. The chest was closed, and rats were allowed to recover for up to 12 weeks. In a group of rats, saline was injected instead of peptide (“saline”), and in another group of rats, the chest was opened and closed without undergoing cardiac surgery and rats were allowed to recover (“sham”). Before sacrifice, ventricular function (LVPs and ±dP/dT) was assessed after catheterization of the LV. At the time of sacrifice, hearts were excised and weighed and infarct size was assessed. Consistent with our ex vivo data, rats treated with 1 or 10 μmol/L of AID‐TAT peptide had significantly smaller infarcts than rats treated with AID(S)‐TAT peptide (Figure 8A and 8B). This was evident at 6 and 12 weeks after CAL (Figure 8B). At 12 weeks, heart/body weight ratios were larger in rats treated with AID(S)‐TAT, compared to rats treated with AID‐TAT peptide (Figure 8C). More important, left ventricle systolic pressure LVSP (Figure 8D) and max dP/dT (Figure 8E) were significantly improved at 12 weeks post‐CAL in rats treated with 10 μmol/L of AID‐TAT peptide. Because the AID‐TAT peptide also binds the smooth muscle isoform of ICa‐L, we tested whether the peptide acutely altered arterial blood pressure in rats. After dual catheterization of the femoral artery and LV, rats were injected intravenously with 1 μmol/L of AID‐TAT. Both the arterial and LV blood pressures were recorded over 30 minutes. After 30 minutes, 10 μmol/L of AID‐TAT was injected and both pressures were recorded for a further 60 minutes. No change in arterial pressure was observed in the rats (Figure 8F).
Figure 8.
AID‐TAT peptide decreases infarct size and supports contractility in vivo. A, Representative sections from rat hearts treated with 1 μmol/L of scrambled (AID(S)‐TAT) or active (AID‐TAT) peptides. Infarct size is assessed as area that did not take up nitroblue tetrazolium dye. B, Mean±SEM of infarct size in hearts following myocardial infarction expressed as a percentage (%) of total left ventricular (LV) area for all hearts treated with 1 or 10 μmol/L of AID(S)‐TAT or AID‐TAT peptide as indicated. C, Mean±SEM of heart/body weight ratio (Hwt/Bwt) for all hearts treated with 10 μmol/L of AID(S)‐TAT or AID‐TAT peptide as indicated. D, Mean±SEM of left ventricular systolic pressure (LVSP) for all hearts treated with 10 μmol/L of AID(S)‐TAT or AID‐TAT peptide as indicated. E, Mean±SEM of maximum dP/dt for all hearts treated with 10 μmol/L of AID(S)‐TAT or AID‐TAT peptide as indicated. F, Mean±SEM of systolic and diastolic arterial blood pressure (BP) for all animals treated with 1 or 10 μmol/L of AID‐TAT peptide as indicated. n represents number of animals. AID indicates alpha‐interacting domain; TAT, transactivator of transcription.
Discussion
In the heart, L‐type calcium channels are composed of the ion‐conducting and pore‐forming Cav1.2 subunit that associates with auxiliary subunits, including β2, α2δ, and γ subunits. The β2 auxiliary subunit is an effective modulator of channel inactivation and open probability.31–33 The discovery of a sequence motif in the I‐II loop of the Cav1.2 alpha‐interacting domain revealed the contact point for the auxiliary β2 subunit.34 The motif is highly conserved in all α1 subunits. Therefore, a peptide was synthesized that interferes with the binding of the β subunit to the I‐II linker of the α1C subunit with the purpose of studying the biophysical modulation of the currents through the α subunit by the β subunit.20 We and others have demonstrated that application of the AID peptide slows the inactivation rate of the L‐type calcium current and decreases open probability of single‐channel currents.19–20,22 In addition, the β subunits of voltage‐dependent calcium channels are members of the membrane‐associated guanylate kinase family of proteins that are known scaffolding proteins with a type‐3 Sarc homology domain and a guanylate kinase domain.35–36 It is currently recognized that a number of structural proteins directly interact with the β subunit, including members of the Gem/Kir family and the large subsarcolemmal structural protein, AHNAK.37 Therefore, it is reasonable to argue that the β subunit of the channel can modulate calcium‐current activation and inactivation kinetics, in addition to influencing structural proteins that it associates with.
We have found that activation of ICa‐L can modulate mitochondrial function. This occurs as a result of increased calcium influx and influences NADH production, superoxide production, and metabolic activity.19 We also found that activation of the channel caused an increase in MMP. This was mediated through the movement of cytoskeletal proteins because depolymerization of F‐actin filaments or application of AID‐TAT peptide (that immobilises the β subunit and induces functional uncoupling from F‐actin) attenuated the response.19 Because I/R injury is associated with an increase in metabolic activity and OS, we hypothesized, in this study, that application of AID‐TAT peptide can alter I/R injury by an effect on mitochondrial function. We demonstrate that application of 1 μmol/L of AID‐TAT can decrease infarct size in guinea pig hearts exposed to I/R ex vivo and in rats that had undergone CAL in vivo (Figures 1 and 8). Application of AID‐TAT peptide decreased mitochondrial NADH production (Figure 5), MMP (Figure 6), flavoprotein oxidation, and metabolic activity (Figure 7) induced by application of H2O2. This occurred in a concentration‐dependent manner because 10 μmol/L of AID‐TAT induced larger responses. Application of AID‐TAT peptide also attenuated the increase in Fura‐2 signal (Figure 3) and superoxide production (Figure 4) induced by H2O2. Upon binding of the peptide, the β‐AID complex dissociates from the α subunit, resulting in rapid removal.20 Because the turnover rate of the channel complex in vivo is ≈96 hours,38 we can presume that the duration of the loss of β subunits after a single injection of the peptide will be ≈3 to 4 days after infarction.
We demonstrate that heart/body weight ratio does not increase and contractility is supported for up to 12 weeks in rats injected with 10 μmol/L of AID‐TAT that had undergone CAL in vivo. Contractility appears to normalize early after administration of the peptide, as evidenced by an improvement in developed pressure within 30 minutes after ischemia in hearts that had undergone I/R injury ex vivo (Figure 2). We propose that the improvement in contractile function occurs as a result of a decrease in OS and metabolic activity in the hearts. Alterations in [Ca2+]i after application of AID‐TAT were not deleterious because intravenous injection of the peptide did not alter arterial pressure during continuous recordings in rats in vivo (Figure 8F) or in hearts perfused with the peptide ex vivo in the absence of I/R (Figure 2E).
The sequence motif in the I‐II loop of the Cav1.2 is highly conserved across species. In this study, we have demonstrated a beneficial effect of the peptide in guinea pig heart, mouse myocytes, and rats. The reduction in infarct size and improvement in contractility after administration of the peptide could provide significant benefits post‐MI in the human heart.
Sources of Funding
The research work presented in this article was supported by the National Health and Medical Research Council of Australia (NHMRC), Australian Research Council (ARC), and Heart Foundation of Australia. Hool is an ARC Future Fellow and Honorary NHMRC Senior Research Fellow and Viola is a Heart Foundation Postdoctoral Fellow.
Disclosures
None.
References
- 1.Hausenloy DJ, Erik Botker H, Condorelli G, Ferdinandy P, Garcia‐Dorado D, Heusch G, Lecour S, van Laake LW, Madonna R, Ruiz‐Meana M, Schulz R, Sluijter JP, Yellon DM, Ovize M. Translating cardioprotection for patient benefit: position paper from the Working Group of Cellular Biology of the Heart of the European Society of Cardiology. Cardiovasc Res. 2013; 98:7-27. [DOI] [PubMed] [Google Scholar]
- 2.Sabri A, Hughie HH, Lucchesi PA. Regulation of hypertrophic and apoptotic signaling pathways by reactive oxygen species in cardiac myocytes. Antioxid Redox Signal. 2003; 5:731-740. [DOI] [PubMed] [Google Scholar]
- 3.Berridge MJ. Remodelling Ca2+ signalling systems and cardiac hypertrophy. Biochem Soc Trans. 2006; 34Pt 2:228-231. [DOI] [PubMed] [Google Scholar]
- 4.Tang H, Viola HM, Filipovska A, Hool LC. Ca(v)1.2 calcium channel is glutathionylated during oxidative stress in guinea pig and ischemic human heart. Free Radic Biol Med. 2011; 51:1501-1511. [DOI] [PubMed] [Google Scholar]
- 5.Hool LC, Arthur PG. Decreasing cellular hydrogen peroxide with catalase mimics the effects of hypoxia on the sensitivity of the L‐type Ca2+ channel to beta‐adrenergic receptor stimulation in cardiac myocytes. Circ Res. 2002; 91:601-609. [DOI] [PubMed] [Google Scholar]
- 6.Akaishi T, Nakazawa K, Sato K, Saito H, Ohno Y, Ito Y. Hydrogen peroxide modulates whole cell Ca2+ currents through L‐type channels in cultured rat dentate granule cells. Neurosci Lett. 2004; 356:25-28. [DOI] [PubMed] [Google Scholar]
- 7.Campbell DL, Stamler JS, Strauss HC. Redox modulation of L‐type calcium channels in ferret ventricular myocytes. Dual mechanism regulation by nitric oxide and S‐nitrosothiols. J Gen Physiol. 1996; 108:277-293. [DOI] [PMC free article] [PubMed] [Google Scholar]
- 8.Hool LC. Hypoxia increases the sensitivity of the L‐type Ca(2+) current to beta‐adrenergic receptor stimulation via a C2 region‐containing protein kinase C isoform. Circ Res. 2000; 87:1164-1171. [DOI] [PubMed] [Google Scholar]
- 9.Hool LC. Hypoxia alters the sensitivity of the L‐type Ca(2+) channel to alpha‐adrenergic receptor stimulation in the presence of beta‐adrenergic receptor stimulation. Circ Res. 2001; 88:1036-1043. [DOI] [PubMed] [Google Scholar]
- 10.Viola HM, Arthur PG, Hool LC. Transient exposure to hydrogen peroxide causes an increase in mitochondria‐derived superoxide as a result of sustained alteration in L‐type Ca2+ channel function in the absence of apoptosis in ventricular myocytes. Circ Res. 2007; 100:1036-1044. [DOI] [PubMed] [Google Scholar]
- 11.Kwon SH, Pimentel DR, Remondino A, Sawyer DB, Colucci WS. H(2)O(2) regulates cardiac myocyte phenotype via concentration‐dependent activation of distinct kinase pathways. J Mol Cell Cardiol. 2003; 35:615-621. [DOI] [PubMed] [Google Scholar]
- 12.Seenarain V, Viola HM, Ravenscroft G, Casey TM, Lipscombe RJ, Ingley E, Laing NG, Bringans SD, Hool LC. Evidence of altered guinea pig ventricular cardiomyocyte protein expression and growth in response to a 5 min in vitro exposure to H(2)O(2). J Proteome Res. 2010; 9:1985-1994. [DOI] [PubMed] [Google Scholar]
- 13.Song LS, Guia A, Muth JN, Rubio M, Wang SQ, Xiao RP, Josephson IR, Lakatta EG, Schwartz A, Cheng H. Ca(2+) signaling in cardiac myocytes overexpressing the alpha(1) subunit of L‐type Ca(2+) channel. Circ Res. 2002; 90:174-181. [DOI] [PubMed] [Google Scholar]
- 14.Wei SK, Colecraft HM, DeMaria CD, Peterson BZ, Zhang R, Kohout TA, Rogers TB, Yue DT. Ca(2+) channel modulation by recombinant auxiliary beta subunits expressed in young adult heart cells. Circ Res. 2000; 86:175-184. [DOI] [PubMed] [Google Scholar]
- 15.Hullin R, Matthes J, von Vietinghoff S, Bodi I, Rubio M, D'Souza K, Friedrich Khan I, Rottlander D, Hoppe UC, Mohacsi P, Schmitteckert E, Gilsbach R, Bunemann M, Hein L, Schwartz A, Herzig S. Increased expression of the auxiliary beta(2)‐subunit of ventricular L‐type Ca(2)+ channels leads to single‐channel activity characteristic of heart failure. PLoS ONE. 2007; 2:e292. [DOI] [PMC free article] [PubMed] [Google Scholar]
- 16.Dolphin AC. Beta subunits of voltage‐gated calcium channels. J Bioenerg Biomembr. 2003; 35:599-620. [DOI] [PubMed] [Google Scholar]
- 17.Hohaus A, Person V, Behlke J, Schaper J, Morano I, Haase H. The carboxyl‐terminal region of ahnak provides a link between cardiac L‐type Ca2+ channels and the actin‐based cytoskeleton. Faseb J. 2002; 16:1205-1216. [DOI] [PubMed] [Google Scholar]
- 18.Sadeghi A, Doyle AD, Johnson BD. Regulation of the cardiac L‐type Ca2+ channel by the actin‐binding proteins alpha‐actinin and dystrophin. Am J Physiol Cell Physiol. 2002; 282:C1502-C1511. [DOI] [PubMed] [Google Scholar]
- 19.Viola HM, Arthur PG, Hool LC. Evidence for regulation of mitochondrial function by the L‐type Ca2+ channel in ventricular myocytes. J Mol Cell Cardiol. 2009; 46:1016-1026. [DOI] [PubMed] [Google Scholar]
- 20.Hohaus A, Poteser M, Romanin C, Klugbauer N, Hofmann F, Morano I, Haase H, Groschner K. Modulation of the smooth‐muscle L‐type Ca2+ channel alpha1 subunit (alpha1C‐b) by the beta2a subunit: a peptide which inhibits binding of beta to the I‐II linker of alpha1 induces functional uncoupling. Biochem J. 2000; 348Pt 3:657-665. [PMC free article] [PubMed] [Google Scholar]
- 21.O'Connell TD, Rodrigo MC, Simpson PC. Isolation and culture of adult mouse cardiac myocytes. Methods Mol Biol. 2007; 357:271-296. [DOI] [PubMed] [Google Scholar]
- 22.Viola HM, Davies SM, Filipovska A, Hool LC. The L‐type Ca2+ channel contributes to alterations in mitochondrial calcium handling in the mdx ventricular myocyte. Am J Physiol Heart Circ Physiol. 2013; 304:H767-H775. [DOI] [PubMed] [Google Scholar]
- 23.Anderson CD, Heydarkhan‐Hagvall S, Schenke‐Layland K, Yang JQ, Jordan MC, Kim JK, Brown DA, Zuk PA, Laks H, Roos KP, Maclellan WR, Beygui RE. The role of cytoprotective cytokines in cardiac ischemia/reperfusion injury. J Surg Res. 2008; 148:164-171. [DOI] [PubMed] [Google Scholar]
- 24.Schenke‐Layland K, Strem BM, Jordan MC, Deemedio MT, Hedrick MH, Roos KP, Fraser JK, Maclellan WR. Adipose tissue‐derived cells improve cardiac function following myocardial infarction. J Surg Res. 2009; 153:217-223. [DOI] [PMC free article] [PubMed] [Google Scholar]
- 25.Yaniv Y, Juhaszova M, Lyashkov AE, Spurgeon HA, Sollott SJ, Lakatta EG. Ca2+‐regulated‐cAMP/PKA signaling in cardiac pacemaker cells links ATP supply to demand. J Mol Cell Cardiol. 2011; 51:740-748. [DOI] [PMC free article] [PubMed] [Google Scholar]
- 26.Rahman I, Kode A, Biswas SK. Assay for quantitative determination of glutathione and glutathione disulfide levels using enzymatic recycling method. Nat Protoc. 2006; 1:3159-3165. [DOI] [PubMed] [Google Scholar]
- 27.Zorov DB, Filburn CR, Klotz LO, Zweier JL, Sollott SJ. Reactive oxygen species (ROS)‐induced ROS release: a new phenomenon accompanying induction of the mitochondrial permeability transition in cardiac myocytes. J Exp Med. 2000; 192:1001-1014. [DOI] [PMC free article] [PubMed] [Google Scholar]
- 28.Akar FG, Aon MA, Tomaselli GF, O'Rourke B. The mitochondrial origin of postischemic arrhythmias. J Clin Invest. 2005; 115:3527-3535. [DOI] [PMC free article] [PubMed] [Google Scholar]
- 29.Aon MA, Cortassa S, Marban E, O'Rourke B. Synchronized whole cell oscillations in mitochondrial metabolism triggered by a local release of reactive oxygen species in cardiac myocytes. J Biol Chem. 2003; 278:44735-44744. [DOI] [PubMed] [Google Scholar]
- 30.Viola HM, Hool LC. Qo site of mitochondrial complex III is the source of increased superoxide after transient exposure to hydrogen peroxide. J Mol Cell Cardiol. 2010; 49:875-885. [DOI] [PubMed] [Google Scholar]
- 31.Lacerda AE, Kim HS, Ruth P, Perez‐Reyes E, Flockerzi V, Hofmann F, Birnbaumer L, Brown AM. Normalization of current kinetics by interaction between the alpha 1 and beta subunits of the skeletal muscle dihydropyridine‐sensitive Ca2+ channel. Nature. 1991; 352:527-530. [DOI] [PubMed] [Google Scholar]
- 32.Singer D, Biel M, Lotan I, Flockerzi V, Hofmann F, Dascal N. The roles of the subunits in the function of the calcium channel. Science. 1991; 253:1553-1557. [DOI] [PubMed] [Google Scholar]
- 33.Mori Y, Friedrich T, Kim MS, Mikami A, Nakai J, Ruth P, Bosse E, Hofmann F, Flockerzi V, Furuichi T, Mikoshiba K, Imoto K, Tanabe T, Numa S. Primary structure and functional expression from complementary DNA of a brain calcium channel. Nature. 1991; 350:398-402. [DOI] [PubMed] [Google Scholar]
- 34.Pragnell M, De Waard M, Mori Y, Tanabe T, Snutch TP, Campbell KP. Calcium channel beta‐subunit binds to a conserved motif in the I‐II cytoplasmic linker of the alpha 1‐subunit. Nature. 1994; 368:67-70. [DOI] [PubMed] [Google Scholar]
- 35.Van Petegem F, Clark KA, Chatelain FC, Minor DL., Jr Structure of a complex between a voltage‐gated calcium channel beta‐subunit and an alpha‐subunit domain. Nature. 2004; 429:671-675. [DOI] [PMC free article] [PubMed] [Google Scholar]
- 36.Chen YH, Li MH, Zhang Y, He LL, Yamada Y, Fitzmaurice A, Shen Y, Zhang H, Tong L, Yang J. Structural basis of the alpha1‐beta subunit interaction of voltage‐gated Ca2+ channels. Nature. 2004; 429:675-680. [DOI] [PubMed] [Google Scholar]
- 37.Haase H. Ahnak, a new player in beta‐adrenergic regulation of the cardiac L‐type Ca2+ channel. Cardiovasc Res. 2007; 73:19-25. [DOI] [PubMed] [Google Scholar]
- 38.Catalucci D, Zhang DH, DeSantiago J, Aimond F, Barbara G, Chemin J, Bonci D, Picht E, Rusconi F, Dalton ND, Peterson KL, Richard S, Bers DM, Brown JH, Condorelli G. Akt regulates L‐type Ca2+ channel activity by modulating Cavalpha1 protein stability. J Cell Biol. 2009; 184:923-933. [DOI] [PMC free article] [PubMed] [Google Scholar]


