

Abstract
Background
Cell‐based therapies involving mononuclear cells (MNCs) have been developed for vascular regeneration to treat ischemic diseases; however, quality control of therapeutic MNCs has not been evaluated. We investigated the therapeutic potential of peripheral blood (PB) MNCs, operated by recently developed quality and quantity (QQ) culture of endothelial progenitor cells (EPCs).
Methods and Results
PBs were collected from healthy volunteers; peripheral blood mononuclear cells (PBMNCs) isolated from these PBs were subjected to QQ culture for 7 days with medium containing stem cell factor, thrombopoietin, Flt‐3 ligand, vascular endothelial growth factor, and interleukin‐6. The resulting cells (QQMNCs) in EPC colony‐forming assay generated significantly more definitive EPC colonies than PBMNCs. In flow cytometry, macrophages and helper T lymphocytes of QQMNCs became phenotypically polarized into angiogenic, anti‐inflammatory, and regenerative subsets: classical M1 to alternative M2; T helper (Th)1 to Th2; angiogenic or regulatory T‐cell expansion. Quantitative real‐time polymerase chain reaction (qRT‐PCR) assay revealed the predominant proangiogenic gene expressions in QQMNCs versus PBMNCs. Using murine ischemic hindlimb models, the efficacy of QQMNC intramuscular transplantation (Tx) was compared to that of PBMNCTx, cultured “early EPC” Tx (eEPCTx), and granulocyte colony‐stimulating factor mobilized CD34+ cell Tx (GmCD34Tx). Laser Doppler imaging revealed the blood perfusion recovery in ischemic hindlimbs after QQMNCTx superior to after PBMNCTx and eEPCTx, but also earlier than after GmCD34Tx. Histological evaluations and qRT‐PCR assays in ischemic hindlimbs demonstrated that QQMNCTx, similarly to GmCD34Tx, enhanced angiovasculogenesis and myogenesis, whereas it preponderantly inhibited inflammation and fibrosis versus PBMNCTx and eEPCTx.
Conclusions
QQ culture potentiates the ability of PBMNCs to promote regeneration of injured tissue; considering the feasible cell preparation, QQ culture‐treated PBMNCs may provide a promising therapeutic option for ischemic diseases.
Clinical Trial Registration
URL: irb.med.u-tokai.ac.jp/d/2/monthly/2010.html; IRB No.: 10R‐020.
URL: irb.med.u-tokai.ac.jp/d/2/monthly/201312.html; IRB No.: 13R228.
Keywords: anti‐inflammation, cell‐based therapy, peripheral blood mononuclear cells, serum‐free culture, vascular regeneration
Introduction
Based on the isolation of bone marrow (BM)‐derived endothelial progenitor cells (EPCs),1–3 autologous total mononuclear cells (MNCs) freshly isolated from BM or peripheral blood (PB) have been applied to clinical vascular regenerative therapy in patients with severe ischemic heart or limb diseases.
These initial clinical experiences indicate that cell‐based therapy for vascular regenerations is safe, feasible, and effective.4–7 However, the translational and clinical trials have also demonstrated insufficient or contradictory effectiveness on recovery from ischemic diseases.8–11
Peripheral blood and bone marrow MNCs (PBMNCs and BMMNCs) constitute hematopoietic lineage cells; most are lymphoid cells or myeloid monocytes, and very few are stem/progenitor cell types, such as hematopoietic stem/progenitor cells, EPCs, or other mesenchymal stem cells. The scarcity of EPCs in MNC populations is a main reason for failure of constant and potent contributions in clinical cases.
Enriched EPCs, such as CD34+ or CD133+ cells, constitute <0.01% of PBMNCs and 0.1% of BMMNCs, and the frequency of colony‐forming EPCs is 0.005% in PBMNCs.12
Taking into account the majority in MNCs, we need to issue the critical functions of monocyte/macrophages. Monocytes are precursors of macrophages; monocytes play key roles in both proinflammatory and regenerative processes by phenotype alterations after tissue infiltrations.13 Macrophages are a heterogeneous cell population that adapts and responds to a large variety of microenvironmental signals. For example, the cytokines and growth factors in some microenvironments induce macrophages to adopt regenerative phenotypes, whereas the inflammatory deterioration and fibrosis in uncontrolled inflammatory environment in tissues induce proinflammatory macrophage transitions and suppress regenerative processes.
Also, the inflammatory environment is interacted by major lymphoid phenotypes simultaneously stimulated by proinflammatory signals and controlled macrophage phenotype transition for proinflammatory drive.13–14
To suppress unproductive inflammatory process and enhance vasculogenic regeneration, purified EPCs have been transplanted into patients with severe ischemic heart or limb diseases, and these initial clinical experiences indicate that this cell‐based therapy is safe and effective.15–19 Nevertheless, the problems caused by EPC scarcity must be overcome for EPC‐mediated therapy to become reproducible and effective. To this end, the following 3 step‐wise strategies have been used: (1) leukapheresis; (2) daily administration of granulocyte colony‐stimulating factor (G‐CSF); and (3) isolation of machinery CD34+ or CD133+ cells. Such an isolation process of autologous EPC sources burdens the patients to be treated with “EPC therapy,” in terms of medical invasiveness and costs.
More important, the number and functionality of EPCs decline as patients age20 and in patients with cardiovascular (CV) risk factors.21–22
Here, we describe a method for MNC culture that enhances the vasculogenic potential of EPCs and facilitates the preparation of monocytes for regenerative phenotype activation.
Our method for quality and quantity‐control culture (QQ culture) of MNCs (QQMNCs) is based on an established culture method that increases the quality and quantity of EPCs derived from enriched EPC populations, such as CD34+ and CD133+ cells. Notably, the therapeutic potential of QQ culture is demonstrably greater than that of naïve EPCs for CV regeneration after infarcted myocardia in rats.23 Interestingly, we found that the vasculogenic signaling condition of MNCs in QQ culture potentiates the vascular and tissue regeneration ability of naïve PBMNCs. The regenerative function of QQMNCs turned out to be operated through activation of anti‐inflammatory and angiogenic monocytes/helper T lymphocytes as well as vasculogenic EPC expansion.
Moreover, the present experimental study demonstrated that therapeutic efficacy of QQMNC transplantation (QQMNCTx) is equal to and greater than that of G‐CSF mobilized CD34+ cell Tx (GmCD34Tx).
Therefore, in cell‐based therapy for ischemic diseases, QQMNC provides a practical option of cell sources, including PBMNC and GmCD34.
Methods
Collection of PBMNCs Cells or CD34+ Cells From Healthy Volunteers
Experiments using human samples were performed with institutional approval and guidelines from the Clinical Investigation Committee at Tokai University School of Medicine (institutional review board [IRB] No.: 10R‐020; irb.med.u-tokai.ac.jp/d/2/monthly/2010.html and IRB No.: 13R228; irb.med.u-tokai.ac.jp/d/2/monthly/201312.html). The whole healthy human volunteers between the ages of 20 and 55 years gave informed consent.
PB (20 to 100 mL per subject) was drawn by heparinized venous puncture at the forearm. PBMNCs were isolated by density gradient centrifugation using Lymphocyte Separation Solution (d=1.077; Nakalai Tesque, Kyoto, Japan), as previously reported.24 CD34+ cells were purified by an autoMACS separator (Miltenyi Biotec, Lund, Sweden), using magnetic beads‐coated mouse anti human CD34 antibody (Ab) and a CD34 Cell isolation kit (Miltenyi Biotec), according to the manufacturer's instructions.
QQ Culture and Early EPC Culture of PBMNCs
QQ culture condition for PBMNCs
QQ culture medium of Stem Line II (Sigma‐Aldrich, St. Louis, MO) contained the 5 human recombinant proteins: stem cell factor (SCF); thrombopoietin (TPO); Flt‐3 ligand; vascular endothelial growth factor (VEGF); and interleukin (IL)‐6. Then, isolated PBMNCs were cultured for 7 days at the cell density of 2×10⁶ cells/2 mL QQ culture medium per well of 6‐well Primaria tissue culture plate (BD Falcon; BD Biosiences, San Jose, CA). Cell density in QQ culture was corresponded to the approximate density of 1×10⁶ MNCs in 1 mL of PB. Culture well plates and the contents of QQ culture medium are listed in Tables 1 and 2.
Table 1.
Materials for QQ Culture and EPC‐CFA
| Company, Catalaog No. | Application | |
|---|---|---|
| 6‐well Primaria tissue culture plate | BD Biosciences, #353846 | QQ culture |
| 35‐mm Primaria tissue culture dish | BD Biosciences, #353801 | EPC‐CFA |
| Blunt‐end needle | STEMCELL Technologies, #28110 | Applying semisolid medium |
| Gridded scoring dish | STEMCELL Technologies, #27500 | Guide when counting EPC‐CFU |
EPC‐CFA indicates endothelial progenitor cell colony‐forming assay; EPC‐CFU, endothelial progenitor cell colony‐forming units; QQ, quality and qunatity.
Table 2.
Contents of QQ Culture Medium
| Company, Catalog No. | Final Concentration | |
|---|---|---|
| Stemline II™ Hematopoietic Stem Cell Expansion Medium | Sigma‐Aldrich, #S0192 | |
| rh SCF | Peprotec, #300‐07 | 100 ng/mL |
| rh Flt‐3 ligand | Peprotec, #300‐19 | 100 ng/mL |
| rh TPO | Peprotec, #300‐18 | 20 ng/mL |
| rh VEGF | Peprotec, #100‐20 | 50 ng/mL |
| rh IL‐6 | Peprotec, #200‐06 | 20 ng/mL |
IL indicates interleukin; rh, recombinant human; SCF, stem cell factor; TPO, thrombopoietin; VEGF, vascular endothelial growth factor.
Early EPC culture of PBMNCs
As previously reported,24–25 early EPCs (eEPCs) were acquired after 7 days of culture of isolated PBMNCs using the EGM‐2‐MV SingleQuots kit (Lonza Walkersville, Inc., Walkersville, MD). In brief, EGM‐2‐MV complete medium was adjusted by adding 5% FBS (SAFC Biosciences Inc., Lenexa, KS) and supplemented growth factors, except hydrocortisone, to EBM‐2 basal medium. PBMNCs were adjusted to the similar cell density (1×10⁶ cells/mL) with 5% FBS/EGM‐2‐MV complete medium to that in QQ culture of PBMNCs. Cells were then plated on a human fibronectin‐coated 6‐well Primaria tissue culture plate (2×10⁶ cells/2 mL per well) and cultured. The medium was changed 4 days after seeding, then cultured for 3 more days. Seven days later, nonattaching cells were removed; adherent cells were harvested with 2 mmol/L of EDTA/PBS after washing with PBS. Harvested eEPCs were suspended in Iscove's Modified Dulbecco's Medium (IMDM) (Sigma Aldrich), adjusted the cell density (1×10⁴ cells/40 μL or 2×10⁵ cells/40 μL), cells were then transplanted into skeletal muscle of murine ischemic hindlimb, as described below.
EPC Colony‐Forming Assay
To investigate the vasculogenic potential of PBMNCs or QQMNCs, we used semisolid culture medium and 35‐mm Primaria dishes (BD Falcon; BD Biosciences) to grow and then counted the adhesive EPC colonies by EPC colony‐forming assay (EPC‐CFA) (MethoCult SFBIT; STEMCELL Technologies Inc., Vancouver, BC, Canada) with proangiogenic growth factors/cytokines, as previously reported (Table 3).12 Aliquots of those cells were seeded at 2×10⁵ cells/dish (3 dishes per volunteer) for EPC‐CFA. Sixteen to 18 days after initiation of the culture, the number of adherent colonies per dish was measured using a gridded scoring dish (STEMCELL Technologies) under phase‐contrast light microscopy (Eclipse TE300; Nikon, Tokyo, Japan). Primitive EPC colony‐forming units (pEPC‐CFUs) and definitive EPC‐CFUs (dEPC‐CFUs) were separately counted.
Table 3.
Contents in Semisolid Culture for EPC‐CFA
| Company, Catalog No. | Final Concentration | |
|---|---|---|
| MethoCult™ SFBIT H4236 | STEMCELL Technologies, #04236 | |
| rh SCF | Peprotec, #300‐07 | 66.7 ng/mL |
| rh VEGF | Peprotec, #100‐20 | 33.3 ng/mL |
| rh basic FGF | Peprotec, #100‐18B | 33.3 ng/mL |
| rh EGF | Peprotec, #100‐15 | 33.3 ng/mL |
| rh IGF‐1 | Peprotec, #100‐11 | 33.3 ng/mL |
| rh IL‐3 | Peprotec, #200‐03 | 13.3 ng/mL |
| Heparin | Shimizu Pharmaceutical Co | 1.33 IU/mL |
| FBS | SAFC Biosciences, #12303 | 30% (vol/vol) |
EGF indicates epidermal growth factor; FGF, fibroblast growth factor; IGF, insulin‐like growth factor; IL, interleukin; rh, recombinant human; VEGF, vascular endothelial growth factor.
Flow Cytometry
Performance of flow cytometry for lineage cell populations
Freshly isolated PBMNCs and the QQMNCs were subjected to flow cytometry (FCM) to detect surface antigen positivities of hematopoietic stem or lineage committed cells as well as endothelial lineage cells. The Abs were listed in Tables 4,4 through 6. Cells suspended in 2 mmol/L of EDTA/0.2% BSA/PBS buffer (5×10⁵ cells/200 μL) were incubated after the addition of 10 μL of FcR blocking reagent at 4°C for 30 minutes and then equally dispensed into reaction tubes for subsequent staining (100 μL/tube). Each aliquot was incubated with 2 μL of each first Ab at 4°C for 20 minutes and then washed twice with 1 mL of 2 mmol/L of EDTA/0.2% BSA/PBS buffer. Cells were suspended in 2 mmol/L of EDTA/0.2% BSA/PBS buffer (2×10⁵ cells/200 μL). FCM analysis was performed using the LSRFortessa cell analyzer (BD Biosciences) and FlowJo software (Tomy Digital Biology Co., Ltd., Tokyo, Japan). When staining for von Willebrand factor (vWF), after incubation with each first Ab, cells were incubated with biotin conjugated rat anti‐mouse immunoglobulin G (IgG)1 and then conjugated to streptavidin/phycoerythrin/cyanine 7 (PE/Cy7).
Table 4.
Antibodies Recognizing Hematopoietic Cell Populations for Flow Cytometry
| Antibody | Clone | Isotype | Company, Catalog No. |
|---|---|---|---|
| CD34‐FITC | 581 | Mouse IgG1 κ | BD Pharmingen, #555821 |
| CD133‐APC | AC133 | Mouse IgG1 | Miltenyi Biotec, #130‐090‐826 |
| VEGFR‐2‐PE | 89106 | Mouse IgG1 | R&D Systems, #FAB357P |
| CD31‐FITC | WM59 | Mouse IgG1 κ | BD Pharmingen, #555445 |
| vWF | 4F9 | Mouse IgG1 κ | Abcam, #ab20435 |
| CD105‐APC | SN6 | Mouse IgG1 κ | eBioscience, #17‐1057‐42 |
| CD146‐PE | P1H12 | Mouse IgG1 κ | BD Pharmingen, #550315 |
| CD3‐Alexa700 | HIT3a | Mouse IgG2a κ | BioLegend, #300324 |
| CD4‐APC/Cy7 | RPA‐T4 | Mouse IgG1 κ | BioLegend, #300518 |
| CD8‐Pacific Blue | SK1 | Mouse IgG1 κ | BioLegend, #344718 |
| CD11c‐PE | S‐HCL‐3 | Mouse IgG2b κ | BD Biosciences, #347637 |
| CD14‐Pacific Blue | M5E2 | Mouse IgG2a κ | BioLegend, #301828 |
| CD16‐APC/Cy7 | 3G8 | Mouse IgG1 κ | BioLegend, #302018 |
| CD19‐PE/Cy7 | HIB19 | Mouse IgG1 κ | BioLegend, #302215 |
| CD56‐APC | HCD56 | Mouse IgG1 κ | BioLegend, #318309 |
| CD192(CCR2)‐PerCP/Cy5.5 | TG5/CCR2 | Mouse IgG2b κ | BioLegend, #335303 |
| CD206‐APC/Cy7 | 15‐2 | Mouse IgG1 κ | BioLegend, #321119 |
| CD235a‐FITC | GA‐R2(HIR2) | Mouse IgG2b κ | BD Pharmingen, #559943 |
| CD184(CXCR4)‐PE/Cy7 | 12G5 | Mouse IgG2a κ | BioLegend, #306514 |
APO indicates allophycocyanin; CCR2, CC chemokine receptor 2; CXCR4, C‐X‐C chemokine receptor type 4; PE, phycoerythrin; VEGFR, vascular endothelial growth factor receptor; vWF, von Willebrand factor.
Table 6.
Isotype Antibodies and Reagents for Flow Cytometry
| Antibody | Clone | Company, Catalog No. |
|---|---|---|
| Mouse IgG1 κ‐FITC | MOPC‐21 | BD Pharmingen, #555748 |
| Mouse IgG1 κ‐APC | 679.1Mc7 | Beckman Coulter, #IM2475 |
| Mouse IgG1 κ‐PE | MOPC‐21 | BD Pharmingen, #555749 |
| Mouse IgG1 κ | MOPC‐21 | BD Pharmingen, #555746 |
| Mouse IgG1 κ‐Pacific Blue | MOPC‐21 | BioLegend, #400131 |
| Mouse IgG1 κ‐PE/Cy7 | MOPC‐21 | BioLegend, #400125 |
| Mouse IgG1 κ‐APC/Cy7 | MOPC‐21 | BioLegend, #400127 |
| Mouse IgG2a κ‐Pacific Blue | MOPC‐173 | BioLegend, #400235 |
| Mouse IgG2a κ‐Alexa700 | MOPC‐173 | BioLegend, #400247 |
| Mouse IgG2b κ‐FITC | 27‐35 | BD Pharmingen, #555742 |
| Mouse IgG2b κ‐PE | 27‐35 | BD Pharmingen, #555743 |
| Mouse IgG2 κ‐PerCP/Cy5.5 | MPC‐11 | BioLegend, #400337 |
| Mouse IgG2a κ‐PE/Cy7 | MOP‐173 | BioLegend, #400232 |
| Biotin‐rat anti‐mouse IgG1 | A85‐1 | BD Pharmingen, #553441 |
| Streptavidin‐PE/Cy7 | BioLegend, #405206 | |
| Fc blocking reagent, human | Miltenyi Biotec, #130‐059‐901 |
Table 5.
Antibodies Recognizing Helper T‐Cell Subsets for Flow Cytometry
| Antibody | Clone | Isotype | Company, Cat No. |
|---|---|---|---|
| CD4‐PerCP/Cy5.5 | OKT4 | Mouse IgG2b κ | BioLegend, #317428 |
| CD25‐PE | BC96 | Mouse IgG1 κ | BioLegend, #302606 |
| INF‐γ‐Pacific Blue | 4S.B3 | Mouse IgG1 κ | BioLegend, #502522 |
| IL‐4‐APC | 8D4‐8 | Mouse IgG1 κ | BioLegend, #500713 |
| Foxp3‐FITC | 206D | Mouse IgG1 κ | BioLegend, #320105 |
Foxp3 indicates forkhead box P3; IL, interleukin; INF, interferon.
Performance of FCM for activated helper T‐lymphocyte subsets
PBMNCs or QQMNCs in 10% FBS/RPMI 1640 medium (1×10⁶ cells/mL) were treated with 25 ng/mL of phorbol‐12‐myristate‐13‐acetate (PMA; Promega, Madison, WI) and 1 μg/mL of ionomycin (Wako Pure Chemical Industries, Ltd., Osaka, Japan) for 12 hours at 37°C. Subsequently, for the last 3 hours, cells were incubated with 2 μmol/L of monensin (BioLegend, San Diego, CA). Thereafter, cells were washed and suspended with 2 mmol/L of EDTA/PBS buffer and stained for cell surface markers with CD4‐PerCP/Cy5.5 and CD25‐PE before fixation. Stained cells were washed, resuspended with 2 mmol/L of EDTA/PBS buffer, and distributed into aliquots for each staining. After treatment with fixation buffer (BioLegend) and permeabilization buffer (BioLegend), cells underwent intracellular staining with interferon‐gamma (INF‐γ)‐Pacific Blue and IL‐4/allophycocyanin (APC). Alternatively, after treatment with the FOXP3 Fix/Perm Buffer Set (BioLegend), cells underwent intranuclear staining with forkhead box protein 3/fluorescein isothiocyanate (Foxp3‐FITC). Intracellular or intranuclear staining was performed, according to the supplemental protocol for each buffer. The cellular frequency of CD4+/INF‐γ+/IL‐4−, CD4+/INF‐γ−/IL‐4+, or CD4+/CD25+/Foxp3+ in CD4+ helper lymphocytes was evaluated as that of T helper (Th)1, Th2, or regulatory T cells.
FCM analysis
The scatter diagram of each PBMNC, or the QQ cultured cell (QQMNC) population in an individual, was gated into 3 cell‐sized populations of lymphocytes, monocytes, and the larger cells. The percent (%) positivity of a hematopoietic cell population per each gate in PBMNCs or QQMNCs was evaluated and then calculated to that in the whole cells of the 3 gates. The ratio of the % positivity in the whole cells of QQMNCs to that in PBMNCs was further calculated for each cell population. Similarly, the % positivity of each helper T subset (Th1, Th2, or regulatory T cell) was calculated in CD4+ T cells of the 3 gates of PBMNCs or QQMNCs; the ratio of the % positivity in CD4+ T cells of QQMNCs to that in PBMNCs was calculated.
Quantitative Real‐Time Polymerase Chain Reaction In Vitro
Using Trizol (Invitrogen, Carlsbad, CA), total RNA was isolated from PBMNCs or QQMNCs. Contaminated genomic DNA was digested by DNase I treatment (Invitrogen) at 37°C for 15 minutes. DNase I‐treated total RNA was purified by phenol extraction and ethanol precipitation. One hundred nanograms of purified total RNA was used for cDNA synthesis with the SuperScript VILO cDNA synthesis kit (Invitrogen). cDNA mixture was diluted by 10‐fold after first‐strand cDNA synthesis. Using ABI Prism 7700 (Applied Biosystems, Foster City, CA), quantitative real‐time polymerase chain reaction (qRT‐PCR) for diluted cDNA was performed with EagleTaq Master Mix (Roche Diagnostics, Tokyo, Japan), 0.3 μmol/L of forward and reverse primers used for cDNA amplification, and 0.25 μmol/L of probe (Sigma‐Aldrich), according to the manufacturer's protocol. The relative mRNA expression was calculated by ∆∆Ct method with normalization against human GAPDH (hGAPDH). All primers and probes used are listed in Table 7.
Table 7.
Human PCR Primers and Probes for qRT‐PCR in PBMNC and QQMNC
| Gene | Forward Primer | Reverse Primer | TaqMan Probe (5′‐FAM, 3′‐BHQ) |
|---|---|---|---|
| VEGF‐A | 5′‐CCCAGGAGACCT 5′‐GGTTGTGT‐3′ | 5′‐TGGATCCTGCCCTGT CTCTCT‐3′ | 5′‐AGTGGTTGACCTTCC TCCATCCCC‐3′ |
| VEGF‐B | 5′‐AGGTGACACATG GCTTTTCAG A‐3′ | 5′‐GTTCCCCCACTGGGA TATAGC‐3′ | 5′‐TCAGCAGGGTGACTT GCCTCAGA‐3′ |
| Ang‐1 | 5′‐AAGCTACTGGGC CTCCTCTCA‐3′ | 5′‐CCATTAAGGCAT AGTGGATCAAGTC‐3′ | 5′‐AAAAGAGACAGTTGT TGGCAAGGTAGCAA‐3′ |
| Ang‐2 | 5′‐GCAGGGAGTGG TGAGACAGTT‐3′ | 5′‐TGCAGGTGCTATGGT CTTTAGAAT‐3′ | 5′‐ACGGCTCCTCAGAAA TCCAGTGACC‐3′ |
| IGF‐1 | 5′‐GCCCAAAATGCA CTGATGTAAA‐3′ | 5′‐AGTGACTTTGCTATGAGTTGGTGAGT‐3′ | 5′‐CTCTAAAATCCCTTT CAAGCCACCCAT‐3′ |
| Leptin | 5′‐TCACTAGATGGCGAGCATCCT‐3′ | 5′‐CACGCTCAGCTAACTTTTGTGTTT‐3′ | 5′‐CCAACATGGTGAAACCCCGTCTCTAC‐3′ |
| IL‐8 | 5′‐TTTGATACTCCCAGTCTTGTCATTG‐3′ | 5′‐CAAGTTTCAACCAGCAAGAAATTACT‐3′ | 5′‐TTAGAACTATTAAAACAGCCAAAACTCCACA‐3′ |
| IL‐10 | 5′‐GCCTGACCACGCTTTCTAGCT‐3′ | 5′‐CCAAGCCCAGAGACAAGATAAATT‐3′ | 5′‐TTGAGCTGTTTTCCCTGACCTCCC‐3′ |
| IL‐1 β | 5′‐CGGCCACATTTGGTTCTAAGA‐3′ | 5′‐AGGGAAGCGGTTGCTCATC‐3′ | 5′‐ACCCTCTGTCATTCGCTCCCACA‐3′ |
| TGF‐β | 5′‐CCCTGCCCCTACATTTGGA‐3′ | 5′‐CCGGGTTATGCTGGTTGTACA‐3′ | 5′‐TGGACACGCAGTACAGCAAGGTCCT‐3′ |
| TNF‐α | 5′‐GAGACCAGGGAGCCTTTGGT‐3′ | 5′‐TGTGTCAATTTCTAGGTGAGGTCTTC‐3′ | 5′‐CTGGCCAGAATGCTGCAGGACTT‐3′ |
| MMP‐2 | 5′‐GGTTCCCCTGTTCACTCTACTTAGC‐3′ | 5′‐CGGCTTGGTTTTCCTCCAT‐3′ | 5′‐TGTCCCTACCGAGTCTCTTCTCCACTG‐3′ |
| MMP‐9 | 5′‐CCCGGAGTGAGTTGAACCA‐3′ | 5′‐AGGGCACTGCAGGATGTCA‐3′ | 5′‐TGGACCAAGTGGGCTACGTGACCT‐3′ |
| GAPDH | 5′‐GGTGGTCTCCTCTGACTTCAACA‐3′ | 5′‐GTGGTCGTTGAGGGCAATG‐3′ | 5′‐ACACCCACTCCTCCACCTTTGACG‐3′ |
Ang indicates angiopoietin; GAPDH, glyceraldehyde‐3‐phosphate dehydrogenase; IGF, insulin‐like growth factor; IL, interleukin; MMP, matrix metalloproteinase; PBMNCs, peripheral blood mononuclear cells; QQMNCs, quality and quantity control culture of mononuclear cells; qRT‐PCR, quantitative real‐time polymerase chain reaction; TGF, transforming growth factor; TNF, tumor necrosis factor; VEGF, vascular endothelial growth factor.
In Vitro Angiogenesis Assay Using Matrigel
As previously reported,12 PBMNCs and QQMNCs were respectively incubated in 500 μL of 2% FBS/EBM‐2 with 20 μg/mL of acetylated low‐density lipoprotein, labeled with 1,1′‐dioctadecyl‐3,3,3′,3′‐tetramethyl‐indocarbocyanine perchlorate (acLDL‐DiI; Biomedical Technologies Inc., Stoughton, MA) (4×10⁴ cells/500 μL) in a 1.5‐mL tube for 30 minutes at 37°C in a CO2 incubator. After centrifugation at 400g for 10 minutes at 4°C, and aspirating the supernatant, the cell pellets were washed by 1 mL of PBS and suspended with EBM‐2/2% FBS (1.0×10³ cells/50 μL). Labeled cells were resuspended together with human umbilical vain endothelial cells (HUVECs; EPCs: HUVECs=1×10³:1.5×10⁴ in 100 μL of 2% FBS/EBM‐2). The mixed cell suspension was incubated at 37°C in a water bath and applied at 100 μL each onto preincubated Matrigel (BD Falcon) (50 μL/well) in each 96‐well plate (BD Falcon; BD Biosciences). After incubation for 12 hours, the numbers of closed areas formed by HUVECs were counted using Photoshop software in the pictures taken at ×2 high power field (HPF) by a phase‐contrast light microscope (Eclipse TE300; Nikon). Furthermore, acLDL‐DiI‐labeled PBMNCs or QQMNCs incorporated into a tube were also counted using ImageJ software in the pictures taken at ×4 HPF by a fluorescence microscope (IX70; Olympus, Tokyo, Japan). The tube and cellular numbers were counted independently by 2 blinded investigators.
In Vivo Assessment of Blood Flow Recovery and Tissue Regeneration by Cell Tx Using Murine Ischemic Hindlimb Model
Guideline for animal experiment
All animal studies conformed to national and institutional guidelines. The protocols were approved by the guidelines of the Institutional Animal Care and Use Committee of the Isehara Campus, Tokai University School of Medicine (Isehara, Japan), based on Guide for the Care and Use of Laboratory Animals (National Research Council). The experimental animal protocols for making ischemic models and laser Doppler perfusion imaging (LDPI; Moor Instruments, Axminster, UK) were performed under adequate anesthetization by 1.5% to 2.0% isoflurane (Dainippon Sumitomo Pharma Co., Ltd., Osaka, Japan) to minimize pain to mice by regarding the 3Rs (replacement, reduction, and refinement). After surgery, mice were subcutaneously injected with buprenorphine (Repetan, 0.1 mg/kg body weight; Otsuka Pharmaceutical Co., Ltd., Tokyo, Japan) once a day for 3 days to relieve pain or discomfort. At sacrifice, pentobarbital sodium (Somnopentyl, 60 to 70 mg/kg body weight; Kyouritu Seiyaku Co., Ltd., Tokyo, Japan) was intraperitoneally injected.
Making ischemic hindlimb model and cell Tx
Eight‐ to 10‐week‐old male BALB/c nu/nu mice (CAnN.Cg‐Foxn1nu/CrlCrlj; Charles River Laboratories Japan, Inc., Tokyo, Japan) were used, as reported elsewhere.26 The proximal portion of the left femoral artery, including the superficial and the deep branch, was suture‐ligated, and the proximal and distal portions of the saphenous artery were occluded with a bipolar forcep electric coagulator (MERA N3‐14; SENKO MEDICAL INSTRUMENT mfg. Co., Ltd., Tokyo, Japan). The overlying skin was closed with a 6‐0 silk suture. The next day, cells were suspended in IMDM medium and intramuscularly injected into ischemic hindlimbs.
The cell injection sites and the doses for assays were as follows: each one site of anterior tibial muscle (ATM) and gastrocunemius muscle (GCM) for blood flow analysis and histology, that is, hematoxylin and eosin (H&E) staining, Azan staining, and inducible nitric oxide synthase (iNOS) immunohistochemistry (IHC) (5.0×10³ cells/20 μL per site: total 1×10⁴ cells/mouse), 2 sites of ATM for qRT‐PCR (5.0×10³ cells/20 μL per site: total 1×10⁴ cells/mouse), or for histological assessment by confocal images (1.0×10⁵ cells/20 μL per site: total 2×10⁵ cells/mouse).
Assessment of blood flow
LDPI was used to record serial blood flow measurements for 3 weeks after surgery; these data were analyzed using Moor ldi Main software (Laser Doppler Imager ver 5.2; Moor Instruments). The blood flow in identical toe regions of interest (ROIs) between ischemic and contralateral hindlimbs per mouse was measured by LDPI; the blood‐flow ratio of ischemic versus contralateral hindlimb was calculated. Mice with toe necrosis or limb salvage were only involved in the calculation, whereas those with foot necrosis or autoamputation were excluded.
Tissue preparation of histochemical assessment
Three weeks after surgery, 40 μL of Isolectin B4‐FITC (Fluorescein Griffonia Simplicifolia Lectin I, Isolectin B4; Vector Laboratories Inc., Burlingame, CA) was injected into the tail vein using a insulin syringe, and then 20 minutes later, mice were sacrificed under adequate anesthetization. Immediately after sacrifice, mice were perfused with 20 mL of PBS and then with the equivalent volume of 4% paraformaldehyde (PFA)/PBS by cardiac puncture. Subsequently, hindlimbs were resected and incubated in 4% PFA/PBS at 4°C overnight. Thereafter, ATMs, after QQMNCTx and PBMNCTx, were excised and embedded into paraffin for the tissue sample preparation. Alternatively, the muscles, after QQMNCTx, GmCD34Tx, and eEPCTx, were coated with optimal cutting temperature (O.C.T.) compound (Tissue‐Tek; Sakura Finetek Japan Co., Ltd., Tokyo, Japan), immediately frozen in liquid nitrogen, and refrigerated until use at −80°C. Cross‐sectional tissue samples with the thickness at 6 to 8 μm for paraffin section or at 10 μm for frozen sections, were sliced from tissue blocks of muscles and then subjected to assessments as described below.
Microvascularture and pericyte recruitment
For alpha‐smooth muscle actin (α‐SMA) staining, paraffin tissue sections, after deparaffinization or the frozen ones, were washed with PBS, blocked with 10% goat serum for 30 minutes at room temperature (RT), then, incubated with Cy3‐conjugated anti‐α‐SMA Ab (Sigma‐Aldrich) and prediluted (1:200 ratio) with 1% BSA/PBS for 2 hours at RT. After washing with PBS, sections were mounted with 1.25% (w/v) DABCO (Sigma‐Aldrich)/90% (v/v) glycerol/10% (v/v) PBS, then observed using a fluorescent microscope (Biorevo; Keyence Corporation, Osaka, Japan). The same protocol, without using the Ab, was performed as the negative control. Also, the negative control for Isolectin B4‐FITC staining was in advance, prepared from the mice without in vivo injecting Isolectin B4‐FITC into the tail vein.
Using software (VH analyzer; Keyence), microvascular densities were evaluated by counting the microvessels stained with Isolectin B4‐FITC. Simultaneously, pericyte recruitment to the vasculartures was evaluated by counting the α‐SMA‐positive microvessels.
Myogenesis and interstitial fibrosis
Centrally nucleated muscle fibers stained with H&E were photographed with an automatic research photomicroscope (AX80; Olympus) and were then counted as regenerating muscle fibers implying fusion of myoblasts27 by VH analyzer (Keyence). Limb interstitial fibrosis detected by Azan staining was morphometrically assessed by the same photomicroscope and software.28–29
Tissue inflammation
Paraffin tissue sections were deparaffinized, autoclaved in citrate buffer at 121°C for 10 minutes to retrieve the target antigen, incubated with the primary Ab of rabbit polyclonal anti‐iNOS Ab (Abcam, Cambridge, MA) prediluted with 1% BSA/PBS (1:100 ratio) at 4°C overnight (Table 8). Thereafter, samples were treated with 0.3% H2O2/methanol and Histofine Simple Stain MAX PO (Nichirei Biosciences Inc., Tokyo, Japan) and then dyed with 3,3′‐diaminobenzidine, tetrahydrochloride (DAB; Dojindo, Kumamoto, Japan). Furthermore, the samples were stained with hematoxylin, dehydrated, and then mounted with malinol. Frozen tissue sections were also stained with the anti‐iNOS Ab in the same way, after similar autoclave and subsequent treatment with 0.5% Triton X‐100/PBS. Control samples were prepared under the same procedure, using rabbit immunoglobulin fraction (DAKO, Tokyo, Japan).
Table 8.
Primary and Isotype Antibodies to Detect iNOS for Immunohistochemistry
| Antibodies | Company, Catalog No. | Final Dilution Ratio or Concentration |
|---|---|---|
| Anti‐iNOS antibody | Abcam, #ab15323 | 1:100 in 1% BSA/PBS |
| Rabbit immunoglobulin fraction (solid‐phase absorbed) | Dako, #X0936 | 2 μg/mL in 1% BSA/PBS |
iNOS indicates inducible nitric oxide synthase.
Vasculogenesis by transplanted cells
The cross‐sections at 10 μm from frozen tissues, after washing with PBS, were microwaved in target retrieval solution (Dako) diluted with distilled water (1:10 ratio) at 98°C for 10 minutes. Then, after treatment with a streptavidin/biotin blocking kit (Vector Laboratories) to block endogenous biotin, sections were incubated with 5% goat serum/1% BSA/PBS for 30 minutes at RT. For the preparation of primary Ab to human CD31, mouse anti‐human CD31 Ab and biotinylated goat anti‐mouse IgG (Fitzgerald Industries International Inc., Acton, MA) were, respectively, diluted in 1% BSA/PBS (1:8 and 1:48 ratio), that is, adjusted to the concentration of 25 and 60 μg/mL. The prediluted reagents were mixed in the equal volume and reacted at RT for 1 hour. The prereacted reagent was further mixed with mouse serum (2:1 ratio; Rockland Immunochemicals, Inc., Gilbertsville, PA) and incubated at RT for 1 hour. The primary Ab reagent for human CD31 was incubated with the tissue sections at 4°C overnight. Sections were washed with PBS and subsequently incubated with streptavidin and Alexa Fluor 594 conjugate prediluted in 1% BSA/PBS (1:90 ratio) at RT for 1 hour. Tissue sections were washed with PBS and finally mounted with 1 μmol/L of TOTO‐3 iodide (Invitrogen) in 1.25% (w/v) DABCO/90% (v/v) glycerol/10% (v/v) PBS. Tissue sections were observed by a confocal laser‐scanning microscope (LSM510META; Carl Zeiss GmbH, Jena, Germany). Mouse anti‐human CD31 Ab and reagents are detailed in Table 9. The acquired images at 0.8 μm z interval (11 sliced images by 10 intervals at total 8‐μm thickness) were reconstructed three‐dimensional (3D) structures using the function of 3D spectrum analysis. Furthermore, to quantify “vasculogenic properties” in their images, the surface of a volume object in the ROI, was visualized, using an Imaris iso‐surface function of 4D Image analysis software (Imaris 6.2.0; Carl Zeiss): murine vessels stained with Isolectin B4‐FITC (green) and transplanted cell‐derived microvessels stained with Alexa 594–conjugated human specific anti‐CD31 Ab (red). The values of microvascular density in 2D image and % volume per image cube in 3D were respectively calculated for the green‐ or red‐colored microvessels.
Table 9.
Primary and Secondary Antibodies for Immunohistochemistry to Detect Vascular Structures Formed by Transplanted Human Cells
| Antibodies | Company, Catalog No. | Final Dilution Ratio |
|---|---|---|
| Mouse anti‐human CD31 | Dako, #M0823 | 1:24 in 1% BSA/PBS |
| Goat anti‐mouse IgG (H+L) (biotin) | Fitzgerald, #43C‐CB1533 | 1:144 in 1% BSA/PBS |
| Purified mouse IgG1, isotype control | Dako Cytomation, #X0931 | 1:6 in 1% BSA/PBS |
| Streptavidin, Alexa Fluor 594 conjugate | Molecular Probes, #S‐11227 | 1:90 in 1% BSA/PBS |
Murine qRT‐PCR of ischemic hindlimb
Mice were sacrificed under adequate anesthetization on day 6 after cell Tx. GCMs of ischemic hindlimbs were harvested for total RNA isolation, mice were perfused with 20 mL of PBS by cardiac puncture to remove circulating blood, and GCMs were resected out and incubated into 1 mL of RNA later at 4°C overnight. After homoginization of GCMs with 1 mL of Trizol (Invitrogen), total RNA was isolated and genomic DNA was digested by DNase I treatment (Invitrogen) at 37°C for 15 minutes. DNase I–treated total RNA was purified by phenol extraction and ethanol precipitation. Two micrograms of purified total RNA was used for cDNA synthesis with the High Capacity cDNA Reverse Transcription kit (Applied Biosystems). cDNA mixture was sequentially diluted by 20‐ to 160‐fold with Milii‐Q water (Millipore Corporation, Billerica, MA) after first‐strand cDNA synthesis. Using ABI Prism 7700 (Applied Biosystems), TaqMan gene expression assays for diluted cDNA were performed with TaqMan Fast Universal PCR Master Mix (Applied Biosystems), according to the manufacturer's protocol. The amplification of cDNA was as follows: denaturation at 95°C for 3 seconds, annealing/extension at 62°C for 30 seconds, and 40 cycles. The relative mRNA expression was calculated by the ∆∆Ct method with normalization to mouse 18S rRNA. All primers and TaqMan probes used are listed in Table 10.
Table 10.
Murine PCR Primers and TaqMan Probes for qRT‐PCR
| Gene | Catalog No. | Company |
|---|---|---|
| MyoD1 | Mm01203489_g1 | Applied Biosystems |
| Myogenin | Mm00446195_g1 | Applied Biosystems |
| IGF‐1 | Mm00439560_m1 | Applied Biosystems |
| IL‐1β | Mm00434228_m1 | Applied Biosystems |
| TGF‐β | Mm01227699_m1 | Applied Biosystems |
| 18S rRNA | Mm03928990_g1 | Applied Biosystems |
IGF indicates insulin‐like growth factor; IL, interleukin; qRT‐PCR, quantitative real‐time polymerase chain reaction; TGF, transforming growth factor.
Statistical Analysis
Prism5 software (GraphPad Software Inc., Cary, NC) was used to conduct all statistical analyses. Wilcoxon's signed‐rank test or linear regression analysis was used to analyze quantitative variation or correlation of cells and EPC‐CFUs between PBMNCs and QQMNCs in each individual. To assess the variation of each hematopietic cell or helper T subset through QQ culture, Wilcoxon's signed‐rank test was also applied for comparison of the ratio of % cell positivity in the whole cells or CD4+ T cells of QQMNCs to that of PBMNCs in each individual. Mann‐Whitney's U test and Kruskal‐Wallis' test were applied to compare the data between 2 groups and among 3 to 4 groups. The experiment to assess angiovasculogenic properties by transplanted human cells using a confocal fluorescence microscope was performed simultaneously on the whole groups: IMDM control, PBMNCTx, eEPCTx, QQMNCTx, and GmCD34Tx. The data were separately analyzed in the following comparisons: QQMNCTx versus PBMNCTx or IMDM control and QQMNCTx versus GmCD34Tx, eEPCTx, or IMDM control. Especially, vasculogenic properties by transplanted human cells were compared in the groups, excludingd IMDM control. qRT‐PCR assay to evaluate mRNA expression in ischemic hindlimbs was also implemented simultaneously on the whole groups; the data were analyzed and compared in the same manner as those in the former experiment. Furthermore, in the assay, the ratio of relative mRNA expression of ischemic‐to‐contralateral (healthy) hindlimbs in IMDM control was compared by Mann‐Whitney's U test to confirm the ischemic response. In histological assays, 2 tissue sections per mouse were prepared, and 4 to 6 fields per tissue section were evaluated. Probability values of P<0.05 were deemed statistically significant. All values are expressed as mean±SE.
Results
Decrease in Cell Counts in QQMNCs
The fold increase of QQMNCs to PBMNCs per well declined in the whole subjects with an average of 0.54‐fold (Table 11). The calculated total QQMNCs derived from 100 mL of PB decreased from original cells (cell counts×105=831.3±75.3 to 399.2±43.1), on average, by 0.48‐fold (Figure 1A; Table 11).
Table 11.
The Cell and EPC Colony Counts in QQMNC Versus PBMNC
| PB‐MNC | QQ‐MNC | P Value | |
|---|---|---|---|
| Cell counts×105/well | 20.00±0 | 10.88±1.19*** | 0.0003 |
| Cell counts×105/100 mL PB | 831.3±75.3 | 399.2±43.1*** | 0.0004 |
| pEPC‐CFU counts/2×105 cells/dish | 1.58±0.34 | 2.89±0.60* | 0.0393 |
| dEPC‐CFU counts/2×105 cells/dish | 0.71±0.22 | 29.41±2.34*** | 0.0002 |
| Total EPC‐CFU counts/2×105 cells/dish | 2.31±0.53 | 31.63±2.66*** | 0.0002 |
| pEPC‐CFU counts×105/100 mL PB | 644.7±125.2 | 500.4±106.2 | 0.4331 |
| dEPC‐CFU counts×105/100 mL PB | 285.1±78.4 | 5407±790.0*** | 0.0002 |
| Total EPC‐CFU counts×105/100 mL PB | 934.3±190.8 | 5839±855.2*** | 0.0002 |
Each value indicates a mean±SE. N=18 volunteers. dEPC‐CFU indicates definitive endothelial progenitor cells colony‐forming units; PBMNC, peripheral blood mononuclear cell; pEPC‐CFU, primitive endothelial progenitor cells colony‐forming units; QQMNC, quality and quantity control culture of mononuclear cell.
*P<0.05; ***P<0.001 versus PBMNC.
Figure 1.

Characteristics of QQMNCs versus PBMNCs. A, The graph shows total cell counts of PBMNCs isolated from 100 mL of PB and the respective QQMNC counts. B, The left graph indicates linear regression analysis between the cell‐count ratio of QQMNCs versus PBMNCs (2×10⁶ cells/well) and PBMNC counts isolated from 100 mL of PB. The right indicates linear regression analysis of cell counts between PBMNCs and QQMNCs per 100 mL of PB. C, Representative pictures of pEPC‐CFU and dEPC‐CFU. Scale bar=500 μm. D, The left and middle graphs are EPC‐CFU counts generated from PBMNCs or QQMNCs per dish (2×10⁵ cells/dish) and in 100 mL of PB. The right graph shows the percentage of each EPC‐CFU count versus total EPC‐CFU count per dish. Each column in the graph represents a mean±SE. The white and gray areas in the bar graphs indicate the values of pEPC‐CFU and dEPC‐CFU. E, Linear regression graphs on the interrelation of each EPC‐CFU count per dish in QQMNCs to that in PBMNCs. *P<0.05; ***P<0.001. N=18 volunteers. F, Comparison of EPC colony forming activities of post‐QQ cultured cells among CD34+ cells, CD34‐MNCs, and their repopulated cells. QQ‐34‐MNC: QQ cultured cells of CD34‐MNCs (2×10⁶ cells/2 mL of QQ culture medium), QQ‐34+: QQ cultured cells of CD34+ cells alone (4×10³ cells/2 mL of QQ culture medium); QQ‐34+/34‐MNC: QQ cultured cells of CD34+ cells repopulated CD34‐MNCs (4×10³ cells for CD34+ cells with 2×10⁶ cells for CD34‐MNCs/2 mL of QQ culture medium). *P<0.05; **P<0.01; ***P<0.001 versus QQ‐34‐MNC. #P<0.05; ###P<0.001 versus QQ‐34+. Each column in the graph represents a mean±SE. N=3 volunteers. Aliquots of each cell cultured in the equal volume of QQ culture medium were applied to EPC‐CFA; the aliquots were respectively seeded at 2×10⁵ cells/dish (3 dishes each for 3 volunteers) for QQ‐34‐MNC and QQ‐34+/34‐MNC, and at the ratio of 2×10⁵ cells to the QQ‐34+/34‐MNCs for QQ‐34+. dEPC‐CFU indicates definitive endothelial progenitor cells colony‐forming units; PBMNCs, peripheral blood mononuclear cells; pEPC‐CFU, primitive endothelial progenitor cells colony‐forming units; QQMNCs, quality and quantity control culture of mononuclear cells.
Interestingly, the fold increase of QQMNCs per well exhibited the negative correlation with total cells of PBMNCs from 100 mL of PB in healthy subjects (Figure 1B, left). Taken together, these findings indicate that even using higher PBMNC densities per 100 mL of PB resulted in constant relative yields of QQMNCs per the PB volume (Figure 1B, right).
Increase of Colony‐Forming EPCs in QQMNCs
To assess vasculogenic activities between PBMNCs and QQMNCs, EPC‐CFA was used to monitor 2 different types of EPC‐CFUs, pEPC‐CFUs, and dEPC‐CFUs, which comprised small cells and large cells, respectively. pEPCs had high cell proliferation activity; in contrast, dEPCs had high vasculogenic potential.12
Briefly, for in vitro assays, dEPCs had higher cell adhesion activity than did pEPCs, and dEPCs formed tube‐like structures; additionally, dEPCs extensively formed blood vessel de novo after Tx into ischemic hindlimbs of mice, but pEPCs did less.
Therefore, pEPCs derive from relatively immature, highly proliferative EPCs, whereas dEPCs are relatively mature, differentiated, and able to promote EPC‐mediated cell functions required for vasculogenesis.
The pEPC and dEPC colony‐forming cells (CFCs) each constituted a small proportion of the cells in primary PBMNC populations (8×10⁻⁴% and 3.5×10⁻⁴%, respectively; Figure 1C and 1D, left; Table 11). These colony assays demonstrated that QQMNCs have much greater vasculogenic potential than do PBMNCs. After QQ culture, the frequency of total EPC‐CFUs from 2×10⁵ cells per dish in QQMNCs was significantly enhanced by 13.7‐fold of that in PBMNCs. Especially, the frequency of dEPC‐CFUs increased by 41.4‐fold of that in PBMNCs.
The present data indicate that the vascular regenerative capacity of QQMNCs was superior to that of PBMNCs (Figure 1D, left).
Although QQ culture reduced the count of cells in each individual culture, dEPC‐CFCs, and total EPC‐CFCs in QQMNCs, derived from the even blood volume were enriched 19.0‐ and 6.2‐fold, relative to those in PBMNCs (Figure 1D, middle; Table 11). Not only were QQ culture enriched with dEPC‐CFCs, but also the EPC‐CFCs in QQMNCs had a 2.7‐fold greater differentiation potential than those in PBMNCs, considering the percentage of dEPC‐CFUs to total EPC‐CFUs per dish in PBMNCs and QQMNCs (Figure 1D, right).
We also used a linear regression analysis to compare between PBMNCs and QQMNCs with regard to both the quantity and quality of EPC‐CFUs (Figure 1E).
Notably, dEPC‐CFU and total EPC‐CFU counts in QQMNCs were positively correlated with pEPC‐CFU counts in PBMNCs, but pEPC‐CFU counts in QQMNCs were not (Figure 1E, left). In contrast, neither pEPC‐CFU counts nor total EPC‐CFU counts in QQMNCs were positively correlated with dEPC‐CFU counts in PBMNCs (Figure 1E, middle).
In summary, the frequency of EPC‐CFCs in QQMNCs depended on that in PBMNCs (Figure 1E, right). Importantly, the frequency of dEPC‐CFCs in QQMNCs was positively correlated with that of pEPC‐CFCs in PBMNCs; these correlations indicate that the differentiation during QQ culture of pEPC‐CFCs in PBMNCs contributed to formation of dEPC‐CFCs in QQMNCs.
Collectively, assays of colony formation demonstrated that the quantitative and qualitative vasculogenic potential of QQMNCs is drastically enhanced, relative to that of PBMNCs, when evaluated even by blood volume.
Moreover, we assessed the functional relationship between CD34+ cells and CD34+ cell‐depleted MNCs (CD34‐MNCs) in PBMNCs during QQ culture (Figure 1F). CD34‐MNCs after QQ culture (QQ‐34‐MNCs) did not yield EPC colony, whereas CD34+ cells after QQ culture (QQ‐34+ cells) encompassed pEPC‐CFCs. This means that EPC‐CFCs were basically derived from CD34+ cells. When CD34+ cells were cocultured with CD34‐MNCs (QQ‐34+/34‐MNC) at a 1:500 ratio, mimicking the proportion of CD34+ cells involved in naïve PBMNCs, the dEPC population expanded significantly, relative to the QQ‐34+ population, even though the original CD34+ cell count was equal. The result suggests that CD34‐MNCs included some cell population to accelerate EPC expansion and differentiation in CD34+ cells through QQ culture.
Cell Population Transition in QQMNCs
Based on microscopy and fluorescent cell sorting, large cells were proportionally more common in QQMNC than in PBMNC samples (Figure 2A and 2B). In FCM, the proportion of each positive cell involved in the whole cells of (a), (b), and (c) gates separated with red lines was estimated (Figure 2B).
Figure 2.
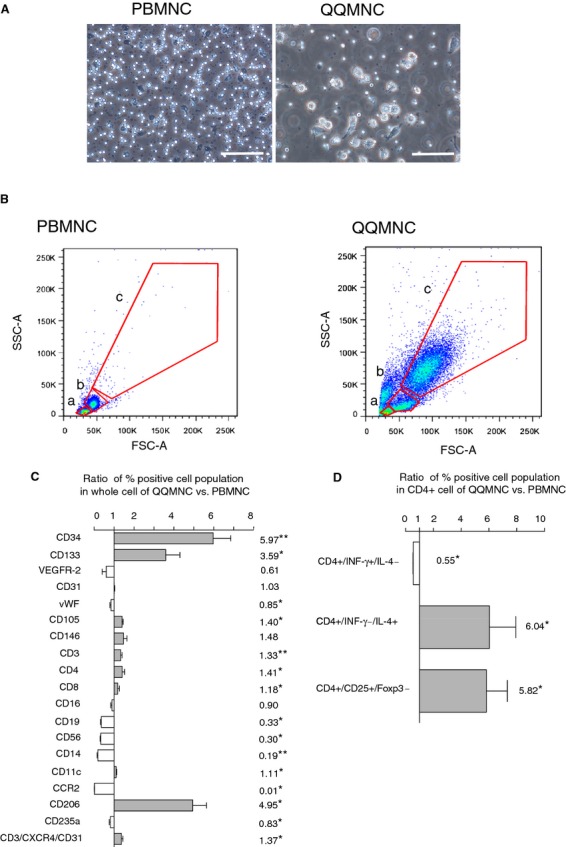
Flow cytometry analysis of PBMNCs and QQMNCs. A, Representative features of PBMNCs at 3 hours after seeding and QQMNCs after 7 days. Scale bar=100 μm. B, Scatter diagrams of PBMNCs and QQMNCs in flow cytometry. The red lines indicate the cellular‐sized gates of lymphocyte (a), monocyte (b), or the larger cell (c). C, The bar graph shows the ratio of each percent (%) cell positivity in QQMNCs to that in PBMNCs. N=4 to 6 volunteers. The investigated cell surface markers were as follows: hematopoietic stem cell (CD34, CD133), endothelial cell (VEGFR‐2, CD31, vWF, CD105, and CD146), T cell (CD3, CD4, CD8, and CD3/CXCR4/CD31), NK cell (CD16 and CD56), B cell (CD19), monocyte (CD14), dendritic cell (CD11c), M1 macrophage (CCR2), M2 macrophage (CD206), and erythroid progenitor (CD235a). D, The bar graph indicates the ratio of each % helper T subset positivity in CD4+ cells of QQMNCs to that of PBMNCs. N=6 volunteers. *P<0.01; **P<0.01 in (C and D). The gray or white column represents a mean±SE in each increase or decrease. The number associated with each graph column shows the mean value. CCR2 indicates CC chemokine receptor 2; Foxp3, forkhead box P3; FSC‐A, forward scatter‐area; IL, interleukin; INF, interferon; NK, natural killer; PBMNCs, peripheral blood mononuclear cells; QQMNCs, quality and quantity control culture of mononuclear cells; SSC‐A, side scatter‐area; VEGFR, vascular endothelial growth factor receptor; vWF, von Willebrand factor.
QQMNCs exhibited the enrichment of CD34+ and CD133+ stem cell populations, compared to PBMNCs (5.97‐fold in CD34+ cells; 3.59 in CD133+ cells; Figure 2C; Table 12).
Table 12.
Percent Positivities of Hematopoietic Cell Populations in QQMNC Versus PBMNC
| % in PBMNC | % in QQMNC | P Value | Ratio | P Value | |
|---|---|---|---|---|---|
| CD34+ | 0.21±0.03 | 1.25±0.26** | 0.0078 | 5.97±0.88** | 0.0078 |
| CD133+ | 0.23±0.08 | 0.48±0.08 | 0.0977 | 3.59±0.71* | 0.0195 |
| VEGFR‐2+ | 1.07±0.15 | 0.67±0.28 | 0.2500 | 0.61±0.21 | 0.2500 |
| CD31+ | 39.60±1.93 | 40.66±1.89 | 0.2969 | 1.03±0.02 | 0.2969 |
| vWF+ | 10.52±3.63 | 10.33±4.07 | 0.7422 | 0.85±0.06* | 0.0391 |
| CD105+ | 22.65±1.37 | 32.05±2.84* | 0.0313 | 1.40±0.05* | 0.0313 |
| CD146+ | 1.57±0.20 | 2.09±0.16 | 0.1094 | 1.48±0.17 | 0.1094 |
| CD3+ | 55.16±4.12 | 71.30±2.61** | 0.0078 | 1.33±0.08** | 0.0078 |
| CD4+ | 34.38±4.27 | 46.38±3.28* | 0.0350 | 1.41±0.12* | 0.0313 |
| CD8+ | 19.54±2.70 | 22.03±1.80* | 0.0345 | 1.18±0.08* | 0.0313 |
| CD16+ | 35.66±1.73 | 31.76±0.88 | 0.2500 | 0.90±0.06 | 0.2500 |
| CD19+ | 22.00±2.27 | 6.98±0.16* | 0.0350 | 0.33±0.03* | 0.0313 |
| CD56+ | 24.50±1.17 | 7.63±1.11* | 0.0350 | 0.30±0.03* | 0.0313 |
| CD14+ | 19.80±1.73 | 3.47±0.57** | 0.0078 | 0.19±0.04** | 0.0078 |
| CD11c+ | 35.81±2.19 | 39.57±2.39* | 0.0391 | 1.11±0.03* | 0.0391 |
| CCR2+ | 15.70±1.48 | 0.22±0.06* | 0.0350 | 0.01±0.004* | 0.0355 |
| CD206+ | 5.53±0.33 | 26.28±2.69* | 0.0350 | 4.95±0.70* | 0.0355 |
| CD235a+ | 0.88±0.09 | 0.71±0.03* | 0.0211 | 0.83±0.05* | 0.0223 |
| CD3+/CXCR4+/CD31+ | 30.28±1.75 | 41.01±2.07* | 0.0350 | 1.37±0.07* | 0.0350 |
“% in PBMNC” and “% in QQMNC” indicate the % positivity of each cell population in the whole cell of QQMNC and PBMNC. “Ratio” means the ratio of the % positivity in the whole cell of QQMNC to that of PBMNC, corresponding to Figure 2C. The left P values indicate the comparison of % cell positivities between QQMNC and PBMNC; the right ones indicate that of the ratios. N=4 to 6 volunteers. CCR2 indicates CC chemokine receptor 2; CXCR4, C‐X‐C chemokine receptor type 4; PBMNC, peripheral blood mononuclear cell; QQMNC, quality and quantity control culture of mononuclear cell; VEGFR, vascular endothelial growth factor receptor; vWF, von Willebrand factor.
*P<0.05; **P<0.01 versus PBMNC.
In contrast, the proportion of many hematopoietic cell types, including B lymphoid cells (CD19+ cells), proinflammatory monocytes/macrophages (CC chemokine receptor 2+ cells; CCR2+ cells), and natural killer (NK) cells (CD56+ cells) was lower in QQMNC than in PBMNC samples.
The proportion of endothelial lineage cells was slightly increased in CD105, whereas it was not changed in CD31 and slightly decreased in vWF. Although not significant, the proportion was slightly increased in CD146, while decreased in VEGF receptor (VEGFR)‐2.
In the T‐lymphoid cell population, and particularly in the angiogenic T‐cell subpopulation, C‐X‐C chemokine receptor type 4 (CXCR4)+/CD31+/CD3+ cells30 increased significantly after QQ culture. Notably, the proportion of anti‐inflammatory M2‐type (CD206) cells increased significantly (4.95‐fold) in the 2 categories of macrophages; inversely, the proportion of proinflammatory M1‐type (CCR2) cells decreased significantly (0.01‐fold).31–32
More interestingly, when activated T lymphocytes of QQMMCs or PBMNCs by PMA and ionomycin, the proportion of Th1 cells (CD4+/INF‐γ+/IL‐4−) in helper T (CD4+) cells in QQMNCs declined 0.55‐fold of that in PBMNCs. In contrast, the proportions of Th2 cells (CD4+/INF‐γ−/IL‐4+) and regulatory T cells (CD4+/CD25+/Foxp3+) increased 6.04‐ and 5.82‐fold (Figure 2D; Table 13).
Table 13.
Percent Positivities of Helper T‐Cell Subsets in CD4+ T Cells of QQMNC Versus PBMNC
| % in CD4+ Cell | |||||
|---|---|---|---|---|---|
| PBMNC | QQMNC | P Value | Ratio | P Value | |
| CD4+/INF‐γ+/IL‐4− | 10.34±3.71 | 5.90±2.28* | 0.0355 | 0.55±0.02* | 0.0355 |
| CD4+/INF‐γ−/IL‐4+ | 2.94±0.53 | 14.91±3.10* | 0.0355 | 6.04±1.90* | 0.0350 |
| CD4+/CD25+/Foxp3+ | 3.40±0.82 | 15.00±1.96* | 0.0355 | 5.82±1.51* | 0.0355 |
“% in CD4+ cell” indicates the percent (%) positivity of each helper T subset in CD4+ T cell of QQMNC and PBMNC. “Ratio” means the ratio of the % positivity in CD4+ T cell of QQMNC to that of PBMNC, corresponding to Figure 2D. The left P values indicate the comparison of % cell positivities between QQMNC and PBMNC; the right ones indicate that of the ratios. Foxp3 indicates forkhead box P3; IL, interleukin; INF, interferon; PBMNC, peripheral blood mononuclear cell; QQMNC, quality and quantity control culture of mononuclear cell. N=6 volunteers.
P<0.05 versus PBMNC.
These data indicate that QQ culture conditions specifically selected for and/or promote proliferation of stem/progenitor cell populations of EPCs as well as anti‐inflammatory and angiogenic monocytes/T‐lymphocytes in primary PBMNC cultures.
Enhanced Gene Expression for Vascular Regeneration and Anti‐Inflammation in QQMNCs
Expression of genes encoding vascular regeneration factors, including VEGF‐B, angiopoietin‐1 (Ang‐1), leptin, IL‐8, IL‐10, and insulin‐like growth factor 1 (IGF‐1), was much higher in QQMNCs than in PBMNCs; the fold increases in QQMNCs versus PBMNCs were 4.2 for VEGF‐B, 2.4 for Ang‐1, 35.9 for leptin, 6.3 for IL‐8, 5.4 for IL‐10, and 21.2 for IGF‐1 (Figure 3A and 3B). Especially, VEGF‐B and Ang‐1 also induce vascular maturation,33–34 and IGF‐1 exerts myogenic potential.35
Figure 3.
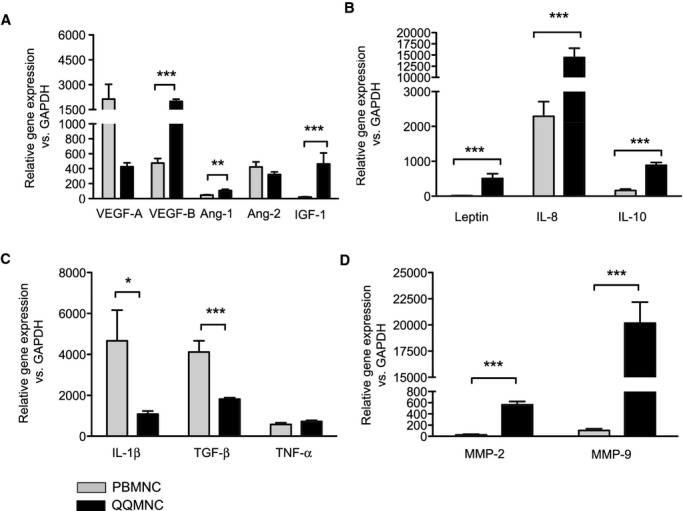
qRT‐PCR assay of PBMNCs and QQMNCs. A, Proangiogenic growth factors. B, Proangiogenic cytokines. C, Pro‐ or anti‐inflammatory cytokines. D, MMPs. *P<0.05; **P<0.01; ***P<0.001. Each graph column represents a mean±SE. N=8 volunteers. Ang indicates angiopoietin; GAPDH, glyceraldehyde‐3‐phosphate dehydrogenase; IGF, insulin‐like growth factor; IL, interleukin; MMPs, matrix metalloproteinases; PBMNCs, peripheral blood mononuclear cells; QQMNCs, quality and quantity control culture of mononuclear cells; qRT‐PCR, quantitative real‐time polymerase chain reaction; TGF, transforming growth factor; TNF, tumor necrosis factor; VEGF, vascular endothelial growth factor.
Additionally, expression of the gene encoding IL‐1β, a proinflammatory cytokine, in QQMNCs decreased by 0.23‐fold of that in PBMNCs, with the increase of the gene encoding the anti‐inflammatory IL‐10 (Figure 3C). These expressional profiles indicate that QQMNCs preferred to arrange an anti‐inflammatory environment in injured tissue. Furthermore, the expression of genes encoding to matrix metalloproteinases (MMPs) of MMP‐2 and ‐9 was significantly higher in QQMNCs than in PBMNCs; the fold increases were 22.1 for MMP‐2 and 189.4 for MMP‐9 (Figure 3D). MMP‐2 and ‐9 have antifibrotic activity that plays critical roles during neovascularization and tissue remodeling.36–37
QQMNCs Promote Angiogenesis In Vitro
Using an in vitro Matrigel assay, we found that QQMNCs promoted tube formation of cocultured HUVECs for 12 hours, but PBMNCs did not (tube counts/×2 HPF=63.3±1.43 for HUVEC+QQMNC versus 55.1±1.45 for HUVEC+PBMNC or 55.3±1.39 for HUVEC alone; Figure 4A and 4B).
Figure 4.
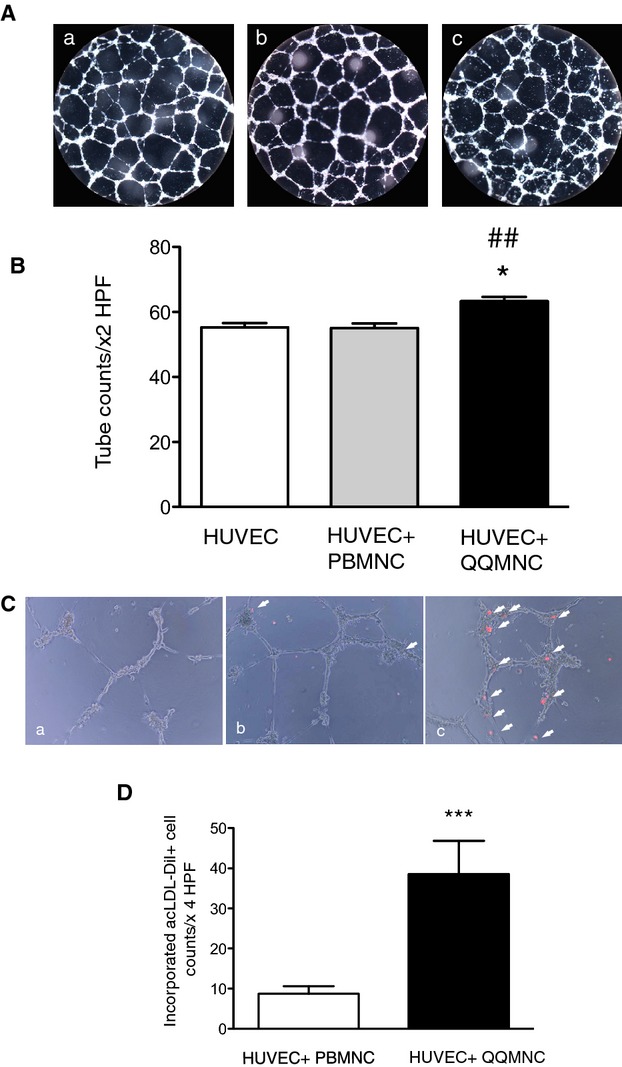
In vitro angiogenic assay of HUVECs cocultured with QQMNCs. A, Features of tubes formed by HUVECs. B, The bar graphs represent the number of tubes counted under ×2 HPF. *P<0.05 versus HUVEC; ##P<0.01 versus HUVEC+PBMNC. C, Incorporation of acLDL‐DiI uptaking PBMNCs or QQMNCs into tubes of HUVECs. Arrow heads indicate PBMNCs or QQMNCs that are labeled with acLDL‐DiI and incorporated into tubes formed by HUVECs. (a) HUVEC alone, (b) HUVEC+PBMNC, and (c) HUVEC+QQMNC in (A and C). D, The bar graphs show numbers of incorporated PBMNCs or QQMNCs, counted under ×4 HPF. ***P<0.001. Each graph column represents a mean±SE. N=10 wells/group. acLDL‐DiI indicates acetylated low density lipoprotein, labeled with 1,1′‐dioctadecyl‐3,3,3′,3′‐tetramethyl‐indocarbocyanine perchlorate; HPF, high power field; HUVECs, human umbilical vein endothelial cells; PBMNCs, peripheral blood mononuclear cells; QQMNCs, quality and quantity control culture of mononuclear cells.
Moreover, QQMNCs were readily incorporated into the tubes formed by HUVECs; in contrast, PBMNCs were rarely incorporated into such tubes (incorporated DiI‐uptaking cells in tubes/×4 HPF=38.5±8.30 for QQMNC versus 8.72±1.89 for PBMNC; Figure 4C and 4D).
These findings indicate that in vitro QQMNCs had more angiogenic‐ and EPC‐incorporating activity than did PBMNCs.
Physiological Recovery of Blood Perfusion in Ischemic Hindlimb After QQMNCTx
We investigated the potential of QQMNCs to treat ischemia, using a mouse ischemic hindlimb model; the effect was evaluated by blood flow measurement for 21 days after ischemic surgery. We compared the effect of QQMNCTx with that of no‐cell Tx (IMDM medium‐injected mice:IMDM control) or PBMNCTx (Figure 5A).
Figure 5.
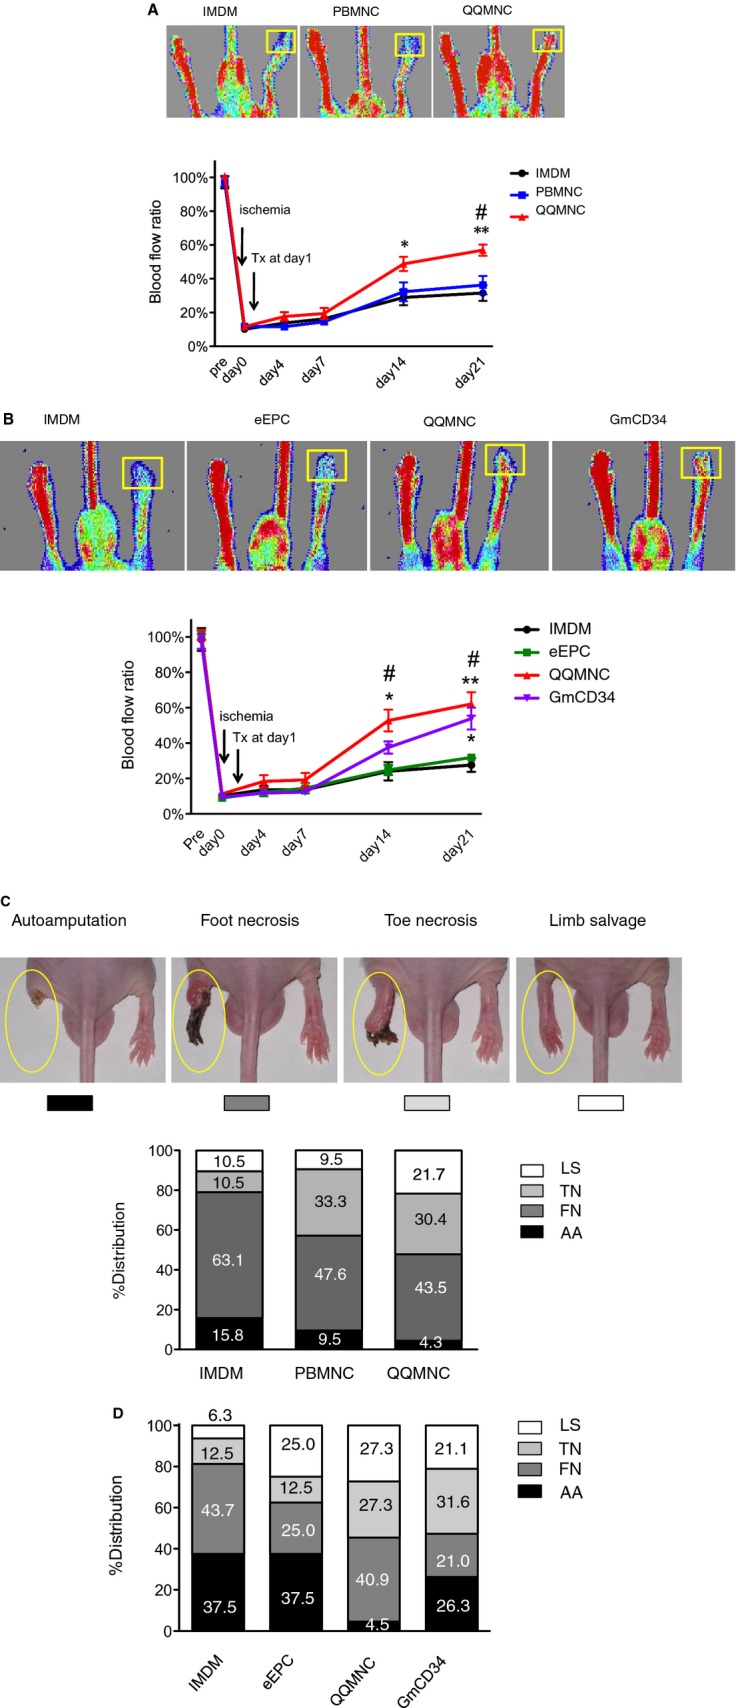
Blood flow and distribution of limb salvage patterns in ischemic hindlimbs. A and B, Laser Doppler imaging was used to analyze blood flow 21 days after ischemia. Cells were transplanted at 1×10⁴/mouse (5×10³ cells/each of ATM and GCM). The top panels show the representative features in each group. ROI for blood flow measurement is shown by a yellow square. The bottom line graph presents percent (%) blood‐flow ratio of ischemic‐to‐contralateral hindlimb during the observation period for 21 days. *P<0.05; **P<0.01 versus IMDM control. #P<0.05 versus PBMNCTx in (A) or eEPCTx in (B). Each line graph represents a mean±SE. N=12 mice/group. C and D, Limb salvage features of QQMNCTx versus PBMNCTx day 21 after ischemia. The top pictures in (C) show the representative features of ischemic leg patterns; the severity of the phenotypes are graded from the left to the right. The column graphs in (C and D) show the respective % distributions of severity for each group. N=19 mice for IMDM control, 21 for PBMNCTx, and 23 for QQMNCTx in (C). N=10 mice per each group in (D). LS, limb salvage; TN, toe necrosis; FN, foot necrosis; AA, autoamputation in (C and D). ATM indicates anterior tibial muscle; eEPCTx, early endothelial progenitor cell transplantation; GCM, gastrocunemius muscle; GmCD34, granulocyte colony‐stimulating factor mobilized CD34+ cell; IMDM, Iscove's Modified Dulbecco's Medium; PBMNCTx, peripheral blood mononuclear cell transplantation; QQMNCTx, quality and quantity control culture of mononuclear cell transplantation; ROI, regions of interest.
For each mouse, we measured blood flow in the ischemic and contralateral hindlimb; we then calculated the ratio of ischemic blood flow to contralateral flow: % blood flow ratio in the QQMNCTx, PBMNCTx, and control groups=at day 14, 48.8±4.25, 32.3±5.53, and 28.9±4.52: at day 21, 50.7±5.50, 28.1±6.19, and 27.4±6.98, respectively. The ratio in the QQMNCTx was significantly higher after day 14 than that in PBMNCTx and control, indicating that QQMNCTx recovered ischemic blood flow greater than the others.
Comparing to other EPC transplantations (Figure 5B), QQMNCTx improved the blood‐flow ratio earlier than GmCD34Tx, eEPCTx, and control: % blood flow ratio in QQMNCTx, GmCD34Tx, eEPCTx, and control=at day 14, 52.8±6.13, 37.6±3.48, 24.8±2.83, and 24.1±5.13; at day 21, 62.1±6.61, 53.9±6.18, 31.8±1.57, and 27.7±3.86, respectively.
The % ratios of autoamputation in the QQMNCTx, PBMNCTx, and control groups were 4.3, 9.5, and 15.8, respectively; conversely, those of limb salvage were 21.7, 9.5, and 10.5, respectively. These findings indicate that QQMNCTx potentiated physiological recovery in hindlimb ischemia more so than did PBMNCTx or control (Figure 5C).
When compared to GmCD34Tx and eEPCTx, the % ratios of autoamputation in QQMNCTx, GmCD34Tx, and eEPCTx were 4.5, 26.3, and 37.5, respectively. In contrast, those of limb salvage in QQMNCTx, GmCD34Tx, and eEPCTx were 27.3, 21.1, and 25.0, respectively.
Regarding these findings, the earlier blood flow recovery by QQMNCTx might favorably rescue the ischemic foot from injury, compared to other treatments (Figure 5D).
QQMNCTx Potentiates Vascular and Muscle Regeneration in Ischemic Hindlimb
Angiogenesis and arteriogenesis
For each animal, we used histological methods to measure Isolectin B4‐FITC stained microvessel density and assess angiogenic capacity in the ATM of ischemic hindlimbs; the mean densities (microvessel counts/mm2) for the QQMNCTx, PBMNCTx, and control groups were 400.7±37.9, 118.9±20.1, and 98.7±15.8, respectively (Figure 6A and 6B).
Figure 6.
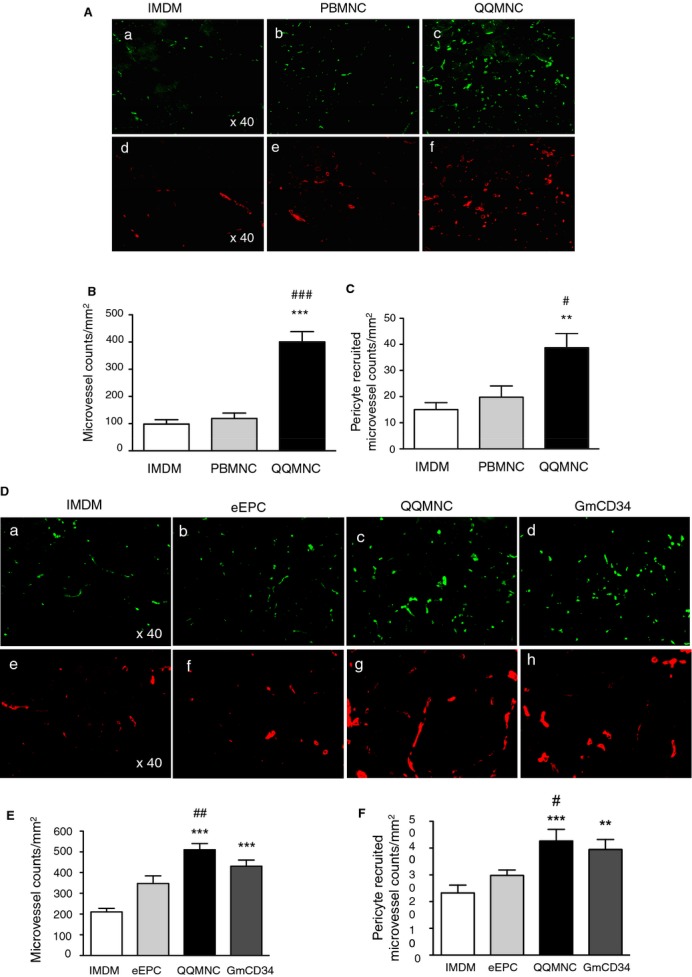
Assessment of angiogenesis and arteriogenesis in ischemic hindlimbs. A and D, Representative pictures of angiogenesis and arteriogenesis in ATM in each group. (a through c) in (A) and (a through d) in (D): mouse microvessels stained with isolectin B4‐FITC. (d through f) in (A) and (e through h) in (D): pericyte recruited microvessels stained with Cy3‐conjugated anti‐α‐SMA antibody. The graphs present the counts of microvessels in (B and E) and pericyte recruited microvessels in (c and f). *P<0.05; **P<0.01; ***P<0.001 versus IMDM control in (B, C, E, and F). #P<0.05; ###P<0.001 versus PBMNCTx in (B and C). #P<0.05; ##P<0.01 versus eEPCTx in (E and F). ×40 HPF. Each column in the graph represents a mean±SE. N=6 mice per group. ATM indicates anterior tibial muscle; eEPCTx, early endothelial progenitor cell transplantation; FITC, fluorescein isothiocyanate; GmCD34, granulocyte colony stimulating factor mobilized CD34+ cell; HPF, high power field; PBMNCTx, peripheral blood mononuclear cell transplantation; QQMNC, quality and quantity control culture of mononuclear cells; α‐SMA, alpha‐smooth muscle actin.
We also evaluated pericyte‐recruited (α‐SMA+) microvessel densitiy in the ATM to assess arteriogenesis for vascular maturation: The mean densities (pericyte‐recruited microvessel counts/mm2) for the QQMNCTx, PBMNCTx, and control groups were 38.7±5.5, 19.8±4.3, and 15.0±2.7, respectively (Figure 6A and 6C).
Likewise, the mean microvessel densities (microvessel counts/mm2) for the QQMNCTx, GmCD34Tx, eEPCTx, and control groups were 510.7±30.0, 430.6±29.8, 347.9±36.5, and 210.5±16.8 respectively (Figure 6D and 6E). The mean pericyte‐recruited microvessel densities (pericyte‐recruited microvessel counts/mm2) for the QQMNCTx, GmCD34Tx, eEPCTx, and control groups were 42.6±4.3, 39.5±3.8, 29.8±2.0, and 23.2±2.9, respectively (Figure 6D and 6F). These findings demonstrate that QQMNCTx promoted angiogenesis and arteriogenesis for vascular maturation.
Vasculogenesis
We performed in vivo experimenents to assess vasculogenic properties of transplanted cells (2×10⁵ cells/mouse): to investigate whether and to what extent transplanted cells differentiate into endothelial cell forming vascular structure in the host tissue, using a confocal fluorescence microscope (Figure 7A; Video S1).
Figure 7.

Evaluation of vasculogenesis by transplanted cells in ischemic hindlimbs. A, The representative 2D and 3D images to assess vasculogenesis and angiogenesis in cell (GmCD34) transplanted ATM by 3D spectrum analysis using a confocal microscope. (Green) Mouse microvessels stained with isolectin B4‐FITC, (red) vasculogenic microvessels by transplanted human cells, stained with human specific anti‐CD31 antibody/Alexa 594, and (blue) nuclei stained with TOTO‐3. The unit of numbers in their images indicates micrometers (μm). B and E, The panels show the representative similar images in each treatment group. Cells were transplanted at 2×10⁵ cells per ATM. Scale bar=20 μm. C and F, Microvessel counts/mm2 in each group. D and G, Percent (%) microvessel volume per 3D image cube (142.58×142.58×8 μm) in each group. *P<0.05; **P<0.01; ***P<0.001 versus IMDM control in (C, D, F, and G). #P<0.05; ##P<0.01; ###P<0.001 versus PBMNCTx in (C and D) or eEPCTx in (F and G). Each column on the graph represents a mean±SE. N=3 to 4 mice per group. ATM indicates anterior tibial muscle; eEPCTx, early endothelial progenitor cell transplantation; GmCD34, granulocyte colony‐stimulating factor mobilized CD34+ cell; PBMNCTx, peripheral blood mononuclear cell transplantation; QQMNC, quality and quantity control culture of mononuclear cells.
IHC stainings demonstrated the significantly higher vasculogenic microvessel counts in QQMNCTx muscles than those in PBMNCTx (Figure 7B through 7D; Table 14).
Table 14.
The Angiogenic and Vasculogenic Microvessels in Ischemic ATMs 21 Days After Surgery
| Tx Cells | Microvessel counts/mm2 in 2D | Microvessel Volume % in 3D | ||||
|---|---|---|---|---|---|---|
| Angio | Vasculo | Total | Angio | Vasculo | Total | |
| IMDM | 229.6±37.4 | 0±0 | 229.6±37.4 | 0.15±0.06 | 0±0 | 0.15±0.06 |
| PBMNC | 602.6±165.4 | 202.9±97.3 | 805.5±220.6 | 0.36±0.16 | 0.05±0.04 | 0.41±0.19 |
| eEPC | 449.7±90.7 | 203.8±50.8 | 653.5±115.5 | 0.39±0.07 | 0.06±0.02 | 0.46±0.07 |
| QQMNC | 1008.0±162.1 | 811.6±178.6 | 1820.0±191.0 | 1.17±0.29 | 0.76±0.17 | 1.92±0.37 |
| GmCD34 | 930.8±118.2 | 662.2±98.6 | 1593.0±168.7 | 1.05±0.35 | 0.53±0.15 | 1.58±0.46 |
Each value indicates a mean±SE. N=3 to 4 mice per group. Angio indicates angiogenic microvessel; ATM, anterior tibial muscle; eEPC, early endothelial progenitor cell; GmCD34, granulocyte colony‐stimulating factor mobilized CD34+ cell; PBMNC, peripheral blood mononuclear cell; QQMNC, quality and quantity control culture of mononuclear cell; Tx cells=2×10⁵ cells/mouse transplanted into ischemic ATM; Vasculo, vasculogenic microvessel.
The average vasculogenic microvessel densities in 2D image (vasculogenic microvessel counts/mm2) for the QQMNCTx and PBMNCTx groups were 811.6±178.6 and 202.9±97.3 (Figure 7C); the % ratios of vasculogenic microvessel volume per image cube for the respective groups were 0.76±0.17 and 0.05±0.04 (Figure 7D).
The potential of QQMNCTx was also markedly superior to that of eEPCTx, whereas it was equal to or greater than that of GmCD34Tx. The average vasculogenic microvessel densities (vasculogenic microvessel counts/mm2) for the GmCD34Tx and eEPCTx groups were 662.2±98.6 and 203.8±50.8, respectively (Figure 7E and 7F; Table 14); the % ratios of vasculogenic microvessel volume per image cube for the groups were 0.53±0.15 and 0.06±0.02 (Figure 7E and 7G; Table 14).
Similarly, the angiogenic properties of transplanted cells, here evaluated by the confocal microscopic analysis, exhibited the compatible feature with those in the aforementioned experiments of the low‐dose cellular Tx (1×10⁴ cells/mouse).
The findings indicate that transplanted cells of QQMNCs, as well as GmCD34, exerted vasculogenic properties in ischemic hindlimbs superior to those of PBMNCs or eEPCs.
Myogenesis
Muscle fibers with centrally located nuclei indicate myogenesis mediated by fusion of myoblasts in ATM of ischemic hindlimbs; therefore, we determined that the average densities of such regenerating muscle fibers (regenerating muscle fibers/mm2) for the QQMNCTx, PBMNCTx, and control groups were 775.6±113.3, 424.2±47.12, and 398.6±48.42, respectively (Figure 8A and 8B).
Figure 8.
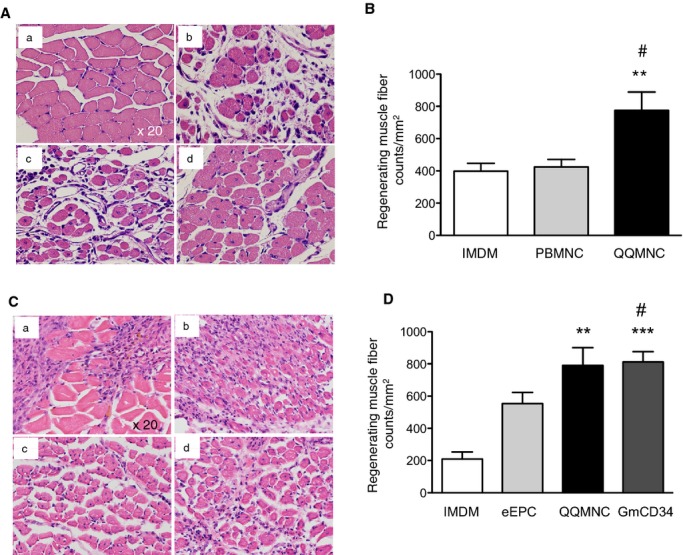
Histological evaluation of myogenesis in ischemic hindlimbs. A and C, Representative images of muscle tissues in ATM by H&E staining. (a) Normofused tissue with normal morphology of skeletal muscle fibers with the subsarcolemmal nuclei in contralateral hindlimb of IMDM control, (b) ischemic hindlimbs from IMDM control, (c) PBMNCTx, or (d) QQMNCTx in (A). (a) IMDM control, (b) eEPCTx, (c) QQMNCTx, and (d) GmCD34Tx in (C). Note that the smaller size of the fibers in combination with centrally located nuclei indicated that a muscle fiber had been actively regenerating. B and D, The graphs present the counts of regenerating muscle fibers in each group. **P<0.01; ***P<0.001 versus IMDM control in (B and D). #P<0.05 versus PBMNCTx in (B) or eEPCTx in (D). Each column in the graph represents a mean±SE. ×20 HPF. N=6 mice per group. ATM indicates anterior tibial muscle; eEPCTx, early endothelial progenitor cell transplantation; GmCD34, granulocyte colony‐stimulating factor mobilized CD34+ cell; H&E, hematoxylin and eosin; HPF, high power field; PBMNCTx, peripheral blood mononuclear cell transplantation; QQMNCTx, quality and quantity control culture of mononuclear cell transplantation.
In the respective experiments to compare myogenesis among the QQMNCTx, GmCD34Tx, eEPCTx, and control groups, we also determined that the average densities of regenerating muscle fibers (regenerating muscle fiber counts/mm2) for the respective groups were 790.7±110.1, 811.8±63.6, 553.6±69.25, and 209.4±44.01, respectively (Figure 8C and 8D). These findings indicate that QQMNCTx potentiated myogenesis greater than PBMNCTx and control, or equal to GmCD34Tx in ischemic hindlimbs, although did not compare to eEPCTx.
Inhibitory Effects of QQMNCTx to Fibrosis and Inflammation in Hindlimb Ischemia
To evaluate anti‐inflammatory and ‐fibrotic potential of QQMNCTx, fibrotic area in ischemic ATM was detected by Azan staining on day 21 after treatment. The mean fibrotic area (% fibrotic area/×40 HPF) for the QQMNCTx, PBMNCTx, and control groups were 2.78±0.61, 8.41±1.51, and 11.94±3.59. These findings indicate that QQMNCTx exerted greater antifibrotic effects than did PBMNCTx (Figure 9A and 9B).
Figure 9.
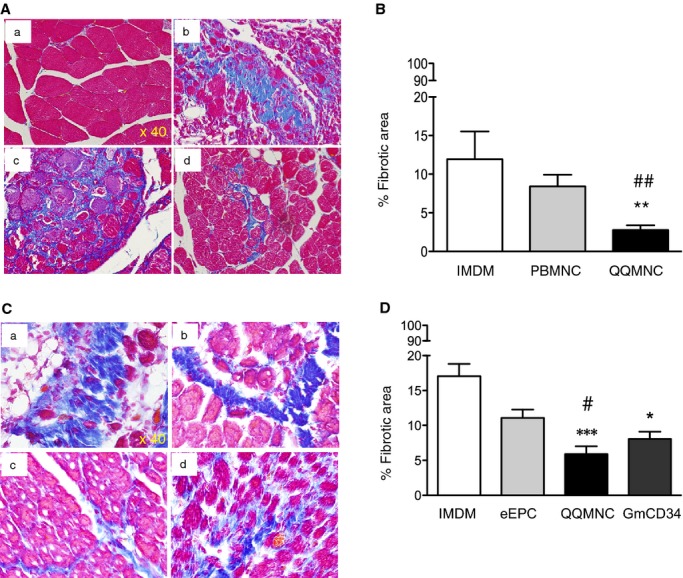
Histological evaluation of fibrosis in ischemic hindlimbs. A and C, Representative pictures of fibrosis in ATM assessed by Azan staining (blue) in each group. ×40 HPF. (a) Contralateral hindlimb of IMDM control (b, c, and d) and ischemic hindlimbs of IMDM control, PBMNCTx, and QQMNCTx in (A). (a, b, c, and d) Ischemic hindlimbs of IMDM control, eEPCTx, QQMNCTx, and GmCD34Tx in (C). B and D, The graphs show percent (%) fibrotic area in each group. *P<0.05; **P<0.01; ***P<0.001 versus IMDM control in (B and D). ##P<0.01 versus PBMNCTx in (B). #P<0.05 versus eEPCTx in (D). Each column in the graph represents a mean±SE. N=6 mice per group. ATM indicates anterior tibial muscle; eEPCTx, early endothelial progenitor cell transplantation; GmCD34, granulocyte colony‐stimulating factor mobilized CD34+ cell; HPF, high power field; PBMNCTx, peripheral blood mononuclear cell transplantation; QQMNCTx, quality and quantity control culture of mononuclear cell transplantation.
In the respective comparison among the QQMNCTx, GmCD34Tx, eEPCTx, and control groups, the mean fibrotic areas (% fibrotic area/×40 HPF) for each group were 5.89±1.12, 8.06±1.05, 11.07±1.19, and 17.04±1.75 (Figure 9C and 9D). QQMNCTx as well as GmCD34Tx featured superior antifibrotic effects to control and further exerted greater effects than eEPCTx.
We performed IHC of iNOS in ischemic ATM to assess inflammation. The mean iNOS‐expressing areas (% iNOS‐expressing area/×20 HPF) for the QQMNCTx, PBMNCTx, and control groups were 3.16±0.58, 6.26±0.89, and 21.31±2.26 (Figure 10A and 10B). These findings indicate that QQMNCTx inhibited inflammation more markedly than PBMNCTx.
Figure 10.
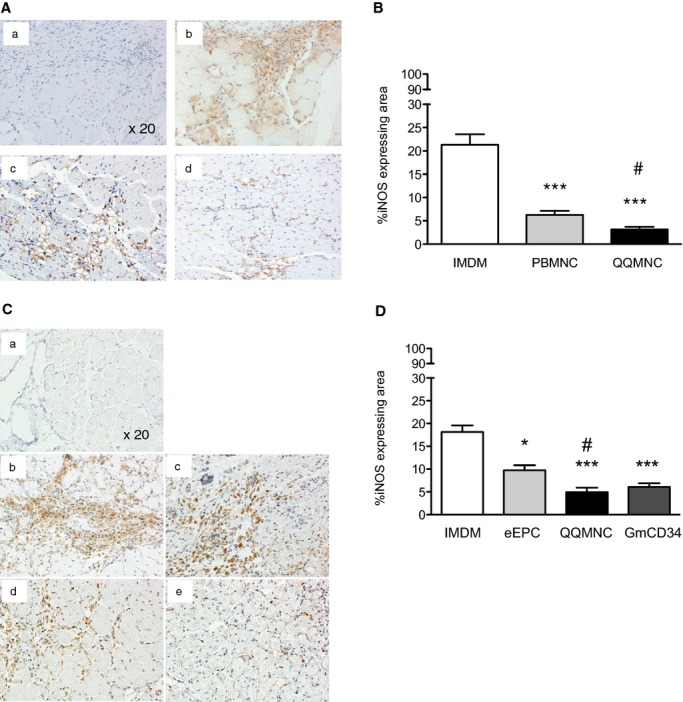
Histological evaluation of inflammation in ischemic hindlimbs. A and C, Representative pictures of inflammation in ATM by immunohistochemistry using anti‐iNOS antibody (brown color) in each group. ×20 HPF. (a) Control of rabbit polyclonal IgG, (b) IMDM control, (c) PBMNCTx, and (d) QQMNCTx in (A). (a) Control of rabbit polyclonal IgG, (b) IMDM control, (c) eEPCTx, (d) QQMNCTx, and (e) GmCD34Tx in (C). B and D, The graphs show percent (%) iNOS expressing area in each group. *P<0.05; ***P<0.001 versus IMDM control in (B and D). #P<0.05 versus PBMNCTx in (B) or eEPCTx in (D). Each graph column represents a mean±SE. N=6 mice per group. ATM indicates anterior tibial muscle; eEPCTx, early endothelial progenitor cell transplantation; GmCD34, granulocyte colony‐stimulating factor mobilized CD34+ cell; HPF, high power field; iNOS, inducible nitric oxide synthase; PBMNCTx, peripheral blood mononuclear cell transplantation; QQMNCTx, quality and quantity control culture of mononuclear cell transplantation.
In the respective comparison among the QQMNCTx, GmCD34Tx, eEPCTx, and control groups, the mean iNOS‐expressing areas (% iNOS‐expressing area/×20 HPF) for the respective groups were 4.97±0.95, 6.07±0.81, 9.75±1.09, and 18.15±1.44 (Figure 10C and 10D). In the same manner as antifibrotic aspects, QQMNCTx as well as GmCD34Tx featured superior anti‐inflammation effects to control and further displayed greater effects than eEPCTx.
These findings indicate that QQMNCTx, similarly to GmCD34Tx, potentiated protective effects against inflammation and fibrosis in the ischemic hindlimb.
QQMNCTx Enhances Gene Expression for Tissue Regeneration in Ischemic Muscle
The qRT‐PCR assay was implemented for murine mRNA transcripts encoding the following factors: IL‐1β (proangiogenic/‐inflammatory), transforming growth factor beta (TGF‐β; proangiogenic/anti‐inflammatory), IGF‐1 (proangiogenic/‐myogenic), or MyoD1 and myogenin (promyogenic transcription).
In the comparison of the murine transcripts among the QQMNCTx, PBMNCTx, and control groups, gene expression of MyoD1, myogenin, and IGF‐1 was significantly augmented by responding to QQMNCTx, but not to PBMNCTx.
Likewise, in the comparison among the QQMNCTx, GmCD34Tx, and eEPCTx groups, gene expression of MyoD1, myogenin, and IGF‐1 was significantly enhanced by responding to QQMNCTx, equally to GmCD34Tx, but not to eEPCTx.
The relative ratio of each gene expression in PBMNCTx, QQMNCTx, GmCD34Tx, and eEPCTx versus that in IMDM control was as follows: 1.22±0.05, 2.58±0.63, 2.94±0.61, and 1.06±0.08 in MyoD1; 1.90±0.10, 2.94±0.49, 2.69±0.41, and 0.84±0.06 in myogenin; and 1.17±0.11, 2.06±0.40, 2.20±0.56, and 1.00±0.11 in IGF‐1, respectively (Figure 11A and 11B).
Figure 11.

qRT‐PCR assay of murine gene expression in ischemic hindlimbs. The graphs show the relative gene expression levels of promyogenic (MyoD1, myogenin, and IGF‐1), anti‐inflammation (TGF‐β), and proangiogenic (IL‐1β) factors. The comparison of the levels in QQMNCTx to those in IMDM control or PBMNCTx in (A) and in IMDM control, eEPCTx, and GmCD34Tx in (B). H, healthy (contralateral) hindlimb of IMDM control mice. *P<0.05; **P<0.01; ***P<0.001 versus IMDM control. $P<0.0.5; $$P<0.01 versus H. #P<0.05 in (A and B). ##P<0.01; ###P<0.001 versus eEPCTx in (B). Each graph column represents a mean±SE. N=4 to 6 mice per group. eEPCTx indicates early endothelial progenitor cell transplantation; GCM, gastrocunemius muscle; GmCD34, granulocyte colony‐stimulating factor mobilized CD34+ cell; IGF, insulin‐like growth factor; IL, interleukin; PBMNCTx, peripheral blood mononuclear cell transplantation; QQMNCTx, quality and quantity control culture of mononuclear cell transplantation; qRT‐PCR, quantitative real‐time polymerase chain reaction; TGF, transforming growth factor.
The gene expression of TGF‐β was fairly promoted by responding to QQMNCTx, rather than to PBMNCTx, and also enhanced equal to or higher than that in GmCD34Tx, although not in eEPCTx. The relative ratio of TGF‐β gene expression in PBMNCTx, QQMNCTx, GmCD34Tx, and eEPCTx, control, was 3.14±0.42, 4.35±0.60, 3.52±0.36, and 0.52±0.04 (Figure 11A and 11B).
Thus, gene expressions of the potent factors for angiogenesis, myogenesis, and anti‐inflammation reacting to QQMNCTx as well as GmCD34Tx were similarly up‐regulated, when compared with those to PBMNCTx or eEPCTx.
Above all, the gene expression encoding IGF‐1 to QQMNCTx was unambiguously enhanced, compared with that to the other Tx groups of PBMNCTx and eEPCTx. The findings correspond with the histological results to show the multifunctional mechanisms of QQMNCTx as superior to those of PBMNCTx or eEPCTx.
Notably, Tx of all cell sources, more or less, up‐regulated gene expression of IL‐1β, a proinflammatory factor, whereas unpurified EPC Tx of QQMNCs as well as PBMNCs tended to produce the transcript more drastically than the purified EPC Tx of GmCD34 or eEPCs. The relative ratio of IL‐1β gene expression in QQMNCTx, GmCD34Tx, and eEPCTx versus that in IMDM control was 32.00±12.74, 10.47±2.27, and 19.53±7.78, respectively.
In the present experiments, PBMNCTx, despite the fairly high expression of IL‐1β, did not exert angiogenic ability, whereas GmCD34Tx, even in the lesser expression, did so favorably. In other words, IL‐1β production in ischemic tissue responding to any cell Tx did not seemingly contribute to angiogenesis for vascular regeneration.
Discussion
Here, we developed and characterized QQMNCs (novel therapeutic cells), QQMNCs derived from PBMNCs that were subjected to QQ culture, and this QQ culture promoted expansion of EPCs and adoption of regenerative phenotypes by macrophages and T lymphocytes. The QQ culture that we used to generate QQMNCs was based on a well‐established QQ culture that increases the quality and quantity of EPCs from enriched EPC populations, such as CD34+ and CD133+ cells; this established QQ culture was used to generate therapeutic stem cells for CV regeneration in rat infarcted myocardia.23
We found here that the vasculogenic signaling condition of this QQ culture potentiated the vascular regeneration ability of naïve PBMNCs to produce QQMNCs. QQMNCs were superior to PBMNCs, and equal to or greater than GmCD34 cells, in terms of regeneration abilities, including vascular regeneration (angiogenesis, arteriogenesis, and vasculogenesis), myogenesis, anti‐inflammation, and antifibrosis.
EPC Expansion and Differentiation in QQMNCs
EPC‐CFA of QQMNCs demonstrated intensive expansion potential of colony‐forming EPCs, especially dEPCs (Figure 1D). The concept of colony‐forming EPCs was recently introduced.12,38 pEPCs in small‐sized EPC colonies showed a higher rate of proliferation and a higher percentage of cells in S‐phase, when compared to dEPCs in large‐sized EPC colonies. In contrast, dEPCs had a significantly higher capacity for vasculogenic activity than did pEPCs; similarly, dEPCs also had a greater overall potential for cell adhesion and formation of tube‐like structures in vitro; importantly, dEPCs had a greater capacity than pEPCs to support de novo blood vessel formation in vivo after transplantation into ischemic models.
Therefore, pEPCs are defined as very immature, highly proliferative EPCs; in contrast, dEPCs are believed to derive from pEPCs and represent cells prone to differentiation and promotion of vasculogenesis. These dEPCs are proven to play a key role in vasculogenesis, and to be suitable for vascular regeneration therapy. In this regard, QQ culture promoted significant expansion and commitment of colony‐forming EPCs with vasculogenic potential.
To confirm colony‐forming EPC expansion in QQ culture of naïve PBMNCs, we evaluated EPC colony‐forming activity before and after QQ culture (Figure 1E). Total EPC‐CFU count in QQMNC samples was correlated with that in PBMNC samples. For example, pEPC‐CFU count in PBMNC samples correlated with dEPC‐CFU count and with total EPC‐CFU count in QQMNC samples, but not with pEPC‐CFU count in QQMNC samples. The dEPC‐CFU count in PBMNC samples did not correlate to any EPC‐CFU count in QQMNC samples. These data indicate that signals in QQ culture probably induced concurrent expansion and differentiation of pEPC‐CFCs, resulting in an increase in the dEPC‐CFC population instead of the pEPC‐CFC population. Consequently, the enhanced vasculogenic potential of post QQ culture‐treated cells, compared with the precursor PBMNCs, explained the preferential vascular regeneration.
Cell Populations in QQ Cultures
The cell numbers of QQMNCs were, on average, approximately half of those in the respective PBMNCs. The cellular density of PBMNCs per blood volume is inversely correlated with the ratio of cellular density per well between PBMNCs and QQMNCs. Therefore, the QQMNC numbers are rather dependent on the original blood volume per se (Figure 1B).
From the view of cell populations, the decrease in total cell count is mainly derived from significant reduction of B lymphocytes (CD19+), NK cells (CD16+ and CD56+), cytotoxic T cells (CD8+), and proinflammatory monocytes and macrophages (CD14+ and CCR2+). In contrast, populations of progenitor cells (CD34+ and CD133+) and of anti‐inflammatory monocytes and macrophages (CD206+) expanded greatly, but populations of endothelial cells (CD105+ and CD146+) and helper T cells (CD4+) expanded only moderately.
The increase in CD34+ or CD133+ cell populations indicates the expanded population of immature EPCs. The increase in CD105+ or CD146+ cell populations was also indicative of EPC expansion and differentiation; notably, differentiating EPCs express these markers.39–40
The extent of the increase in CD206+ cells and of the decrease in CCR2+ cells indicates the conversion of the monocyte/macrophage phenotype from M1 to M2 type. Monocytes/macrophages differentiate toward a proinflammatory, classically activated M1 state or toward an anti‐inflammatory, alternatively activated M2 state according to different environments and stimuli. M1 macrophages are induced by proinflammatory cytokines and microbial products, such as INF‐γ, tumor necrosis factor alpha (TNF‐α), and lipopolysaccharide; these macrophages are mainly associated with pathologic inflammations. M2 macrophages are induced by anti‐inflammatory cytokines, such as IL‐4, IL‐13, and IL‐10, to ameliorate type 1 inflammatory responses and control adaptive immunity. Furthermore, their anti‐inflammatory cytokines promote and regulate type 2 immune responses, angiogenesis, and tissue repair.41
In this regard, monocyte/macrophages in QQMNCs mainly adopt angiogenic and anti‐inflammatory phenotypes and are contributing to regenerative process in ischemic organs.
Among lymphocyte lineage cells, B lymphocytes, NK cells, and cytotoxic T cells significantly decrease or fade away. Instead, helper T cells are the last surviving lymphocyte population in QQ cultures. The phenotype identification of CD4+ cells disclosed the significant increase in CD4+/CD25+/Foxp3+ regulatory T lymphocytes as well as CD4+/IL‐4+ Th2 lymphocytes. In recent years, the interaction between monocytes/macrophages and T lymphocytes has been investigated. IFN‐γ produced by Th1 lymphocytes induce monocytes to become classical activated M1 macrophages, whereas IL‐4, IL‐13, and IL‐10 that are produced by Th2 and regulatory T lymphocytes induce differentiation of regenerative M2 macrophages. IL‐12 and IL‐6 produced by M1 macrophages activate Th1 lymphocytes, whereas IL‐10 and TGF‐β produced by M2 macrophages encourage Th2 and regulatory T‐lymphocyte functions.41–42
Therefore, the cell‐cell interactions among M2 macrophages, Th2, and regulatory T cells are considered to accelerate QQMNCs function as angiogenic and anti‐inflammatory tools.
Of note, the majority of T lymphocytes in QQ cultures are CXCR4+/CD31+/CD3+ cells. This population is called “angiogenic T cells” in the vascular biology field; these T cells deliver proangiogenic cytokines in tissues for neovascularization.30 The finding also encourages that the phenotype of T lymphocytes is conducible to angiogenic preference of QQMNCs.
Therefore, QQMNCs signal regenerative switches on PBMNCs not only by EPC expansion and differentiation, but also through collaborative M2 macrophage polarization and Th2 and regulatory T‐cell activation in QQ culture.
Cross‐Talk of Cell Populations in QQMNCs
The finding shown in Figure 1F indicates that CD34+ cell‐depleted PBMNCs included some cell population to accelerate EPC expansion and differentiation in CD34+ cells through QQ culture. As demonstrated in Figure 2C and 2D, EPCs, M2 macrophage, Th2, and regulatory T lymphocytes were mainly activated in QQMNCs. Increasingly, researches are focused on the interaction between macrophages and T lymphocytes to elucidate the collaborative mechanism of inflammation and immunity. Although we do not have any evidence to indicate that EPCs are involved in this collaboration, the developed culture for EPC expansion, QQ culture, regulates phenotypes of macrophages and T lymphocytes and, consequently, exerts EPC expansion and differentiation. Therefore, any cellular or molecular mechanism responsible for the effects of CD34+ cell‐depleted PBMNCs needs to be identified in the future for scientific and therapeutic interests.
Factors Expressed From QQMNCs
In order to further examine the vasculogenic potential of QQMNCs, qRT‐PCR was used to determine gene expression profiles. In QQMNCs, the expression of mRNAs encoding anti‐inflammatory and proangiogenic factors was enhanced, whereas that of mRNAs encoding proinflammatory cytokines declined (Figure 3).
Expression of mRNAs encoding proangiogenic cytokines and growth factors (eg, IL‐10,43 leptin,44–45 IGF‐1,46 and IL‐847) was greatly elevated. Leptin45 and IL‐1048 promote the vasculogenic and angiogenic potentials of EPCs and ECs. IGF‐149 and IL‐850 are also related factors responsible for angiogenic properties of EPCs. Furthermore, IGF‐1 promotes muscle fiber regeneration35; this phenomenon may be reflected in the findings of enhanced myogenesis after QQMNCTx. VEGF‐B and Angn‐1 were up‐regulated in QQMNCs, and they potentiate vascular survival and maturation relating to arteriogenesis induced by pericyte recruitment.33–34 However, expression of mRNA encoding VEGF‐A, one of the main proangiogenic growth factors, was not elevated, but rather reduced in QQMNCs, relative to PBMNCs. The reduction of VEGF‐A expression might be explained by a negative feedback mechanism through high dose of VEGF‐A protein in QQ culture conditioning.
In contrast, expression of mRNA encoding TGF‐β, one of the potent anti‐inflammatory factors, was lower in QQMNCs. However, expression of mRNAs encoding TNF‐α and IL‐1β, the important proinflammatory mediators, was similarly mitigated between QQMNCs and PBMNCs for TNF‐α while prominently down‐regulated in QQMNCs and in PBMNCs for IL‐1β.
The findings indicate that QQMNCs may not, at least, bring proinflammatory cell populations more than PBMNCs.
Moreover, the expression of mRNAs encoding MMP‐2 or ‐9, which, playing a critical role in neovascularization and tissue remodeling for antifibrosis,36 were highly up‐regulated.
Taken together, QQMNCTx, compared to PBMNCTx, resulted in more favorable conditions for vascular regeneration or tissue repair because of the orchestration of dynamic expression of multiple cytokines and growth factors.
Therapeutic Potential of QQMNCs for Hindlimb Ischemia Models
QQMNCs have therapeutic potential because transplantation of the cells into ischemic hindlimb tissue was associated with increased blood flow, limb survival, and neovascularization in tissues (Figure 5). Moreover, histological findings indicate that transplanted human QQMNCs contributed to new microvessel formation composed of human cells derived from EPCs in QQMNCs, as well as mouse microvessel formation and arteriogenesis supported by pericytes (Figures 6 and 7). The latter effects were presumably the result of angiogenic paracrine effects by accelerated phenotypes of macrophages and T lymphocytes as well as EPCs.
The other categorical finding of this transplantation treatment was decreased fibrosis and inflammation as well as enhanced myogenesis (Figures 8,8 through 10). As indicated by cell population study and gene expression analyses, QQMNCs included many anti‐inflammatory M2 macrophages; the cells had enhanced expression of the anti‐inflammatory cytokine, IL‐10, and the anti‐fibrotic proteases, MMP‐2 and ‐9, as well as decreased expression of the proinflammatory cytokine, IL‐1β. This anti‐inflammatory effect by QQMNCs conceivably protected against fibrosis, even in severe ischemic muscles. Moreover, skeletal myogenesis was also augmented by transplantation of QQMNCs with enhanced expression of mRNA encoding IGF‐1.
Thus, we demonstrated that transplanted QQMNCs per se provide the favorable microenvironment for injured tissue regeneration by exerting vascularization as well as anti‐inflammatory and myogenic effects.
As recently reported,7 autologous PBMNCs isolated by apheresis and then transplanted into patients had vascular therapeutic potential, when the largest cell dose (over 1×10¹⁰ cells of human subject) was implanted. Here, we transplanted only 1×10⁴ cells (PBMNCs and/or QQMNCs) per mouse subject; this dose corresponds to ≈2.0 to 2.5×10⁷ cells in a human subject of 50 kg body weight. We implanted far fewer cells than are generally used for clinical treatments. Therefore, the effect of PBMNCs on ischemic hindlimbs was minimal, whereas QQMNCTx had extensive therapeutic effects on vascular regeneration and tissue repair.
On the other hand, the cell dose of 1×10⁴ cells per mouse subject also corresponds to that used at transplantation of G‐CSF‐mobilized CD34+ cells in patients with critical limb ischemia.17,19 Of note, in the present study, QQMNCTx exerted the experimental efficacy equal to or in part greater than that of GmCD34Tx.
The count of transplanted QQMNCs (1×10⁴ cells/mouse) for therapeutic activity of tissue regeneration corresponds to cell quantity, on average, acquired from <100 mL of PB of human subjects. The isolation and preparation of QQMNCs require only the MNC isolation and a week culture in QQ culture conditions that included recombinant factors without any manipulation. Furthermore, the process avoids invasive procedures for isolation, such as BM cell isolation or leukapheresis, and expensive costs for mobilization and target cell isolation, such as G‐CSF administration or CD34+/CD133+ cell isolation using magnetic beads.
Collectively, the QQMNC is expected to be an advantageous and feasible cell source for cell‐based therapy targeting ischemic diseases.
Responsive Mechanism in Ischemic Hindlimb for Tissue Regeneration After QQMNCTx
Histochemistry (Figures 8 through 10) and qRT‐PCR assay (Figure 11) demonstrated that QQMNCTx, as well as GmCD34Tx, provides the preferential environment for tissue regeneration of myogenesis, antifibrosis, and anti‐inflammation in the ischemic hindlimb.
With respect to qRT‐PCR assay, IL‐1β, a proinflammatory cytokine, has been reported to function as a proangiogenic factor derived from regenerating myoblasts responding to PBMNC implantation in the ischemic hindlimb.51 In the present study, implantation of PBMNCs highly induced the expression of mRNA encoding IL‐1β in ischemic tissue, similarly to that of QQMNCs, whereas it did not demonstrate great angiogenic potential. The causes of the dissimilar response might be presumably attributed to the distinct animal experiments using different murine strains with various cell doses for transplantation: immunodeficient BALB/c nu/nu nude mice (1×10⁴ cells/mouse) in our study and C57BL/6 mice (1×10⁶ cells/mouse) elsewhere.51
Notably, QQMNCTx, similarly to GmCD34Tx, up‐regulated the gene expression of mRNAs encoding promyogenic factors of IGF‐1,52 MyoD1, and myogenin in the ischemic hindlimb; Tx of those cell types induced preferential myogenesis, unlike Tx of the other cell candidates, in histological evaluation.
This means that the effective myogenesis by cell transplantation may primarily require in situ IGF‐1 production, which also signifies a myogenic biomarker in the ischemic hindlimb. Regarding the results, skeletal muscle‐restricted expression of IGF‐1 in transgenic mice has been reported to not only accelerate muscle regeneration, but also to exert the protective effects against inflammation and fibrosis in the injured skeletal muscle.53 Moreover, IGF‐1 has been reported to inhibit nuclear factor kappa B activation through TNF‐α54 or proapoptotic miRNA expression55 in ischemic cardiomyocytes. Therefore, IGF‐1 supplied to ischemic tissue by local QQMNCTx is adequately conceived to exert the protective effect on inflammation, fibrosis, or tissue injury. Also, QQMNCs per se exhibited enhanced expression of mRNA encoding human IGF‐1 (Figure 3A).
Likewise, QQMNCTx, as well as GmCD34Tx, up‐regulated expression of mRNA encoding TGF‐β, a potent inhibitory factor of inflammation, in transplanted tissue, although QQMNC in vitro exhibited lesser expression than PBMNCs. Unlike the aspect of IGF‐1, the responsive tissue expression in situ of TGF‐β after cell transplantations, might contribute to protecting against inflammation, rather than the expression by the transplanted cells.
Take together, expression of IGF‐1 or TGF‐β by injured tissue responsive to QQMNCTx, as well as that of IGF‐1 and other tissue regeneration mediators by the transplanted cells per se, are expected to reveal the mechanism underlying the preferential efficacy of cell Tx.
Limitation of the Present Study
In the present study, recipients' T‐lymphocyte‐deficient condition in athymic BALB/c nu/nu nude mice limits the insight into regeneration mechanism by regulatory effects on host immune response through regulatory T cells increased in QQMNCs. Therefore, the relevant animal model studies are required to elucidate the essential effect of QQMNCTx in future experiments.
Conclusion
The QQ culture system for whole PBMNCs that we described here may lead to an effective cell‐based therapy to alleviate the physical burdens in patients as one feasible strategy for vascular regeneration or tissue repair.
Sources of Funding
This work was supported by grants from the Riken Center for Developmental Biology Collaborative Research Fund, Kobe (08001475), Japan, the Ministry of Health, Labor and Welfare (25280401), Japan, and the Ministry of Education, Culture, Sports, Science and Technology (Academic Frontier Promotion Program), Japan. H.M. is personally supported by the Ministry of Education, Culture, Sports, Science and Technology (Basic Research Grant No. 25461091), Japan, Tokai University School of Medicine Research Aid, and Research and Study Project of Tokai University Education System General Research Organization, Japan.
Disclosures
None.
Acknowledgments
The authors thank the staves of Teaching and Research Support Core Center of Tokai University School of Medicine for outstanding technical support as well as Sachie Ota for her secretarial assistance.
References
- 1.Asahara T, Murohara T, Sullivan A, Silver M, van der Zee R, Li T, Witzenbichler B, Schatteman G, Isner JM. Isolation of putative progenitor endothelial cells for angiogenesis. Science. 1997; 275:964-967. [DOI] [PubMed] [Google Scholar]
- 2.Shi Q, Rafii S, Wu MH, Wijelath ES, Yu C, Ishida A, Fujita Y, Kothari S, Mohle R, Sauvage LR, Moore MA, Storb RF, Hammond WP. Evidence for circulating bone marrow‐derived endothelial cells. Blood. 1998; 92:362-367. [PubMed] [Google Scholar]
- 3.Asahara T, Masuda H, Takahashi T, Kalka C, Pastore C, Silver M, Kearne M, Magner M, Isner JM. Bone marrow origin of endothelial progenitor cells responsible for postnatal vasculogenesis in physiological and pathological neovascularization. Circ Res. 1999; 85:221-228. [DOI] [PubMed] [Google Scholar]
- 4.Tateishi‐Yuyama E, Matsubara H, Murohara T, Ikeda U, Shintani S, Masaki H, Amano K, Kishimoto Y, Yoshimoto K, Akashi H, Shimada K, Iwasaka T, Imaizumi TTherapeutic Angiogenesis using Cell Transplantation Study I. Therapeutic angiogenesis for patients with limb ischaemia by autologous transplantation of bone‐marrow cells: a pilot study and a randomised controlled trial. Lancet. 2002; 360:427-435. [DOI] [PubMed] [Google Scholar]
- 5.Assmus B, Schachinger V, Teupe C, Britten M, Lehmann R, Dobert N, Grunwald F, Aicher A, Urbich C, Martin H, Hoelzer D, Dimmeler S, Zeiher AM. Transplantation of progenitor cells and regeneration enhancement in acute myocardial infarction (TOPCARE‐AMI). Circulation. 2002; 106:3009-3017. [DOI] [PubMed] [Google Scholar]
- 6.Schachinger V, Tonn T, Dimmeler S, Zeiher AM. Bone‐marrow‐derived progenitor cell therapy in need of proof of concept: design of the REPAIR‐AMI trial. Nat Clin Pract Cardiovasc Med. 2006; 3suppl 1:S23-S28. [DOI] [PubMed] [Google Scholar]
- 7.Moriya J, Minamino T, Tateno K, Shimizu N, Kuwabara Y, Sato Y, Saito Y, Komuro I. Long‐term outcome of therapeutic neovascularization using peripheral blood mononuclear cells for limb ischemia. Circ Cardiovasc Interv. 2009; 2:245-254. [DOI] [PubMed] [Google Scholar]
- 8.Yoon YS, Park JS, Tkebuchava T, Luedeman C, Losordo DW. Unexpected severe calcification after transplantation of bone marrow cells in acute myocardial infarction. Circulation. 2004; 109:3154-3157. [DOI] [PubMed] [Google Scholar]
- 9.Lunde K, Solheim S, Aakhus S, Arnesen H, Abdelnoor M, Egeland T, Endresen K, Ilebekk A, Mangschau A, Fjeld JG, Smith HJ, Taraldsrud E, Grogaard HK, Bjornerheim R, Brekke M, Muller C, Hopp E, Ragnarsson A, Brinchmann JE, Forfang K. Intracoronary injection of mononuclear bone marrow cells in acute myocardial infarction. N Engl J Med. 2006; 355:1199-1209. [DOI] [PubMed] [Google Scholar]
- 10.Miyamoto K, Nishigami K, Nagaya N, Akutsu K, Chiku M, Kamei M, Soma T, Miyata S, Higashi M, Tanaka R, Nakatani T, Nonogi H, Takeshita S. Unblinded pilot study of autologous transplantation of bone marrow mononuclear cells in patients with thromboangiitis obliterans. Circulation. 2006; 114:2679-2684. [DOI] [PubMed] [Google Scholar]
- 11.Moazzami K, Majdzadeh R, Nedjat S. Local intramuscular transplantation of autologous mononuclear cells for critical lower limb ischaemia. Cochrane Database Syst Rev. 2011; 12:CD008347. [DOI] [PubMed] [Google Scholar]
- 12.Masuda H, Alev C, Akimaru H, Ito R, Shizuno T, Kobori M, Horii M, Ishihara T, Isobe K, Isozaki M, Itoh J, Itoh Y, Okada Y, McIntyre BA, Kato S, Asahara T. Methodological development of a clonogenic assay to determine endothelial progenitor cell potential. Circ Res. 2011; 109:20-37. [DOI] [PubMed] [Google Scholar]
- 13.Mosser DM, Edwards JP. Exploring the full spectrum of macrophage activation. Nat Rev Immunol. 2008; 8:958-969. [DOI] [PMC free article] [PubMed] [Google Scholar]
- 14.Mosser DM, Zhang X. Interleukin‐10: new perspectives on an old cytokine. Immunol Rev. 2008; 226:205-218. [DOI] [PMC free article] [PubMed] [Google Scholar]
- 15.Bartunek J, Vanderheyden M, Vandekerckhove B, Mansour S, De Bruyne B, De Bondt P, Van Haute I, Lootens N, Heyndrickx G, Wijns W. Intracoronary injection of CD133‐positive enriched bone marrow progenitor cells promotes cardiac recovery after recenyocardial infarction: feasibility and safety. Circulation. 2005; 112:I178-I183. [DOI] [PubMed] [Google Scholar]
- 16.Losordo DW, Schatz RA, White CJ, Udelson JE, Veereshwarayya V, Durgin M, Poh KK, Weinstein R, Kearney M, Chaudhry M, Burg A, Eaton L, Heyd L, Thorne T, Shturman L, Hoffmeister P, Story K, Zak V, Dowling D, Traverse JH, Olson RE, Flanagan J, Sodano D, Murayama T, Kawamoto A, Kusano KF, Wollins J, Welt F, Shah P, Soukas P, Asahara T, Henry TD. Intramyocardial transplantation of autologous CD34+ stem cells for intractable angina: a phase I/IIa double‐blind, randomized controlled trial. Circulation. 2007; 115:3165-3172. [DOI] [PubMed] [Google Scholar]
- 17.Kawamoto A, Katayama M, Handa N, Kinoshita M, Takano H, Horii M, Sadamoto K, Yokoyama A, Yamanaka T, Onodera R, Kuroda A, Baba R, Kaneko Y, Tsukie T, Kurimoto Y, Okada Y, Kihara Y, Morioka S, Fukushima M, Asahara T. Intramuscular transplantation of G‐CSF‐mobilized CD34(+) cells in patients with critical limb ischemia: a phase I/IIa, multicenter, single‐blinded, dose‐escalation clinical trial. Stem Cells. 2009; 27:2857-2864. [DOI] [PubMed] [Google Scholar]
- 18.Losordo DW, Henry TD, Davidson C, Sup Lee J, Costa MA, Bass T, Mendelsohn F, Fortuin FD, Pepine CJ, Traverse JH, Amrani D, Ewenstein BM, Riedel N, Story K, Barker K, Povsic TJ, Harrington RA, Schatz RAInvestigators AC. Intramyocardial, autologous CD34+ cell therapy for refractory angina. Circ Res. 2011; 109:428-436. [DOI] [PMC free article] [PubMed] [Google Scholar]
- 19.Kinoshita M, Fujita Y, Katayama M, Baba R, Shibakawa M, Yoshikawa K, Katakami N, Furukawa Y, Tsukie T, Nagano T, Kurimoto Y, Yamasaki K, Handa N, Okada Y, Kuronaka K, Nagata Y, Matsubara Y, Fukushima M, Asahara T, Kawamoto A. Long‐term clinical outcome after intramuscular transplantation of granulocyte colony stimulating factor‐mobilized CD34 positive cells in patients with critical limb ischemia. Atherosclerosis. 2012; 224:440-445. [DOI] [PubMed] [Google Scholar]
- 20.Scheubel RJ, Zorn H, Silber RE, Kuss O, Morawietz H, Holtz J, Simm A. Age‐dependent depression in circulating endothelial progenitor cells in patients undergoing coronary artery bypass grafting. J Am Coll Cardiol. 2003; 42:2073-2080. [DOI] [PubMed] [Google Scholar]
- 21.Vasa M, Fichtlscherer S, Aicher A, Adler K, Urbich C, Martin H, Zeiher AM, Dimmeler S. Number and migratory activity of circulating endothelial progenitor cells inversely correlate with risk factors for coronary artery disease. Circ Res. 2001; 89:E1-E7. [DOI] [PubMed] [Google Scholar]
- 22.Hill JM, Zalos G, Halcox JP, Schenke WH, Waclawiw MA, Quyyumi AA, Finkel T. Circulating endothelial progenitor cells, vascular function, and cardiovascular risk. N Engl J Med. 2003; 348:593-600. [DOI] [PubMed] [Google Scholar]
- 23.Masuda H, Iwasaki H, Kawamoto A, Akimaru H, Ishikawa M, Ii M, Shizuno T, Sato A, Ito R, Horii M, Ishida H, Kato S, Asahara T. Development of serum‐free quality and quantity control culture of colony‐forming endothelial progenitor cell for vasculogenesis. Stem Cells Transl Med. 2012; 1:160-171. [DOI] [PMC free article] [PubMed] [Google Scholar]
- 24.Kalka C, Masuda H, Takahashi T, Kalka‐Moll WM, Silver M, Kearney M, Li T, Isner JM, Asahara T. Transplantation of ex vivo expanded endothelial progenitor cells for therapeutic neovascularization. Proc Natl Acad Sci USA. 2000; 97:3422-3427. [DOI] [PMC free article] [PubMed] [Google Scholar]
- 25.Hur J, Yoon CH, Kim HS, Choi JH, Kang HJ, Hwang KK, Oh BH, Lee MM, Park YB. Characterization of two types of endothelial progenitor cells and their different contributions to neovasculogenesis. Arterioscler Thromb Vasc Biol. 2004; 24:288-293. [DOI] [PubMed] [Google Scholar]
- 26.Sasaki K, Heeschen C, Aicher A, Ziebart T, Honold J, Urbich C, Rossig L, Koehl U, Koyanagi M, Mohamed A, Brandes RP, Martin H, Zeiher AM, Dimmeler S. Ex vivo pretreaent of bone marrow mononuclear cells with endothelial NO synthase enhancer AVE9488 enhances their functional activity for cell therapy. Proc Natl Acad Sci USA. 2006; 103:14537-14541. [DOI] [PMC free article] [PubMed] [Google Scholar]
- 27.Pesce M, Orlandi A, Iachininoto MG, Straino S, Torella AR, Rizzuti V, Pompilio G, Bonanno G, Scambia G, Capogrossi MC. Myoendothelial differentiation of human umbilical cord blood‐derived stem cells in ischemic limb tissues. Circ Res. 2003; 93:e51-e62. [DOI] [PubMed] [Google Scholar]
- 28.Napoli C, Williams‐Ignarro S, de Nigris F, de Rosa G, Lerman LO, Farzati B, Matarazzo A, Sica G, Botti C, Fiore A, Byrns RE, Sumi D, Sica V, Ignarro LJ. Beneficial effects of concurrent autologous bone marrow cell therapy and metabolic intervention in ischemia‐induced angiogenesis in the mouse hindlimb. Proc Natl Acad Sci USA. 2005; 102:17202-17206. [DOI] [PMC free article] [PubMed] [Google Scholar]
- 29.Sica V, Williams‐Ignarro S, de Nigris F, D'Armiento FP, Lerman LO, Balestrieri ML, Maione C, Palagiano A, Rossiello L, Ignarro LJ, Napoli C. Autologous bone marrow cell therapy and metabolic intervention in ischemia‐induced angiogenesis in the diabetic mouse hindlimb. Cell Cycle. 2006; 5:2903-2908. [DOI] [PubMed] [Google Scholar]
- 30.Hur J, Yang HM, Yoon CH, Lee CS, Park KW, Kim JH, Kim TY, Kim JY, Kang HJ, Chae IH, Oh BH, Park YB, Kim HS. Identification of a novel role of T cells in postnatal vasculogenesis: characterization of endothelial progenitor cell colonies. Circulation. 2007; 116:1671-1682. [DOI] [PubMed] [Google Scholar]
- 31.Fadini GP, Albiero M, Boscaro E, Menegazzo L, Cabrelle A, Piliego T, Federici M, Agostini C, Avogaro A. Rosuvastatin stimulates clonogenic potential and anti‐inflammatory properties of endothelial progenitor cells. Cell Biol Int. 2010; 34:709-715. [DOI] [PubMed] [Google Scholar]
- 32.Sica A, Larghi P, Mancino A, Rubino L, Porta C, Totaro MG, Rimoldi M, Biswas SK, Allavena P, Mantovani A. Macrophage polarization in tumour progression. Semin Cancer Biol. 2008; 18:349-355. [DOI] [PubMed] [Google Scholar]
- 33.Zhang F, Tang Z, Hou X, Lennartsson J, Li Y, Koch AW, Scotney P, Lee C, Arjunan P, Dong L, Kumar A, Rissanen TT, Wang B, Nagai N, Fons P, Fariss R, Zhang Y, Wawrousek E, Tansey G, Raber J, Fong GH, Ding H, Greenberg DA, Becker KG, Herbert JM, Nash A, Yla‐Herttuala S, Cao Y, Watts RJ, Li X. VEGF‐B is dispensable for blood vessel growth but critical for their survival, and VEGF‐B targeting inhibits pathological angiogenesis. Proc Natl Acad Sci USA. 2009; 106:6152-6157. [DOI] [PMC free article] [PubMed] [Google Scholar]
- 34.Gluzman Z, Koren B, Preis M, Cohen T, Tsaba A, Cosset FL, Shofti R, Lewis BS, Virmani R, Flugelman MY. Endothelial cells are activated by angiopoeitin‐1 gene transfer and produce coordinated sprouting in vitro and arteriogenesis in vivo. Biochem Biophys Res Commun. 2007; 359:263-268. [DOI] [PubMed] [Google Scholar]
- 35.Borselli C, Storrie H, Benesch‐Lee F, Shvartsman D, Cezar C, Lichan JW, Vandenburgh HH, Mooney DJ. Functional muscle regeneration with combined delivery of angiogenesis and myogenesis factors. Proc Natl Acad Sci USA. 2010; 107:3287-3292. [DOI] [PMC free article] [PubMed] [Google Scholar]
- 36.Johnson C, Sung HJ, Lessner SM, Fini ME, Galis ZS. Matrix metalloproteinase‐9 is required for adequate angiogenic revascularization of ischemic tissues: potential role in capillary branching. Circ Res. 2004; 94:262-268. [DOI] [PMC free article] [PubMed] [Google Scholar]
- 37.Shao H, Tan Y, Eton D, Yang Z, Uberti MG, Li S, Schulick A, Yu H. Statin and stromal cell‐derived factor‐1 additively promote angiogenesis by enhancement of progenitor cells incorporation into new vessels. Stem Cells. 2008; 26:1376-1384. [DOI] [PubMed] [Google Scholar]
- 38.Tsukada S, Kwon SM, Matsuda T, Jung SY, Lee JH, Lee SH, Masuda H, Asahara T. Identification of mouse colony‐forming endothelial progenitor cells for postnatal neovascularization: a novel insight highlighted by new mouse colony‐forming assay. Stem Cell Res Ther. 2013; 4:20. [DOI] [PMC free article] [PubMed] [Google Scholar]
- 39.Rohde E, Malischnik C, Thaler D, Maierhofer T, Linkesch W, Lanzer G, Guelly C, Strunk D. Blood monocytes mimic endothelial progenitor cells. Stem Cells. 2006; 24:357-367. [DOI] [PubMed] [Google Scholar]
- 40.Delorme B, Basire A, Gentile C, Sabatier F, Monsonis F, Desouches C, Blot‐Chabaud M, Uzan G, Sampol J, Dignat‐George F. Presence of endothelial progenitor cells, distinct from mature endothelial cells, within human CD146+ blood cells. Thromb Haemost. 2005; 94:1270-1279. [DOI] [PubMed] [Google Scholar]
- 41.Mosser DM, Zhang X. Activation of murine macrophages. Curr Protoc Immunol. 2008 [DOI] [PMC free article] [PubMed] [Google Scholar]
- 42.Liu G, Yang H. Modulation of macrophage activation and programming in immunity. J Cell Physiol. 2013; 228:502-512. [DOI] [PubMed] [Google Scholar]
- 43.Dace DS, Khan AA, Kelly J, Apte RS. Interleukin‐10 promotes pathological angiogenesis by regulating macrophage response to hypoxia during development. PLoS One. 2008; 3:e3381. [DOI] [PMC free article] [PubMed] [Google Scholar]
- 44.Goetze S, Bungenstock A, Czupalla C, Eilers F, Stawowy P, Kintscher U, Spencer‐Hansch C, Graf K, Nurnberg B, Law RE, Fleck E, Grafe M. Leptin induces endothelial cell migration through Akt, which is inhibited by PPARgamma‐ligands. Hypertension. 2002; 40:748-754. [DOI] [PubMed] [Google Scholar]
- 45.Heida NM, Leifheit‐Nestler M, Schroeter MR, Muller JP, Cheng IF, Henkel S, Limbourg A, Limbourg FP, Alves F, Quigley JP, Ruggeri ZM, Hasenfuss G, Konstantinides S, Schafer K. Leptin enhances the potency of circulating angiogenic cells via src kinase and integrin (alpha)vbeta5: implications for angiogenesis in human obesity. Arterioscler Thromb Vasc Biol. 2010; 30:200-206. [DOI] [PMC free article] [PubMed] [Google Scholar]
- 46.Rabinovsky ED, Draghia‐Akli R. Insulin‐like growth factor I plasmid therapy promotes in vivo angiogenesis. Mol Ther. 2004; 9:46-55. [DOI] [PubMed] [Google Scholar]
- 47.Schomig K, Busch G, Steppich B, Sepp D, Kaufmann J, Stein A, Schomig A, Ott I. Interleukin‐8 is associated with circulating CD133+ progenitor cells in acute myocardial infarction. Eur Heart J. 2006; 27:1032-1037. [DOI] [PubMed] [Google Scholar]
- 48.Krishnamurthy P, Thal M, Verma S, Hoxha E, Lambers E, Ramirez V, Qin G, Losordo D, Kishore R. Interleukin‐10 deficiency impairs bone marrow‐derived endothelial progenitor cell survival and function in ischemic myocardium. Circ Res. 2011; 109:1280-1289. [DOI] [PMC free article] [PubMed] [Google Scholar]
- 49.Hynes B, Kumar AH, O'Sullivan J, Klein Buneker C, Leblond AL, Weiss S, Schmeckpeper J, Martin K, Caplice NM. Potent endothelial progenitor cell‐conditioned media‐related anti‐apoptotic, cardiotrophic, and pro‐angiogenic effects posyocardial infarction are mediated by insulin‐like growth factor‐1. Eur Heart J. 2013; 34:782-789. [DOI] [PubMed] [Google Scholar]
- 50.Medina RJ, O'Neill CL, O'Doherty TM, Knott H, Guduric‐Fuchs J, Gardiner TA, Stitt AW. Myeloid angiogenic cells act as alternative M2 macrophages and modulate angiogenesis through interleukin‐8. Mol Med. 2011; 17:1045-1055. [DOI] [PMC free article] [PubMed] [Google Scholar]
- 51.Tateno K, Minamino T, Toko H, Akazawa H, Shimizu N, Takeda S, Kunieda T, Miyauchi H, Oyama T, Matsuura K, Nishi J, Kobayashi Y, Nagai T, Kuwabara Y, Iwakura Y, Nomura F, Saito Y, Komuro I. Critical roles of muscle‐secreted angiogenic factors in therapeutic neovascularization. Circ Res. 2006; 98:1194-1202. [DOI] [PubMed] [Google Scholar]
- 52.Musaro A, McCullagh K, Paul A, Houghton L, Dobrowolny G, Molinaro M, Barton ER, Sweeney HL, Rosenthal N. Localized IGF‐1 transgene expression sustains hypertrophy and regeneration in senescent skeletal muscle. Nat Genet. 2001; 27:195-200. [DOI] [PubMed] [Google Scholar]
- 53.Pelosi L, Giacinti C, Nardis C, Borsellino G, Rizzuto E, Nicoletti C, Wannenes F, Battistini L, Rosenthal N, Molinaro M, Musaro A. Local expression of IGF‐1 accelerates muscle regeneration by rapidly modulating inflammatory cytokines and chemokines. FASEB J. 2007; 21:1393-1402. [DOI] [PubMed] [Google Scholar]
- 54.Wang M, Tsai B, Brown JW, Meldrum DR. Insulin‐like growth factor‐1 in myocardial tissue: interaction with tumor necrosis factor. Crit Care. 2003; 7:417-419. [DOI] [PMC free article] [PubMed] [Google Scholar]
- 55.Iekushi K, Seeger F, Assmus B, Zeiher AM, Dimmeler S. Regulation of cardiac microRNAs by bone marrow mononuclear cell therapy in myocardial infarction. Circulation. 2012; 125:1765-1773. [DOI] [PubMed] [Google Scholar]