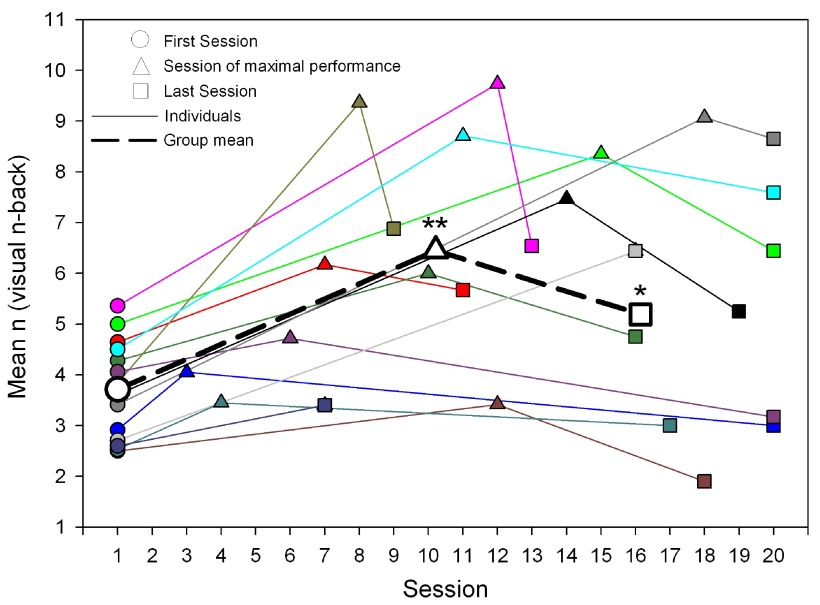
Figure 2. Individual training performance (first session, session of maximal performance, last session).
Individual training performance (first session, session of maximal performance, last session) is shown. Each solid line represents the performance of an individual (N = 14) in the visuospatial n-back (VNB) task training mean n of VNB at the first training session (circle), at the session of maximal performance (triangle) and at the last training session (square). The dashed line represents the average performance at the first session, the session of maximal performance and the performance at the last session. Average maximal performance was reached between session 10 and 11 (mean 10.21 ± SEM 1.22) and average performance at the last session was reached between session 16 and 17 (16.14 ± 1.19). ** indicates: performance at session of maximal performance was significantly higher than performance at the first and the last training session. * indicates: performance at the last session was significantly higher than at the first session.

