F1000Research logoLink to F1000Research
. 2014 Dec 12;3:304. [Version 1] doi: 10.12688/f1000research.5934.1

Does apical membrane GLUT2 have a role in intestinal glucose uptake?

Richard J Naftalin 1,a
PMCID: PMC4309173  PMID: 25671087

Abstract

It has been proposed that the non-saturable component of intestinal glucose absorption, apparent following prolonged exposure to high intraluminal glucose concentrations, is mediated via the low affinity glucose and fructose transporter, GLUT2, upregulated within the small intestinal apical border.

The evidence that the non-saturable transport component is mediated via an apical membrane sugar transporter is that it is inhibited by phloretin, after exposure to phloridzin. Since the other apical membrane sugar transporter, GLUT5, is insensitive to inhibition by either cytochalasin B, or phloretin, GLUT2 was deduced to be the low affinity sugar transport route.

As in its uninhibited state, polarized intestinal glucose absorption depends both on coupled entry of glucose and sodium across the brush border membrane and on the enterocyte cytosolic glucose concentration exceeding that in both luminal and submucosal interstitial fluids, upregulation of GLUT2 within the intestinal brush border will usually stimulate downhill glucose reflux to the intestinal lumen from the enterocytes; thereby reducing, rather than enhancing net glucose absorption across the luminal surface.

These states are simulated with a computer model generating solutions to the differential equations for glucose, Na and water flows between luminal, cell, interstitial and capillary compartments. The model demonstrates that uphill glucose transport via SGLT1 into enterocytes, when short-circuited by any passive glucose carrier in the apical membrane, such as GLUT2, will reduce transcellular glucose absorption and thereby lead to increased paracellular flow. The model also illustrates that apical GLUT2 may usefully act as an osmoregulator to prevent excessive enterocyte volume change with altered luminal glucose concentrations.

Introduction

Intestinal glucose absorption has been studied for more than a century and still remains controversial. During the last fifty years the main research thrust has been to identify and characterize the individual transport components within the intestinal epithelium. This progressively reductivist approach has been very successful: we have a comprehensive knowledge of the nature of the driving forces generating sugar absorption; the specificity range of the sugar transporters involved; their sites of activity within the enterocytes and of how the individual transport processes function at a molecular level 13. Less clear is how the intestine functions as a working ensemble to absorb glucose over the wide range of luminal concentrations occurring within the small intestine and how this process is controlled, both in the short and long-term. These uncertainties arise from the multiplicity and complexity of interactive processes and lack of a comprehensive model permitting an integrated view of intestinal glucose uptake.

The early opinion on intestinal glucose transport was that stereospecific electrogenic active transcellular transport process coexisted with a variable non-specific paracellular diffusive flux 48. Intestinal glucose absorption entails specific sodium-dependent hexose interactions with jejunal and ileal enterocyte glucose transporters in the apical and sodium-independent passive downhill transport via basal-lateral membranes and transit by solvent drag via non-selective paracellular pathways, generated by electro-osmotic flow of Na + and water 7, 9, 10, or by paracellular passive diffusion down the glucose concentration gradient existing between the intestinal lumen and lamina propria 11, 12. This diffusive route permits non-specific transport of L-glucose, D-rhamnose, or mannitol, as well as D-glucose at rates that are correlated with net fluid transport 13. The general consensus was that at around a luminal glucose ≈ 25 mM the active and passive components are about equal and above this passive absorption becomes dominant ( Figure 1).

Figure 1. These diagrams show snapshots of the simulated glucose flows from intestinal lumen loaded with 50 mM in 150 mM NaCl to capillaries perfusing the submucosal spaces, whose afferent arterial concentration contains 150 mM NaCl and 5 mM D glucose.

Figure 1.

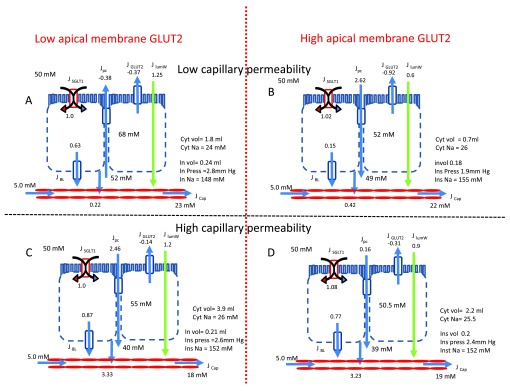
The tissue in panel A has low apical GLUT2 and GLUT5 activity and low capillary permeability and perfusion rates (clearance). In panel B the tissue apical membrane GLUT2 activity is increased by 4-fold above that in panel A, capillary perfusion is unchanged. In panel C, the apical GLUT2 activity is the same as in panel A, but capillary clearance is increased by 10-fold. In panel D, the apical GLUT2 is raised, as in panel B and the capillary clearance raised, as in panel C.

The rates of glucose uptake are normalized relative to the rate of SGLT1 glucose uptake (panel A). Altering either GLUT2, or capillary clearance have negligible effects on glucose inflow via SGLT1. However, after raising the apical GLUT2 activity, the steady state glucose concentration within the cytosol decreases from 68 to 52 mM (c.f. Panels A and C). On raising capillary clearance, the steady state of cytosolic glucose concentration also decreases (c.f. Panel A versus Panel C and Panel B versus Panel D).

Raising capillary glucose clearance increases the rate of glucose inflow from the interstitial to capillary fluid by fourteen fold (c.f. Panel A and C). These changes are accompanied by decreased interstitial fluid glucose from 52 to 40 mM and reductions in the mean capillary glucose from 23 to 18 mM. Reduced interstitial glucose concentrations reverse the direction of the glucose gradient across the paracellular pathway from -2 to + 10 mM. Thus raising the capillary clearance of glucose, reverses the direction of paracellular glucose flow from (-0.38) to (+2.46) and increases the net glucose inflow across the luminal surface from (0.22 to 3.23).

Although raising apical membrane GLUT2 activity by fourfold reduces net glucose influx across the apical border from 0.63 to 0.15, it also indirectly leads to an increase in paracellular glucose flux and thereby causes a slight increase in net glucose flux across the luminal border.

When capillary clearance is raised, either by enhanced perfusion rates, or increased endothelial permeability, increasing apical membrane GLUT2 enhances apical membrane glucose reflux from -0.14 to -0.31. This has no significant effect on glucose flow from the interstitial to capillary fluid. (c.f. panel C and D).

This dual transport model explained why the apparent affinity of total net glucose uptake is much less, K m > 62.3±3.2 mM than the K m obtained for electrogenic glucose transport (K m = 17.9±0.4 mM); and why phloridzin, a blocker of Na-coupled glucose transport via SGLT1 at the luminal surface, affects mainly electrogenic transport, but not transport via the paracellular route 4.

Parsons and colleagues 14, 15 were amongst the first to postulate parallel active and passive absorptive processes in the luminal surface intestinal membrane.

Kellett and colleagues 1, 16, 17 later proposed that when luminal glucose is raised above 15 mM, that the non-saturable absorptive component, instead of being via the paracellular route is due to influx via a low affinity glucose transporter, GLUT2, whose presence is regulated within jejunal and ileal enterocytes apical membranes. The salient experimental evidence supporting this view is that the “non-saturable” component of glucose absorption is inhibited by either high phloretin (0.75–1 mM), or high cytochalasin B (0.2 mM) concentrations, both of which inhibit GLUT2 and neither of which inhibit GLUT5.

Using a sigmoid curve fit, Kellett and Helliwell 1 obtained a K m of the phloretin-sensitive component “similar” to that of GLUT2, 56±14 mM; n=1.6±0.4. They argued that GLUT2 is the most likely route for this low affinity transport, since it also transports fructose. Later reports showed that artificial sweeteners e.g. aspartame, sucralose and saccharin in parallel with an increase in intracellular calcium, increase the rate of glucose absorption, by increasing brush border GLUT2 18 and this in turn increased release of several incretins gluco-insulinotropic peptide(GIP); glucagon- like peptide (GLP-1) and peptide tyrosine-tyrosine (PYY) from enteroendocrine cells 19.

Although these arguments seem plausible, there are several reasons to question the assertion that apical membrane GLUT2 mediates the low affinity component of intestinal D-glucose absorption. Many studies have shown that the low affinity glucose absorptive route has low specificity- it can transport sugars e.g. L-glucose or rhamnose, or low molecular weight solutes, such as Cr-EDTA, or mannitol, that are not transported by any GLUTs 13. Thus the explanation that GLUT2 is the sole mediator of the low affinity sugar transport route does not explain transport of these paracellular markers without any affinity for sugar transporters.

The K m of GLUT2 has been measured as approximately 17 mM 20, 21, this value is much lower than the very high K m 56±14 mM observed by Kellett & Helliwell (2000) 1. Additionally, at luminal glucose concentrations > 50 mM absorption linearly correlates with luminal concentration; i.e. is not saturable 8. Thus the high K m of the “phloretin-sensitive” component does not necessarily signify glucose transport via a low affinity glucose transporter.

Furthermore, phloretin- is not uniquely specific as a glucose-transporter inhibitor. Phloretin also blocks chloride, or aquaporin water channels, or urea transporter mediated urea and water transport, probably by intercalating with the lipid membrane and consequently may also inhibit solute and water paracellular transport 22, 23. Hence, a transport process blocked by high concentrations of phloretin or cytochalasin B need not imply that the inhibited flow is mediated via apical membrane GLUT2.

In contrast to Kellett and colleagues’ claims, other studies with GLUT2 knock out (KO) mice have shown that GLUT2 makes no substantial contribution to net glucose absorption and furthermore that D-glucose accumulation in enterocytes is increased in GLUT2 KO mice 20, 24. This increase can in part be ascribed to loss of GLUT2 mediated transport activity from the baso-lateral membranes. Doubts have also been raised as to whether GLUT2 is expressed at all in the intestinal apical membranes 25. Roder et al. 24, were unable to detect significant levels of GLUT2 within the intestinal brush borders of wild type mice. Additionally, in humans there is an absence of any detectible increased response to artificial sweeteners with relation to any increased sugar uptake, or incretin release 26, 27.

However, Kellett 28, has responded to some of these arguments, suggesting that the mice used in these KO studies were not optimally prepared. Starvation leads to loss of both intestinal GLUT2 apical protein and GLUT2 mRNA, whereas re-feeding after a period of starvation leads to a rapid increase in both apical GLUT2 expression and to GLUT2 mRNA expression within the intestine 29.

The later results reported by Brot-Laroche’s group appear to conflict with some earlier data from her laboratory showing that semi-starvation increased the V max and K m of D-glucose uptake into guinea pig jejunal brush border membrane vesicles (BBMV) 30. Starvation was postulated to induce a secondary low affinity glucose transport system. Additional studies revealed that phloretin (0.25 mM) enhanced the initial rate of D-glucose uptake by 15% into guinea-pig BBMV. Application of Student’s two-tailed t–test shows that this increase is significant (P < 0.012). Cytochalasin B (0.1 mM) inhibited D-glucose (10 mM) uptake by 38% (p < 0.0001), but had negligible effects on SGLT1 specific α-methyl-D-glucoside uptake 31. The earlier results imply that phloretin enhances, rather than inhibits, the low affinity D-glucose transport in BBMV, as was later asserted 1, 18.

Recent live imaging studies indicate that GLUT2 is a variable presence within the apical membrane 32; its trafficking being dependent on signals induced by high intracellular glucose concentrations.

Analysis

Although upregulation of apical membrane GLUT2 is a feature of raised luminal D-glucose concentrations, it is far from clear, as contended, that this leads to enhanced net glucose transport 1, 17. Since both active (SGLT1) and passive glucose transporter (GLUTs 2 and 5) elements are present within the brush border membranes, the kinetics of net glucose flow across the brush border ensemble will depend both on the variable glucose concentrations in the adjacent luminal and cytosolic compartments and the relative proportions of active and passive transport components and the area of absorbing intestinal surface exposed to glucose. The steady state cytosolic and interstitial glucose concentrations are also reliant upon the concentration dependence of flows across the baso-lateral membrane into the interstitial fluid and between the luminal fluid and interstitial fluid via the intercellular junctions. GLUT2 (K m ≈ 17 mM) is the main transporter for glucose movement across the basal-lateral membranes 33, 34.

The apparent transport parameters (K m and V max) 46 obtained. In intestinal enterocytes in situ, where flows with varying luminal glucose concentrations are normally measured in steady state, have scant resemblance to those obtained in zero-trans conditions with isolated membrane vesicles or oocytes.

Uphill glucose transport via the apical membrane sodium-glucose cotransporter SGLT1 generates polarized sugar flow, causing the intracellular glucose concentration to increase: eventually the cytosolic and also interstitial glucose concentrations may exceed the luminal concentration 35. Once these conditions are met, glucose will reflux back into the intestinal lumen via passive transporters in the apical membrane, or via the tight junction ( Figure 1A). If the V max of the passive apical membrane glucose transporters is raised, then owing to enhanced glucose reflux via GLUT2, net glucose influx across the apical membrane will be reduced. However, net glucose uptake across the luminal surface, including the paracellular pathways may be augmented. This increase in paracellular glucose flow arises from decreased transcellular flow. The resulting slight decrease in interstitial fluid glucose concentration increases the gradient between the intestinal lumen and interstitial fluid, ( Figure 1B) and Figure 3(A–C).

Glucose influx across the apical membrane remains polarized over a very wide concentration range, due to the very low affinity for glucose at the export site of SGLT1 35, 36. Thus when both the cytosolic and the interstitial glucose concentrations are close to GLUT2 saturation levels; i.e. D-glucose > 30 mM, the resistance to glucose outflow across the baso-lateral membrane will increase. Consequently, cytosolic concentration may increase disproportionally as luminal glucose concentrations rise, since the apical and baso-lateral membranes may act as a double membrane rectifier to glucose flow 37. This promotes non-linear glucose accumulations in the intermediate cytosol between the apical and baso-lateral membranes 11, 38, 39 ( Figure 1A).

Glucose flow from the interstitial fluid into the villus capillaries depends on the glucose diffusion between the interstitial fluid and the mean capillary luminal concentration. The mean capillary luminal glucose concentration is a complex non-linear function of the glucose permeability of the capillary membranes, the systemic arterial glucose concentration and the capillary flow rate 11. The boundary conditions of this flow network determine the steady-state glucose concentrations within all the intermediate compartments.

Raising intestinal luminal glucose above 30 mM results in increased superior mesenteric arterial flow from around 1000–2500 ml min -1 4042. Raised capillary glucose clearance will reduce the interstitial glucose concentration, thereby also reducing cytosolic glucose concentration, thus increasing net influx across the luminal surface, whilst reducing glucose reflux both via brush border passive transporters and via the paracellular pathway. The model simulates all these conditions as seen by comparing Figures 1A and 1B with Figures 1C and 1D.

However, even with high rates of vascular perfusion, the interstitial glucose concentration approximates to that of the luminal concentration. Consequently, as luminal glucose concentrations are raised, even although interstitial capillary glucose clearance is increased, the enterocyte cytosolic concentrations continuously rises, ( Figure 2C and 2D) 11.

Figure 2. Simulation of altered apical membrane GLUT2 activity on intestinal glucose fluxes from zero (Panel A) to an arbitrary of maximal flux value of 2 (Panel B).

Figure 2.

The simulations show the glucose fluxes via apical SGLT1 (blue); apical GLUT2 (red); paracellular pathway (green); the total transluminal membrane, (SGLT1 + GLUT2 + paracellular fluxes), (black) and interstitial to capillary flow (pink crosses) inset on the black square. The main effect of increasing GLUT2 is to cause a negative glucose flux (backflux) via GLUT2 (Panel B). This is accompanied by a increased paracellular flux without any significant change in net transluminal or transepithelial glucose flux. The point at which paracellular glucose flux and SGLT1 flux are equal lies between 20 and 30 mM as has been previously observed 46. This value is used as one of the key registration points for the model.

The cytosolic (red) interstitial (blue) and mean capillary glucose concentrations (black) and enterocyte volume per unit weight of tissue (green) are shown in panel C with zero apical GLUT2 and in Panel D with GLUT2 V max = 2.

Increased apical GLUT2 activity decreases cytosolic glucose concentration (panel D). With rising luminal glucose concentration raised GLUT2 activity prevents the non-linear increase in enterocyte volume seen with zero GLUT2 (Panel C).

Figure 3. Simulation of effects of varying paracellular glucose permeability on intestinal glucose fluxes and accumulation.

Figure 3.

The effects of varying paracellular glucose permeability P glc from 0 to 0.02 cm s -1 are shown in Figure 3A increasing P glc on paracellular glucose flux (Blue) .As P glc is increased from zero the point of equality of paracellular glucose flux Jglpc with glucose flux via SGLT1 decreases from infinity at P glc = 0 to around 20–30 mM luminal glucose when P glc = 0.01–0.02 cm s -1.

Increases P glc raises interstitial glucose concentrations 3C (blue) and in parallel, cysosolic concentrations Figure 3C (red). The reduction in glucose gradient across the basolateral membrane with raised P glc reduces and then reverses glucose flux via GLUT2 ( Figure 3B).

Capillary clearance of glucose is a key factor affecting net intestinal glucose absorption at the intestinal border, as submucosal capillary glucose concentration rapidly equilibrates with that in the interstitial solution 15. Intestinal glucose clearance depends on the local blood flow rate, determined by the superior mesenteric arterial (SMA) pressure and its compliance and also the mean glucose concentration difference between the villus capillaries and the interstitial solution ( Figure 1A–D). Thus, as can be seen by comparing Figures 1A and 1B with Figures 1C and 1D, increasing the capillary clearance reduces the interstitial glucose concentration, thereby increasing the glucose gradients across the baso-lateral membranes and between the luminal and interstitial solutions, thereby enhancing absorptive flux.

With constant high capillary glucose clearance, increasing apical GLUT2 activity, whilst enhancing glucose backflux across the apical membrane, also increases paracellular absorption. This tends to nullify the GLUT2-induced decrease in apical membrane net absorption.

Additional complexity is introduced by glucose-coupled Na + and water flows altering cytosolic and interstitial osmolarities, thereby generating changes in enterocyte cytosolic and interstitial fluid volume and interstitial pressure. The interstitial pressure changes affect fluid and solute flows via the paracellular pathway and via the capillaries and lymphatics 43. The effects on water flows are shown with green arrows in Figures 1A–D. As modelled here, changing the maximal rate of apical GLUT2 or capillary perfusion rates have relatively smaller effects on net water than on glucose flows.

This is also illustrated in Figures 2A and B, where increasing apical GLUT2 activity from zero ( Figure 2A) to a high level ( Figure 2B), increases GLUT2 backflux and also enhances glucose influx via the paracellular route. Consequently the net effect of altering apical GLUT2 activity on luminal glucose absorption is almost zero.

Effects of varying paracellular glucose permeability

Increased paracellular glucose diffusion has multiple effects on glucose fluxes and accumulation. Increasing paracellular glucose permeability directly increases paracellular glucose flux ( Figure 3A (blue)). This increases the interstitial glucose concentration ( Figure 3C (blue)). Raising interstitial glucose concentration decreases the glucose concentration gradient across the basolateral membrane, thereby decreasing basolateral glucose flux and raising cytosolic glucose concentration ( Figure 3C (red)). Increasing cytosolic glucose concentration reverses the direction of glucose flow across the apical membrane via GLUT2 ( Figure 3B (red)), but is without significant effect on glucose flux via SGLT1 ( Figure 3A), or cell volume ( Figure 3B (blue)).

Thus, it is evident that paracellular glucose diffusion significantly alters glucose fluxes, both directly via the paracellular and indirectly on the passive glucose fluxes at the apical and baso-lateral membranes. Only when paracellular glucose flux is close to zero is there any significant glucose influx via GLUT2 ( Figure 3B).

Effects of phloridzin and phloretin on intestinal glucose transport

The effect of phloridzin is to block SGLT1 without affecting GLUT2 1. As previously discussed, phloretin inhibits GLUTs 1-IV, but not GLUT5. However, it has additional effects on chloride, urea and water permeability, so also affects paracellular conductivity 22, 23.

Simulation of the temporal effects of phloridzin on intestinal glucose uptake exposed to luminal glucose 30 mM 1 shows that whilst inhibiting glucose influx via SGLT1, net glucose efflux via GLUT2 is abolished as a result of the decreased uphill glucose accumulation in the cytosol. Hence glucose flux across the basolateral membrane is reduced; however, because the interstitial glucose decreases due to diminished, transcellular flow paracellular glucose influx rises. Consequently, the net effect of SGLT1 inhibition by phloridzin on net glucose absorption is negligible, as observed in rabbit ileum pre-incubated with glucose 9. Following phloridzin inhibition of SGLT1, cytosolic glucose falls from ≈ 32 mM to ≈ 17 mM as simulated here ( Figure 4A and 4B).

Figure 4. Simulation of sequential additions of phloridzin then phloretin to the luminal fluid on intestinal glucose fluxes.

Figure 4.

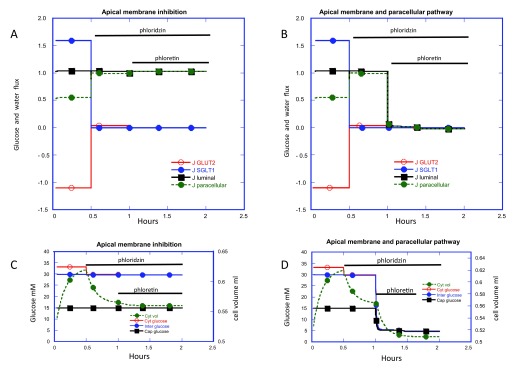
GLUT2 is present in the apical membrane V max 2 and the capillary perfusion rate = 10 is similar to that shown in Figure 2 panels B and D. The luminal glucose is 30 mM and afferent capillary glucose is 5 mM to simulate the conditions used by Kellett & Helliwell 2000 1. In Figure 4, panels A and B inhibition of SGLT1 activity at 0.5h to zero reduces glucose flux via SGLT1 to zero. Simultaneously glucose flux via GLUT2 increases thereby reversing the backflux from -1.1. to 0.05 and also paracellular glucose flux increases from 0.55 to 0.95. In panels C and D the glucose concentration changes in the cytosol (red) interstitial fluid (blue) capillary fluid (black) and cytosolic volume (green). Following phloridzin addition and inhibition of SGLT1, cytosolic glucose falls from 33 to 30 mM; cytosolic volume falls from 0.62 to 0.56 ml at 1 hour without significant changes in capillary or interstitial fluid glucose concentration. This explains both the fall in glucose reflux via GLUT2 and the decrease in basolateral membrane flux is compensated by the rise in paracellular flux thereby nullifying interstitial glucose concentration changes.

Phloretin addition at 1h is simulated by blocking apical GLUT2 (panel A) and by blocking both apical GLUT2 and paracellular glucose and Na permeability (panel B). GLUT2 fluxes fall to zero in both panels A and B and in panel A there is a small increase in paracellular glucose flow but the total transluminal glucose flux is unaffected by addition of phloretin after phloridzin. There is a small decrease in cytosolic volume from 0.56 to ≈ 0.55. the paracellular flux falls to zero as does the transluminal glucose flux in panel B, simulating the effect observed by Kellett and Helliwell 2000 1. This is accompanied by a large decrease in cell volume from 0.56 to 0.51 ml. Since no net glucose transport now occurs from the luminal fluid, capillary glucose concentration also decreases to 5 mM.

Subsequent inhibition of apical GLUT2 by phloretin is accompanied only by a very small decrease in net glucose influx as it falls to zero. However, this decrease in net transcellular glucose influx is supplemented by a reciprocal increase in paracellular flux, so that there is still a negligible change in net luminal glucose absorption. Thus, when glucose fluxes via apical SGLT1 and GLUT2 are completely inhibited, only the paracellular route remains to permit luminal to submucosal glucose flow and this flux rises to compensate for the reduced transcellular flow as a result of reduced interstitial glucose concentration.

The simulation shows that if phloretin inhibits only apical GLUT2, then it exerts no significant effect on luminal glucose uptake Figure 4A. If instead of only inhibiting glucose flux via apical GLUT2, phloretin also inhibits paracellular glucose and electrolyte fluxes, then the observed effect on intestinal glucose absorption ( Figure 4B) is similar to that observed by Kellett and Helliwell 1; namely, reduction in net luminal glucose flux to zero. The cytosolic glucose together with the interstitial glucose concentrations now fall to 5 mM; equal to the sink capillary glucose concentration, since now there is no compensatory rise in paracellular glucose flux occurring when interstitial glucose concentration is reduced.

Effects of GLUT2 on enterocyte volume during glucose loading via SGLT1

GLUT2 functions as an apical glucose shunt, thereby reducing cytosolic glucose accumulation by SGLT1. This shunt functions in two important ways, first by reducing net luminal influx, rather than increasing it as previously deduced 1. It will also redistribute the luminal glucose to more distal intestinal regions, consequently exposing larger intestinal surface areas to luminal glucose.

This latter effect may explain why when pigs are exposed to high carbohydrate diets raised SGLT1 protein and mRNA expression is observed in more distal intestinal regions 44. More SGLT1 is also observed in duodenal epithelia of morbidly obese humans 45. Increased density and increased area of intestinal SGLT1 expression implies that the intestine develops the capacity to deal with increased carbohydrate loads by absorbing more carbohydrate in aggregate, although not per unit area ( Figure 5). This will generate higher concentration peaks of carbohydrate in the splanchnic circulation following absorbable carbohydrate ingestion 41, 45 and higher rates of splanchnic blood flow in conscious animals 4648.

Figure 5. Diagram showing the predicted effects from the simulation model of loading enterocytes with luminal fluid containing 50 mM glucose and 5 mM glucose in the capillary perfusion fluid in A normal enterocytes expressing apical membrane GLUT2 and in B GLUT2 KO enterocytes.

Figure 5.

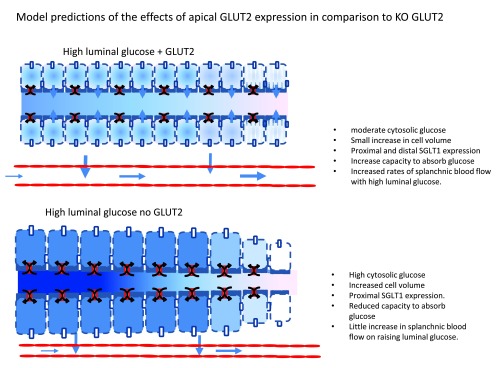
The KO cells have higher enterocyte glucose concentrations in the proximal intestine, but higher paracellular flow and larger cell volumes. The normal enterocytes have lower cytosolic glucose concentrations and SGLT1 is more widely dispersed along the intestinal length with higher rates of glucose permeation in distal regions of the small intestine. Long term exposure may lead to higher maximal glucose absorption rates in normal intestine than with GLUT2 KO.

It would seem more likely that instead of a means of enhancing apical glucose absorption, GLUT2 behaves primarily as an osmoregulator to maintain enterocyte volume in the face of large and rapid changes in the luminal and cytosolic osmotic pressure following ingestion of carbohydrates, or their subsequent dilution upon drinking water.

Since glucose is one of the most variable osmolytes within the intestine and splanchnic circulation, it is likely that a rapid adaptation to hyper or hypo osmotic changes within the intestinal lumen via a GLUT2 shunt pathway in the apical membrane would provide a useful means of regulating enterocyte volume, thereby avoiding excessive membrane stress and cytolysis. The reduced local net influx would also result in redistribution of hypertonic luminal glucose to more distal regions where this excess glucose would be absorbed by SGLT1.

GLUT2 has not previously been considered as an osmoregulator of enterocyte volume. This role has been mainly assigned to potassium and chloride channels 49. Whilst ion channels certainly provide an important role in cell volume regulation, they may not be as well adapted as GLUT2 to fulfilling the enterocytes’ specialized needs for osmotic control due to large changes in sugar dependent osmotic gradients.

Simulation shows that glucose accumulation within the cytosol via SGLT1 is accompanied by an increased cytosolic volume Figures 2C and 2D, Figures 4C and 4D. The effect of increased rates of apical GLUT2 which prevents excessive glucose accumulation at high luminal glucose concentrations, compare Figure 2C with Figure 2D, also reduces enterocyte volume increase.

Summary and conclusions

Kellett & Helliwell (2000) 1 have proposed that the non-saturable component of intestinal glucose absorption, apparent when luminal glucose is raised above 15 mM, is due to enhanced flux via the low affinity glucose transporter GLUT2, which they and others have observed 32 is present within the apical border of the jejunum and ileum following prolonged exposure to high intraluminal glucose or following activation of protein kinase C by phorbol myristate acetate.

Evidence in support of this contention is that this “non-saturable” component is inhibited by high phloretin or high cytochalasin B concentrations – which both can inhibit GLUT2. The K m of the phloretin sensitive component claimed to be similar to that of GLUT2 approximately 56±14; n = 1.6±0.4.

They argue that GLUT2 is the most likely route for this low affinity transport, since it also transports fructose and the only other fructose transporter GLUT5 is insensitive to inhibition by either cytochalasin B or phloretin.

However, it is unclear that upregulation of GLUT2 within the intestinal brush border actually does enhance D-glucose absorption. At raised luminal glucose concentrations the cytosolic concentrations and the submucosal interstitial fluid glucose concentrations will exceed the intestinal luminal glucose concentrations, so GLUT2 will stimulate passive downhill glucose reflux from the enterocyte cytosol, thus reducing net glucose uptake across the luminal surface. This glucose backflux may be augmented by glucose reflux via the paracellular pathway when the interstitial glucose is raised. This will occur when the splanchnic capillary glucose concentration is raised above 10 mM, as occurs during ingestion of high glucose loads, or in hyperglycaemic states.

These states are simulated here with a model of intestinal glucose transport incorporating glucose sodium and water cotransport across the luminal border variable rates of apical GLUT2 and paracellular flows and variable rates of capillary clearance of solutes and water from the submucosal interstitial fluid.

The model demonstrates that apical membrane GLUT2 may usefully function as osmoregulator to prevent excessive enterocyte volume changes during glucose loading, or following sudden decreases in luminal glucose concentration.

Methods

Summary of model equations

The simultaneous flows of glucose Na and water from lumen across the apical membrane to cytosol and across the intercellular junctions from lumen to interstitial space followed by flows across the basolateral membrane of glucose Na and water to the interstitial space and from the interstitial space to the capillary lumen are modelled using Berkeley Madonna version 9.0119 http://www.berkeleymadonna.com/. Water flows generated by the osmotic pressure generated across the membrane boundaries between adjacent compartments generate volume changes in the cytosol and interstitial compartments. These volume changes are controlled by independent apical and baso-lateral hydraulic coefficients. Additionally, Na + and glucose flow via SGLT1 and GLUT2 are assumed to generate a coupled water flow 50, 51 and modelled as an additional component of water flux across both apical and basolateral membranes. The interstitial fluid compartment is assumed to have a non-linear elasticity similar to that observed by Granger 52 so that interstitial pressure rises non-linearly with volume.

The Na glucose and coupled flows and uncoupled flows via SGLT1 are modelled as outlined in 53 glucose flow across both apical and basolateral GLUT2 is modelled according to a simple two site model

i.e J glucose = (G out/(1+G out)-G in/(1+G in).V max;

where G out and G in are the glucose concentration/K m(GLUT2) in the adjoining membrane compartments and K m GLUT2 is the assigned GLUT2 K m = 17 mM. Na flux basal-lateral membranes is assumed to have a similar kinetics between two to saturable sites to that of glucose K m Na = 25 mM.

Additionally Na is pumped from the cytosol into the interstitial solution, according to the simple saturation equation

J Napump = Na cyt.V m(Napump)/(Na cyt+K m(Napump)).

Flows of glucose and Na between the interstitial fluid and capillary fluid are assume to take the form of the convective diffusion equation

J i = J w(C o+C i)/2 + P i(C o-C i).

Where J i is the solute flux and J w is water flux between interstitial fluid and capillary fluid C o and C i are the external and internal concentrations of solute i and P i is the permeability of solute i.

The water flow across the paracellular pathway Jwc pc is determined by the osmotic and hydraulic pressure difference between the luminal and interstitial solutions hence Jwc pc = L p (2(Na in-Na lum).σ Na + ((G in-G lum).σ Glc - P in) where i in and i lum are the osmotic pressure of solutes I in the luminal and interstitial fluids σ i is the reflection coefficient of solute I and P in the interstitial pressure mm Hg.

Funding Statement

The author(s) declared that no grants were involved in supporting this work.

v1; ref status: indexed

Appendix {comments are italicised with curly brackets}

  d/dt (Cytgl)= + Japgl – JGlbl { Cytgl = cytosolic glucose mM Japgl = glucose flux across the apical membrane = SGLT1+ GLUT2 flux; JGlbl = basolateral glucose flux.}

     INIT Cytgl = 0 /Cytvol { INIT = initial ; cytvol = cytosolic volume /cm 2 }

     LIMIT Cytgl >= 0

  d/dt (CytN)} = + JNap – JNbl {CytN = cytosol Na mM; JNap = Na flux across apical membrane via SGLT1 coupled and uncoupled; JNbl = Na flux across baso-lateral membrane = Na pump flux and passive Na flux}.

     INIT CytN = 1.5/Cytvol

     LIMIT CytN >= 0

  d/dt (inGlc) = + Jglpc - JcapGl + JGlbl { Jglpc = paracellular glucose flux; JcapGL= glucose flux from interstitial to capillary fluid;}

     INIT inGlc = 0/Invol {inGlc = interstitial glucose concentration}

  d/dt(InNc) = - JNcap + JNbl + JNpc { JNcap {inNc= interstitial Na concentration; JNcap = Naflux from interstitial to capillary fluid; JNbl Na flux across basolateral membrane}

     INIT InNc = 0/{Invol}


     LIMIT InNc >= 0

  d/dt(Invol)= + Jblw - Jcapw + Jpcw {Invol = interstitial volume; Jblw = water flux across basolateral membrane; Jcapw= water flux between interstitial fluid and capillary fluid; Jpcw = paracellular water flux}

     INIT Invol = 0.1 {invol= interstitial volume ml}

     LIMIT Invol >= 0

  d/dt (Cytvol) = - Jblw + Japw {Cytvol = cytosolic water volume; Jblw water flow across basolateral membrane includes osmotic and sugar coupled flows; Japw= waterflow across apical membrane includes osmotic and sugar coupled flows.}

     INIT Cytvol = 0.5

     LIMIT Cytvol >= 0

Berkeley Madonna equations

  {Reservoirs}

  d/dt (Cytgl) = + Japgl - JGlbl

     INIT Cytgl = 0 /Cytvol

     LIMIT Cytgl >= 0

  d/dt (CytN) = + JNap - JNbl

     INIT CytN = 1.5/Cytvol

     LIMIT CytN >= 0

  d/dt (inGlc) = + Jglpc - JcapGl + JGlbl

     INIT inGlc = 0/Invol

  d/dt (InNc) = - JNcap + JNbl + JNpc

     INIT InNc = 0/(Invol)

     LIMIT InNc >= 0

  d/dt (Invol) = + Jblw - Jcapw + Jpcw

     INIT Invol = 0.1

     LIMIT Invol >= 0

  d/dt (Cytvol) = - Jblw + Japw

     INIT Cytvol = 0.5

     LIMIT Cytvol >= 0


  {Flows}

  Japgl = (LumGl1sat-cyGLu1sat)*LGg+Lgn2*(LumNsat-CyNsat)+(LumGl2sat-Cyglu2sat)*VmGlap

  JGlbl = (cytglc/(cytglc+KmGbl)-InsGlc/(InsGlc+KmGbl))*VmGlbl

  JNap = (LumNsat-CyNsat)*LNn+(LumGl1sat-cyGLu1sat)*Lgn2

  JNbl = (CyNsat-InNsat)*LNn+Vpump*CyNsat

  JcapGl = Jcapw*(InsGlc+capGlc)/2+(InsGlc-capGlc)*PcapGl/1000

  JNcap = Jcapw*(InNc+capNc)/2+PcapN*(InNc-150)/1000

  Jglpc = (LumGlc-InsGlc)*Pglpc+Jpcw*(1-sigGl)*(LumGlc+InsGlc)/2

  JNpc = (LumN-InNc)*PNpc+Jpcw*(1-SigN)*(LumN+InNc)/2

  Jpcw = (insosm2-lumosm2+IntPressure)*(Lppc)/1E6

  Jcapw = IntPressure^2*Lpcap/1E6

  Japw = (cytosm-Lumosm)*Lpap/1E9+Japgl*Gwcoef/100

  Jblw = (Inosm-cytosm)*Lpbl /1E9


  {Functions}

  LumGl1nor = LumGlc/ KmGl1

  CyNnor = CytN/KmNap

  LumGlc = if time > 5000 then (time-5000)*1E-5 else 0

  LumN = 150

  LumNnor = LumN/KmNap

  LumGl1sat = LumGl1nor/(LumGl1nor+1)

  LumNsat = LumNnor/(LumNnor+1)

  LumGlc1nor = cytglc/KmGl1

  cyGLu1sat = LumGlc1nor/(LumGlc1nor+1)

  CyNsat = CyNnor/(CyNnor+1)

  InsGlc = inGlc

  Lumgl2nor = LumGlc/KmGl2

  LumGl2sat = Lumgl2nor/(Lumgl2nor+1)

  Cyglcnor = cytglc/KmGl2

  Cyglu2sat = Cyglcnor/(Cyglcnor+1)

  InNsat = InNc/KmNap/(InNc/KmNap+1)

  Lumosm = LumN*2+LumGlc

  Inosm = InNc*2*SigN+InsGlc*sigGl

  cytglc = Cytgl

  CyNc = CytN

  cytosm = fixosm+CyNc*2+cytglc

  fixosm = 125/Cytvol

  JNlum = JNap+JNpc

  Jlumw = Jpcw+Japw

  IntPressure = (0.0+289.76*(Invol-0.01)-3553* (Invol-0.1)^2+28191*(Invol-0.01)^3-1.0767e5*(Invol-0.01)^4+1.5528e5*(Invol-0.01)^5)*pccoef

  Jtotlumgl = Jglpc+Japgl

  Lppc = Lppc*intPressure*pccoef

  Lgn2 = LGng*LumNsat*LumGl2sat

  pccoef = 1

  capGlc = 5+(InsGlc-5)*0.4

  capNc = 150+(InNc-150)*0.6

  lumosm2 = LumGlc*sigGl+LumN*2*SigN

  insosm2 = InNc*2*SigN+InsGlc*sigGl

  JGLUT2 = (LumGl2sat-Cyglu2sat)*VmGlap

  JSGLT1 = Japgl-JGLUT2


  {Globals}

  KmGl1=2

  KmGl2=15

  KmNap=25

  KmGbl=5

  LGg =1

  LGng=0.1

  LNn=1

  VmGlap=1

  VmGlbl=1

  Vpump =1

  PcapGl=0.1

  PcapN=0.1

  Pglpc=0.1

  PNpc= 0.01

  Pprot=0.1

  Lppc=1E-5

  Lpcap= 1E-6

  Lpap=1E-6

  Lpbl=1E-6

  sigGl= 0.2

  SigN=0.5

  Gwcoef=500

References

  • 1.Kellett GL, Helliwell PA: The diffusive component of intestinal glucose absorption is mediated by the glucose-induced recruitment of GLUT2 to the brush-border membrane. Biochem J. 2000;350(Pt 1):155–62. 10.1042/0264-6021:3500155 [DOI] [PMC free article] [PubMed] [Google Scholar]
  • 2.Hummel CS, Lu C, Loo DD, et al. : Glucose transport by human renal Na+/D-glucose cotransporters SGLT1 and SGLT2. Am J Physiol Cell Physiol. 2011;300(1):C14–21. 10.1152/ajpcell.00388.2010 [DOI] [PMC free article] [PubMed] [Google Scholar]
  • 3.Hummel CS, Lu C, Liu J, et al. : Structural selectivity of human SGLT inhibitors. Am J Physiol Cell Physiol. 2012;302(2):C373–82. 10.1152/ajpcell.00328.2011 [DOI] [PMC free article] [PubMed] [Google Scholar]
  • 4.Debnam ES, Levin RJ: Effects of fasting and semistarvation on the kinetics of active and passive sugar absorption across the small intestine in vivo. J Physiol. 1975;252(3):681–700. [DOI] [PMC free article] [PubMed] [Google Scholar]
  • 5.IIundain A, Lluch M, Pons F: Kinetics of intestinal sugar transport, in vivo. Rev Esp Fisiol. 1979;35(3):359–66. [PubMed] [Google Scholar]
  • 6.Bolufer J, Delgado MJ, Murillo F, et al. : Galactose transport across rat small intestine in vivo following distal resections of varying extents. Q J Exp Physiol. 1986;71(3):423–31. [DOI] [PubMed] [Google Scholar]
  • 7.Pappenheimer JR, Reiss KZ: Contribution of solvent drag through intercellular junctions to absorption of nutrients by the small intestine of the rat. J Membr Biol. 1987;100(2):123–36. 10.1007/BF02209145 [DOI] [PubMed] [Google Scholar]
  • 8.Pappenheimer JR: Paracellular intestinal absorption of glucose, creatinine, and mannitol in normal animals: relation to body size. Am J Physiol. 1990;259(2 Pt 1):G290–9. [DOI] [PubMed] [Google Scholar]
  • 9.Naftalin RJ, Tripathi S: The roles of paracellular and transcellular pathways and submucosal space in isotonic water absorption by rabbit ileum. J Physiol. 1986;370:409–32. [DOI] [PMC free article] [PubMed] [Google Scholar]
  • 10.Fischbarg J: Fluid transport across leaky pithelia: central role of the tight junction and supporting role of aquaporins. Physiol Rev. 2010;90(4):1271–90. 10.1152/physrev.00025.2009 [DOI] [PubMed] [Google Scholar]
  • 11.Pappenheimer JR, Michel CC: Role of villus microcirculation in intestinal absorption of glucose: coupling of epithelial with endothelial transport. J Physiol. 2003;553(Pt 2):561–74. 10.1113/jphysiol.2003.043257 [DOI] [PMC free article] [PubMed] [Google Scholar]
  • 12.Granger DN, Mortillaro NA, Taylor AE: Interactions of intestinal lymph flow and secretion. Am J Physiol. 1977;232(1):E13–8. [DOI] [PubMed] [Google Scholar]
  • 13.Bijlsma PB, Fihn BM, Sjöqvist A, et al. : Water absorption enhances the uptake of mannitol and decreases Cr-EDTA/mannitol permeability ratios in cat small intestine in situ. Scand J Gastroenterol. 2002;37(7):799–806. 10.1080/gas.37.7.799.806 [DOI] [PubMed] [Google Scholar]
  • 14.Boyd CA, Cheeseman CI, Parsons DS: Effects of sodium on solute transport between compartments in intestinal mucosal epithelium. Nature. 1975;256(5520):747–9. 10.1038/256747a0 [DOI] [PubMed] [Google Scholar]
  • 15.Boyd CA, Parsons DS: Movements of monosaccharides between blood and tissues of vascularly perfused small intestine. J Physiol. 1979;287:371–91. [DOI] [PMC free article] [PubMed] [Google Scholar]
  • 16.Kellett GL, Brot-Laroche E: Apical GLUT2: a major pathway of intestinal sugar absorption. Diabetes. 2005;54:3056–62. 10.2337/diabetes.54.10.3056 [DOI] [PubMed] [Google Scholar]
  • 17.Kellett GL, Brot-Laroche E, Mace OJ, et al. : Sugar absorption in the intestine: the role of GLUT2. Annu Rev Nutr. 2008;28:35–54. 10.1146/annurev.nutr.28.061807.155518 [DOI] [PubMed] [Google Scholar]
  • 18.Mace OJ, Affleck J, Patel N, et al. : Sweet taste receptors in rat small intestine stimulate glucose absorption through apical GLUT2. J Physiol. 2007;582(Pt 1):379–92. 10.1113/jphysiol.2007.130906 [DOI] [PMC free article] [PubMed] [Google Scholar]
  • 19.Mace OJ, Schindler M, Patel S: The regulation of K- and L-cell activity by GLUT2 and the calcium-sensing receptor CasR in rat small intestine. J Physiol. 2012;590(Pt 12):2917–36. 10.1113/jphysiol.2011.223800 [DOI] [PMC free article] [PubMed] [Google Scholar]
  • 20.Stumpel F, Burcelin R, Jungermann K, et al. : Normal kinetics of intestinal glucose absorption in the absence of GLUT2: evidence for a transport pathway requiring glucose phosphorylation and transfer into the endoplasmic reticulum. Proc Natl Acad Sci U S A. 2001;98(20):11330–5. 10.1073/pnas.211357698 [DOI] [PMC free article] [PubMed] [Google Scholar]
  • 21.Arbuckle MI, Kane S, Porter LM, et al. : Structure-function analysis of liver-type (GLUT2) and brain-type (GLUT3) glucose transporters: expression of chimeric transporters in Xenopus oocytes suggests an important role for putative transmembrane helix 7 in determining substrate selectivity. Biochemistry. 1996;35(51):16519–27. 10.1021/bi962210n [DOI] [PubMed] [Google Scholar]
  • 22.Hoffmann EK, Simonsen LO, Sjoholm C: Membrane potential, chloride exchange and chloride conductance in Ehrlich mouse ascites tumour cells. J Physiol. 1979;296:61–84. [DOI] [PMC free article] [PubMed] [Google Scholar]
  • 23.Esteva-Font C, Phuan PW, Anderson MO, et al. : A small molecule screen identifies selective inhibitors of urea transporter UT-A. Chem Biol. 2013;20(10):1235–44. 10.1016/j.chembiol.2013.08.005 [DOI] [PMC free article] [PubMed] [Google Scholar]
  • 24.Röder PV, Geillinger KE, Zietek TS, et al. : The role of SGLT1 and GLUT2 in intestinal glucose transport and sensing. PLoS One. 2014;9(2):e89977. 10.1371/journal.pone.0089977 [DOI] [PMC free article] [PubMed] [Google Scholar]
  • 25.Shirazi-Beechey SP, Moran AW, Batchelor DJ, et al. : Glucose sensing and signalling; regulation of intestinal glucose transport. Proc Nutr Soc. 2012;70(2):185–93. 10.1017/S0029665111000103 [DOI] [PubMed] [Google Scholar]
  • 26.Ma J, Chang J, Checklin HL, et al. : Effect of the artificial sweetener, sucralose, on small intestinal glucose absorption in healthy human subjects. Br J Nutr. 2010;104(6):803–6. 10.1017/S0007114510001327 [DOI] [PubMed] [Google Scholar]
  • 27.Ford HE, Peters V, Martin NM, et al. : Effects of oral ingestion of sucralose on gut hormone response and appetite in healthy normal-weight subjects. Eur J Clin Nutr. 2011;65(4):508–13. 10.1038/ejcn.2010.291 [DOI] [PubMed] [Google Scholar]
  • 28.Kellett GL: Comment on: Gorboulev et al. Na+-D-glucose cotransporter SGLT1 Is pivotal for intestinal glucose absorption and glucose-dependent incretin secretion. Diabetes 2012;61:187–196. Diabetes. 2012:61(6):e4. 10.2337/db11-1793 [DOI] [PMC free article] [PubMed] [Google Scholar]
  • 29.Habold C, Foltzer-Jourdainne C, Le Maho Y, et al. : Intestinal gluconeogenesis and glucose transport according to body fuel availability in rats. J Physiol. 2005;566(Pt 2):575–86. 10.1113/jphysiol.2005.085217 [DOI] [PMC free article] [PubMed] [Google Scholar]
  • 30.Brot-Laroche E, Dao MT, Alcaldet AI, et al. : Independent modulation by food supply of two distinct sodium-activated D-glucose transport systems in the guinea pig jejunal brush-border membrane. Proc Natl Acad Sci U S A. 1988;85(17):6370–3. 10.1073/pnas.85.17.6370 [DOI] [PMC free article] [PubMed] [Google Scholar]
  • 31.Brot-Laroche E, Supplisson S, Delhomme B, et al. : Characterization of the D-glucose/Na+ cotransport system in the intestinal brush-border membrane by using the specific substrate, methyl alpha-D-glucopyranoside. Biochim Biophys Acta. 1987;904(1):71–80. 10.1016/0005-2736(87)90088-5 [DOI] [PubMed] [Google Scholar]
  • 32.Cohen M, Kitsberg D, Tsytkin S, et al. : Live imaging of GLUT2 glucose-dependent trafficking and its inhibition in polarized epithelial cysts. Open Biol. 2014;4(7). 10.1098/rsob.140091 [DOI] [PMC free article] [PubMed] [Google Scholar]
  • 33.Karasov WH, Debnam ES: Rapid adaptation of intestinal glucose transport: a brush-border or basolateral phenomenon? Am J Physiol. 1987;253(1 Pt 1):G54–61. [DOI] [PubMed] [Google Scholar]
  • 34.Cheeseman CI, O’Neill D: Basolateral D-glucose transport activity along the crypt-villus axis in rat jejunum and upregulation induced by gastric inhibitory peptide and glucagon-like peptide-2. Exp Physiol. 1998;83(5):605–16. [DOI] [PubMed] [Google Scholar]
  • 35.Holman GD, Naftalin RJ: Transport of 3-O-methyl D-glucose and beta-methyl D-glucoside by rabbit ileum. Biochim Biophys Acta. 1976;433(3):597–614. 10.1016/0005-2736(76)90284-4 [DOI] [PubMed] [Google Scholar]
  • 36.Eskandari S, Wright EM, Loo DD: Kinetics of the reverse mode of the Na+/glucose cotransporter. J Membr Biol. 2005;204(1):23–32. 10.1007/s00232-005-0743-x [DOI] [PMC free article] [PubMed] [Google Scholar]
  • 37.Kedem O, Katchalsky A: Permeability of composite membranes. Part 3.—Series array of elements. Trans Faraday Soc. 1963;59:1941–53 10.1039/TF9635901941 [DOI] [Google Scholar]
  • 38.Bohlen HG: Intestinal tissue PO 2 and microvascular responses during glucose exposure. Am J Physiol. 1980;238(2):H164–71. [DOI] [PubMed] [Google Scholar]
  • 39.Bohlen HG: Na +-induced intestinal interstitial hyperosmolality and vascular responses during absorptive hyperemia. Am J Physiol. 1982;242(5):H785–9. [DOI] [PubMed] [Google Scholar]
  • 40.Vanis L, Gentilcore D, Rayner CK, et al. : Effects of small intestinal glucose load on blood pressure, splanchnic blood flow, glycemia, and GLP-1 release in healthy older subjects. Am J Physiol Regul Integr Comp Physiol. 2011;300(6):R1524–31. 10.1152/ajpregu.00378.2010 [DOI] [PubMed] [Google Scholar]
  • 41.Qamar MI, Read AE, Mountford R: Increased superior mesenteric artery blood flow after glucose but not lactulose ingestion. Q J Med. 1986;60(233):893–6. [PubMed] [Google Scholar]
  • 42.Someya N, Endo MY, Fukuba Y, et al. : Blood flow responses in celiac and superior mesenteric arteries in the initial phase of digestion. Am J Physiol Regul Integr Comp Physiol. 2008;294(6):R1790–6. 10.1152/ajpregu.00553.2007 [DOI] [PubMed] [Google Scholar]
  • 43.Granger DN, Kvietys PR, Mailman D, et al. : Intrinsic regulation of functional blood flow and water absorption in canine colon. J Physiol. 1980;307:443–51. [DOI] [PMC free article] [PubMed] [Google Scholar]
  • 44.Moran AW, Al-Rammahi MA, Arora DK, et al. : Expression of Na+/glucose co-transporter 1 (SGLT1) in the intestine of piglets weaned to different concentrations of dietary carbohydrate. Br J Nutr. 2010;104(5):647–55. 10.1017/S0007114510000954 [DOI] [PubMed] [Google Scholar]
  • 45.Nguyen NQ, Debreceni TL, Bambrick JE, et al. : Accelerated intestinal glucose absorption in morbidly obese humans - relationship to glucose transporters, incretin hormones and glycaemia. J Clin Endocrinol Metab. 2014:jc20143144. 10.1210/jc.2014-3144 [DOI] [PubMed] [Google Scholar]
  • 46.Anzueto Hernandez L, Kvietys PR, Granger DN: Postprandial hemodynamics in the conscious rat. Am J Physiol. 1986;251(1 Pt 1):G117–23. [DOI] [PubMed] [Google Scholar]
  • 47.Granger DN, Kvietys PR, Wilborn WH, et al. : Mechanism of glucagon-induced intestinal secretion. Am J Physiol. 1980;239(1):G30–8. [DOI] [PubMed] [Google Scholar]
  • 48.Parker HE, Adriaenssens A, Rogers G, et al. : Predominant role of active versus facilitative glucose transport for glucagon-like peptide-1 secretion. Diabetologia. 2012;55(9):2445–55. 10.1007/s00125-012-2585-2 [DOI] [PMC free article] [PubMed] [Google Scholar]
  • 49.Macleod RJ, Hamilton JR: Volume regulation initiated by Na(+)-nutrient cotransport in isolated mammalian villus enterocytes. Am J Physiol. 1991;260(1 Pt 1):G26–33. [DOI] [PubMed] [Google Scholar]
  • 50.Zeuthen T: Water-transporting proteins. J Membr Biol. 2010;234(2):57–73. 10.1007/s00232-009-9216-y [DOI] [PubMed] [Google Scholar]
  • 51.Naftalin RJ: Osmotic water transport with glucose in GLUT2 and SGLT. Biophys J. 2008;94(10):3912–23. 10.1529/biophysj.107.122531 [DOI] [PMC free article] [PubMed] [Google Scholar]
  • 52.Granger DN: Intestinal microcirculation and transmucosal fluid transport. Am J Physiol. 1981;240(5):G343–9. [DOI] [PubMed] [Google Scholar]
  • 53.Naftalin RJ: Reassessment of models of facilitated transport and cotransport. J Membr Biol. 2010;234(2):75–112. 10.1007/s00232-010-9228-7 [DOI] [PubMed] [Google Scholar]
F1000Res. 2015 Jan 23. doi: 10.5256/f1000research.6342.r7456

Referee response for version 1

Edith Brot-Laroche 1

In his manuscript Pr R. Naftalin questions the role of apical GLUT2 in the regulation of intestinal sugar absorption. The manuscript comprises a view of earlier studies on absorption processes and proposes a theoretical model of glucose absorption in the small intestine. Since the main molecular features of sugar transporter in the small intestine have reached consensus, this timely manuscript opens a debate on the regulation of absorption processes including glucose transport, water flow and osmolarity issues. It is an ambitious project to describe a comprehensive model of intestinal sugar absorption considering the many different levels of regulation it involves. However in this manuscript, the kinetics of  transporter expression in and out the enterocyte membranes in the control of absorption processes in sugar absorption were not taken into account in health and disease.

The manuscript starts with a summary of 50 years of research effort in this area. In early days, glucose uptake in enterocytes comprised a Na-coupled electrogenic cotransport system mediated by SGLT1 clone by EM Wright 1, and a diffusive component first identified by its resistance to phloridzin inhibition or Na free conditions and later identified as a GLUT family members 2 - 4. The nature of an epithelial diffusive component was then debated and several mechanisms were proposed including paracellular flow and the presence of facilitated diffusion transport systems in the apical membrane i.e. GLUT5 for fructose and the low affinity transporter GLUT2 for glucose, galactose, fructose and mannose 2 5. The exit of glucose from enterocytes was described to be mediated by GLUT2 in the basolateral membrane 5 - 7.

More recent discoveries showed that GLUT2 can also traffic to the apical membrane of enterocytes in humans and rodents 6 , 7. GLUT2 trafficking in the apical membrane of epithelial cells has been demonstrated using various techniques including live imaging 8 - 10. Pr. Naftalin questions the relevance of apical GLUT2 in glucose versus water absorption.

Major concerns

  1. Pr Naftalin chose to focus on GLUT2-mediated osmoregulation but somehow neglected the dynamics control of sugar transporter densities in the apical and basolateral membranes of enterocytes.  Although the mathematical modeling of this complex system is beyond my expertise, but may I suggest taking the time parameter as a key element in the control sugar absorption.

  2. Pr Naftalin reports that apical GLUT2 is not always seen, according to metabolic status of the mice or humans, an assertion that I can share with him. Indeed, apical GLUT2 is visible in animals consuming a sugar diet to increase GLUT2 expression and when glucose is abundant in the lumen. The transient presence of GLUT2 in apical membranes helps thus to understand how the intestine can absorb a large bolus of glucose that overcomes the absorption kinetic capacities of SGLT1. In pathologies altering insulin sensitivity, GLUT2 does not traffic anymore, remaining in apical membranes and increasing intestinal glucose absorption, worsening the status of subjects. In these conditions, apical GLUT2 can be readily observed. This rather simplifies the model of the transcellular transfer of glucose for apical membrane is permanently equipped with the GLUT2 transporter. The model should be amended to take these issues into account, in particular to include the varying levels of GLUT2 in the apical as well as basolateral membranes. This is also true for the SGLT1 transporter.

  3. Since transporters are also water channels 11 - 13 glucose transport will move water in the direction of the glucose gradient through the epithelial layer. Was that feature taken into account in the osmolarity model?

  4. Pr. Naftalin identifies conflicting data from my group on facilitative glucose transport, presumably by GLUT2, obtained using brush border membrane vesicles. I would like to give my interpretation of the data published at a time when transporters were characterized only by functional studies. My group identified a second transport system for glucose in addition to Na-cotransport using isolated brush border membrane vesicles, that is, in absence of interference of metabolism. The characteristics of this second system are very close to that identified later on for GLUT2 i.e. a glucose transport system with a low affinity (24 mM) and a high capacity 14. This transport is inhibited by cytochalasin B like GLUT2. In the cited papers there is no mention of phloretin inhibition. I suppose that the conflict also come from the nutritional manipulation of guinea pig 15 comparing semi-starvation (25% of control food pair feeding experiment) to ad libitum feeding, we showed that the second transport functions was increased in absence of change in the contribution of the cotransport system. At that time, the physiological mechanism underlying the effect of semi-starvation was not analyzed further. Importantly, the effect of starvation was to increase the cotransport of glucose in absence of a contribution of system 2 as expected and confirmed in our studies in mice 16. Therefore, it seems that are results are consistent over the different experimental analysis of sugar absorption and the role of GLUT2.

  5. The argument that “nonspecific transport of glucose at rates that are correlated with net fluid transport” 17 is probably inappropriate since passive diffusion was measured in vivo through the urinary recovery of ingested sugars that constitutes an evaluation of passive permeability of the whole intestine including colon. These permeability parameters can hardly be applied as valid for the diffusive component ex vivo in selected part of the small intestine.

  6. Different experimental settings for absorption measurements probably cause the discrepancies in the evaluations of transporter K m for GLUT2 and SGLT1. Based on vesicle work 18 the Km for the sodium cotransporter and for the facilitative transporter in the BBM of the jejunum is in a ratio of 2 to 25 mM respectively. In addition, studies in rat intestine of Pr Kellet’s group, show cooperativity of the kinetics of glucose transport via GLUT2 6 , 19. Figures in the model should take a better affinity ratio between SGLT1 and GLUT2 mediated transport activities. 

Minor point:

GLUT5 is not a glucose transporter in intestine but a fructose transporter. Although it can transport glucose when expressed in Xenopus laevis oocytes.

Conclusion

  1. The title should include the words “model, mathematics” to stick to the content of the manuscript

  2. This manuscript describes the development of a mathematical model of sugar absorption in the intestine, a very challenging project indeed. The main merit is to put forward the many different levels of this complex and multi-compartment mechanism.

  3. The model is specially focusing on osmolarity issues in the absorptive process, this may be too far as rapid reading can trouble the reader understanding of the primary function of the transporters, which is primarily glucose transport.

  4. A model of this type should include the recent features of sugar absorption and include a kinetic description of events including the varying density of transporters in enterocyte plasma membranes.

  5. The role of GLUT2 in pathology should be described to show what are the enhanced and/or decreased elements of the model. Indeed, the absorption phase after a meal should be distinguished from the post absorptive time when the lumen is emptied of glucose.

  6. The relative affinities of transporters involved in transepithelial transport need to be corrected to stick to a ratio of affinities measured under the same experimental setting.

I have read this submission. I believe that I have an appropriate level of expertise to confirm that it is of an acceptable scientific standard, however I have significant reservations, as outlined above.

References

  • 1.Hediger MA, Coady MJ, Ikeda TS, Wright EM: Expression cloning and cDNA sequencing of the Na+/glucose co-transporter. Nature.1987;330(6146) : 304379-381 10.1038/330379a0Reference source [DOI] [PubMed] [Google Scholar]
  • 2.Thorens B: Molecular and cellular physiology of GLUT-2, a high-Km facilitated diffusion glucose transporter. Int Rev Cytol.1992;137:209-238 [DOI] [PubMed] [Google Scholar]
  • 3.Joost HG, Bell GI, Best JD, Birnbaum MJ, Charron MJ, Chen YT, Doege H, Lodish HF, Moley JF, Mueckler M, Rogers S, Schurmann A, Seino S, Thorens B: Nomenclature of the GLUT/SLC2A family of sugar/polyol transport facilitators. Am J Physiol Endocrinol Metab.2002;282(4) : 304E974-E976 10.1152/ajpendo.00407.2001Reference source [DOI] [PubMed] [Google Scholar]
  • 4.Bell GI, Kayano T, Buse JB, Burant CF, Takeda J, Lin D, Fukumoto H, Seino S: Molecular biology of mammalian glucose transporters. Diabetes Care.1990;13(3) :198-208 [DOI] [PubMed] [Google Scholar]
  • 5.Cheeseman CI: GLUT2 is the transporter for fructose across the rat intestinal basolateral membrane. Gastroenterology.1993;105(4) :1050-1056 [DOI] [PubMed] [Google Scholar]
  • 6.Kellett GL, Brot-Laroche E: Apical GLUT2: a major pathway of intestinal sugar absorption. Diabetes.2005;54(10) : 3043056-3062 10.2337/diabetes.54.10.3056Reference source [DOI] [PubMed] [Google Scholar]
  • 7.Kellett GL, Brot-Laroche E, Mace OJ, Leturgue A: Sugar absorption in the intestine: the role of GLUT2. Annu Rev Nutr.2008;28: 30435-54 10.1146/annurev.nutr.28.061807.155518.Reference source [DOI] [PubMed] [Google Scholar]
  • 8.Cohen M, Kitsberg D, Tsytkin S, Shulman M, Aroeti B, Nahmias Y: Live imaging of GLUT2 glucose-dependent trafficking and its inhibition in polarized epithelial cysts. Open Biol.2014;4(7) : 304 10.1098/rsob.140091Reference source [DOI] [PMC free article] [PubMed] [Google Scholar]
  • 9.Helliwell PA, Richardson M, Affleck J, Kellett GL: Regulation of GLUT5, GLUT2 and intestinal brush-border fructose absorption by the extracellular signal-regulated kinase, p38 mitogen-activated kinase and phosphatidylinositol 3-kinase intracellular signalling pathways: implications for adaptation to diabetes. Biochem J.2000;350(Pt 1) :163-169Reference source [PMC free article] [PubMed] [Google Scholar]
  • 10.Kellett GL, Helliwell PA: The diffusive component of intestinal glucose absorption is mediated by the glucose-induced recruitment of GLUT2 to the brush-border membrane. Biochem J.2000;350(Pt 1) :155-162Reference source [PMC free article] [PubMed] [Google Scholar]
  • 11.Zeuthen T, Meinild AK, Loo DD, Wright EM, Klaerke DA: Isotonic transport by the Na+-glucose cotransporter SGLT1 from humans and rabbit. J Physiol.2001;531(Pt 3) : 304631-644 10.1111/j.1469-7793.2001.0631h.xReference source [DOI] [PMC free article] [PubMed] [Google Scholar]
  • 12.Zeuthen T, Zeuthen E, Macaulay N: Water transport by GLUT2 expressed in Xenopus laevis oocytes. J Physiol.2007;579(Pt 2) : 304345-361 10.1113/jphysiol.2006.123380Reference source [DOI] [PMC free article] [PubMed] [Google Scholar]
  • 13.Loo DD, Zeuthen T, Chandy G, Wright EM: Cotransport of water by the Na+/glucose cotransporter. Proc Natl Acad Sci U S A.1996;93(23) :13367-13370Reference source [DOI] [PMC free article] [PubMed] [Google Scholar]
  • 14.Brot-Laroche E, Serrano MA, Delhomme B, Alvarado F: Different temperature sensitivity and cation specificity of two distinct D-glucose/Na+ cotransport systems in the intestinal brush-border membrane. Ann N Y Acad Sci.1985;456: 30447-50 10.1111/j.1749-6632.1985.tb14843.xReference source [DOI] [PubMed] [Google Scholar]
  • 15.Brot-Laroche E, Dao MT, Alcalde AI, Delhomme B, Triadou N, Alvarado F: Independent modulation by food supply of two distinct sodium-activated D-glucose transport systems in the guinea pig jejunal brush-border membrane. Proc Natl Acad Sci U S A.1988;85(17) :6370-6373Reference source [DOI] [PMC free article] [PubMed] [Google Scholar]
  • 16.Gouyon F, Caillaud L, Carriere V, Klein C, Dalet V, Citadelle D, Kellett GL, Thorens B, Leturque A, Brot-Laroche E: Simple-sugar meals target GLUT2 at enterocyte apical membranes to improve sugar absorption: a study in GLUT2-null mice. J Physiol.2003;552(Pt 3) : 304823-832 10.1113/jphysiol.2003.049247Reference source [DOI] [PMC free article] [PubMed] [Google Scholar]
  • 17.Bijlsma PB, Fihn BM, Sjoqvist A, Groot JA, Taminiau JA, Jodal M: Water absorption enhances the uptake of mannitol and decreases Cr-EDTA/mannitol permeability ratios in cat small intestine in situ. Scand J Gastroenterol.2002;37(7) :799-806 [PubMed] [Google Scholar]
  • 18.Brot-Laroche E, Serrano MA, Delhomme B, Alvarado F: Temperature sensitivity and substrate specificity of two distinct Na+-activated D-glucose transport systems in guinea pig jejunal brush border membrane vesicles. J Biol Chem.1986;261(14) :6168-6176Reference source [PubMed] [Google Scholar]
  • 19.Helliwell PA, Kellett GL: he active and passive components of glucose absorption in rat jejunum under low and high perfusion stress. J Physiol.2002;544(Pt 2) : 304579-589 10.1113/jphysiol.2002.028209Reference source [DOI] [PMC free article] [PubMed] [Google Scholar]
F1000Res. 2015 Jan 28.
Richard J Naftalin 1

Dear Prof. Brot Laroche (Edith, EBL)

Thank you for your comments with regard to my commentary about the role of apical GLUT2 in intestinal glucose absorption.     Your comment on the time scale of the changes is an important issue which I did not fully consider in my initial treatment but clearly worth addressing and I will do this now.

The nice diagram (figure 5) in your paper (Ait-Omar et al. 2011) summarizes your view on the dynamics and routes of intestinal glucose absorption.  The paracellular pathway is notably absent from this analysis.  However as I have already mentioned in my answer to GK this is an important route in humans and has relevance to the question of the developing rates of intestinal glucose following acute luminal exposure to glucose during continuous infusion by duodenal gavage (Vanis et al. 2011).  

There are several components with widely differing rates of equilibration relevant to quantitative description of luminal glucose absorption.  First, the rate of delivery to the surface mucosa;  this can be viewed as a rate of change of glucose concentration at a single point, or considered as an integral of the glucose content distributed over the entire absorptive surface.  In considering the latter view, the more distal regions of small intestine will be exposed later than the proximal and to a smaller overall load.  This rarely considered point is treated with simple approximation by Pappenheimer  (Pappenheimer 1998).

Obviously the rate of change of the integral glucose concentration along the entire length of small intestine will be much slower, than the rate as estimated   at the proximal end. 

Link to figure S1

  With acute exposure to luminal glucose to 30mM, as modelled in figure S1 A and B luminal glucose concentration is simulated with an exponential rise with a t ½ ≈ 1-2min.  This includes the mixing time within the lumen and diffusion through the unstirred layer to the enterocyte absorptive surface.  Two other major rate processes determine net glucose absorption at the proximal end of the jejunum: the rate of glucose accumulation within the enterocyte cytosol, is difficult to measure in situ, but is assumed to be the main determinant of the rate of glucose absorption. The rate reported in isolated chicken intestinal epithelial cells (Kimmich 1968) has a t ½ ≈ 1-2min.  In vivo this rate likely to be faster   as the force determining this rate is ultimately governed by Na-K ATPase activity which depends on the cell metabolic rate.   The other secondary   rates   determining   cytosolic glucose concentration are mainly via GLUT2 at both apical and baso-lateral membranes and the paracellular pathway.  

Kellett & Helliwell (Kellett & Helliwell 2000) indicate that apical GLUT2 increases as a double exponential,  a small faster component ( t ½ ≈ 1-2min) and a larger slow  component (t ½ ≈ 77 min). I have replaced this double exponential with   a single rate constant (t ½ = 12 min) to describe the glucose stimulated increase in GLUT2 density at the apical membrane.  The signal for increased apical is initiated when cytosolic glucose concentration >25mM.  This occurs ≈ 1 min after exposure to 30mM luminal glucose.  The simulation shows the effects of three steady state apical GLUT2 densities (0, 1 and 2 nominal units) (Figure 2 A and B). 

In the absence of apical GLUT2 glucose flux via GLUT2 is zero(red lines).  As the density of GLUT2 increases,  following an initial delay, the glucose flux becomes increasing more negative,  reaching a steady state  within ≈ 20 min. This increasing rate of glucose efflux is caused entirely by the slow rise in apical GLUT2 density.  (Lower three lines Figure S1A).  

Of particular note in this simulation are the transient changes in paracellular glucose flux.  As apical GLUT2 density increases, paracellular glucose flux also increases.  This is a consequence of the reduced transcellular glucose flux, which increases the glucose concentration gradient between the lumen and submucosal interstitial fluid; as previously noted (figures 2 and 4). 

The rate constants resulting from the luminal mixing and cytosolic accumulation almost entirely mask any observable glucose influx via GLUT2   occurring during the early phase of intestinal absorption, as envisaged by (Ait-Omar et al 2011) when the cytosol and submucosal glucose < luminal glucose.

EBL “  Since transporters are also water channels  11 - 13  glucose transport will move water in the direction of the glucose gradient through the epithelial layer. Was that feature taken into account in the osmolarity model?”

This question is extremely interesting- to me certainly -(see refs (50,51).  It is evident that water is cotransported via a number of solute cotransporters particularly SGLT1 and GLUT2, but also NKCC(50).  From other model  simulations (not shown) it is apparent that water cotransport  makes no substantial difference to the rates of glucose or Na transport,  but greatly affects glucose and Na-dependent water flows  (not shown). 

Another  noteworthy matter regarding water cotransport concerns the the question  how, when nectarivores  imbibe more than three times their body weight of water per day with little salt content,  they avoid becoming overhydrated.  A solution appears to be that most of the water is retained within the intestinal lumen and excreted via the cloaca rather than kidneys (Karasov & Cork 1994; Caviedes-Vidal et al. 2007; McWhorter et al. 2013). A likely explanation for fluid retention within their gut lumen appears to be that the paracellular glucose diffusion component is maintained at high levels by the by very high metabolic rates and very high rates of splanchnic perfusion.  The  absence of water cotransport by glucose via the paracellular route is likely to be due to its very low reflection coefficient. Thus it is likely that  high paracellular glucose absorption in hummingbirds also prevents glucose from being absorbed via the transcellular route and thereby preventing excessive water absorption.   

 EBL “The argument that “nonspecific transport of glucose at rates that are correlated with net fluid transport” 17 is probably inappropriate since passive diffusion was measured in vivo through the urinary recovery of ingested sugars that constitutes an evaluation of passive permeability of the whole intestine including colon. These permeability parameters can hardly be applied as valid for the diffusive component ex vivo in selected part of the small intestine.” 

This is a question about which I have no expertise.  However, it is probably inaccurate to say that the dual or multi sugar method does not give site-specific gastrointestinal permeability analysis, as has recently been shown (van Wijck et al. 2013).   

EBL  “The relative affinities of transporters involved in transepithelial transport need to be corrected to stick to a ratio of affinities measured under the same experimental setting. ”


In my answer to GK I explained that the assigned transporter parameters within the model relating to affinities are very similar to those obtained with isolated transporters tested in optimal conditions. The apparent operational affinities may differ greatly from the ideal conditions, as the concentrations of transported ligands cannot be held constant in the trans compartment(s) when the intestine is operating at near steady state absorption rates.  

EBL The role of GLUT2 in pathology should be described to show what are the enhanced and/or decreased elements of the model. Indeed, the absorption phase after a meal should be distinguished from the post absorptive time when the lumen is emptied of glucose”. 

I would like to extend the model to various pathological situations, particularly T2D and hepatic cirrhosis and fatty degeneration and their relationships with obesity.   However this would require extension of the model to include hepatic glucose uptake and circulation (Alexander et al. 2001; Alexander et al. 2002; Li et al. 2003).  However it is evident   from the simple (relatively) analysis outlined already that the local densities of transporters are not the only factor that determines the amplitude of glucose concentration and flow within the splanchnic vascular bed.  Another very important factor which has not been given enough attention is the extent of apical transporter distribution within the intestine and how this affects glucose absorption.  


If one assumes that the distribution of SGLT1 and GLUT2 normally covers 30-40% of the available small intestine area  ( 4200 cm -2) (Pappenheimer 1998; Soergel et al. 1968) i.e. 1000-1500 cm -2 then the maximal absorption rate for the entire intestine is approximately 1.0  mmole min -1.   When considered at the level of an individual cell unit, when luminal glucose concentration is high > 30mM,  increased  apical membrane SGLT1densities  will not greatly alter net transcellular absorption,   as this is rate limited by GLUT2 densities in the basolateral membranes and saturation of GLUT2 due to high cytosolic glucose.  Additionally,  as already explained increased apical GLUT2 expression  reduces net transcellular glucose flux   cm -2 of intestine.


The observed increase in the area of intestinal SGLT1 distribution with enhanced carbohydrate intake becomes an important factor in total glucose absorption  (Ferraris et al. 1992; Moran et al. 2010). The extent of SGLT1 and GLUT2 distribution within the intestinal   increases both along the crypt-villus axis and along the small intestinal  longitudinal axis   with enrichment of  carbohydrate intake.  As previously discussed apical GLUT2 expression will spread the luminal glucose load over a wider area, so the increased GLUT2 expression along with SGLT1 could lead to higher rates integrated rate of glucose absorption. This as has been noted already may lead to chronic liver damage.  

References

 Ait-Omar, A. et al., 2011. GLUT2 accumulation in enterocyte apical and intracellular membranes: a study in morbidly obese human subjects and ob/ob and high fat-fed mice. Diabetes, 60(10), pp.2598–607.  

Alexander, B., Cottam, H. & Naftalin, R., 2001. Hepatic arterial perfusion regulates portal venous flow between hepatic sinusoids and intrahepatic shunts in the normal rat liver in vitro. Pflügers Archiv : European journal of physiology, 443(2), pp.257–64.  

Alexander, B., Rogers, C. & Naftalin, R., 2002. Hepatic arterial perfusion decreases intrahepatic shunting and maintains glucose uptake in the rat liver. Pflügers Archiv : European journal of physiology, 444(1-2), pp.291–8.  

Caviedes-Vidal, E. et al., 2007. The digestive adaptation of flying vertebrates: high intestinal paracellular absorption compensates for smaller guts. Proceedings of the National Academy of Sciences of the United States of America, 104(48), pp.19132–19137.

Ferraris, R.P. et al., 1992. Effect of diet on glucose transporter site density along the intestinal crypt-villus axis. The American journal of physiology, 262, pp.G1060–G1068.

Karasov, W.H. & Cork, S.J., 1994. Glucose absorption by a nectarivorous bird: the passive pathway is paramount. The American journal of physiology, 267, pp.G18–G26.

Kellett, G.L.& Helliwell, P.A., 2000. glucose-induced recruitment of GLUT2 to the brush-border membrane. Biochem J, 162, pp.155–162.

Kimmich, G.A., 1968. Active Sugar Accumulation by Isolated Intestinal Epithelial Cells . Biochemistry, 9, pp.3669–3677.

Li, X. et al., 2003. Location and function of intrahepatic shunts in anaesthetised rats. Gut, 52(9), pp.1339–46.  

McWhorter, T.J. et al., 2013. Paracellular Absorption Is Relatively Low in the Herbivorous Egyptian Spiny-Tailed Lizard, Uromastyx aegyptia. PLoS ONE, 8(4).

Moran, A.W. et al., 2010. Expression of Na+/glucose co-transporter 1 (SGLT1) in the intestine of piglets weaned to different concentrations of dietary carbohydrate. The British journal of nutrition, 104(5), pp.647–55.  

Pappenheimer, J.R., 1998. Scaling of dimensions of small intestines in non-ruminant eutherian mammals and its significance for absorptive mechanisms. Comparative Biochemistry and Physiology - A Molecular and Integrative Physiology, 121, pp.45–58.

Soergel, K.H., Whalen, G.E. & Harris, J. a, 1968. Passive movement of water and sodium across the human small intestinal mucosa. Journal of applied physiology (Bethesda, Md. : 1985), 24(1), pp.40–48.

Vanis, L. et al., 2011. Effects of small intestinal glucose load on blood pressure, splanchnic blood flow, glycemia, and GLP-1 release in healthy older subjects. American journal of physiology. Regulatory, integrative and comparative physiology, 300(5), pp.R1524–R1531.

Van Wijck, K. et al., 2013. Novel multi-sugar assay for site-specific gastrointestinal permeability analysis: A randomized controlled crossover trial. Clinical Nutrition, 32(2), pp.245–251.

F1000Res. 2015 Jan 20. doi: 10.5256/f1000research.6342.r7045

Referee response for version 1

Hannelore Daniel 1

This paper by R. Naftalin addresses a facet of gastrointestinal physiology that has for decades caused highly controversial discussions amongst the experts. Carbohydrates in our diet represent the quantitatively most important class of nutrients and a large fraction of our daily caloric intake. After digestion in the upper small intestine glucose derived from starch, glycogen, sucrose and lactose is the nutrient with the highest absorption rate of all dietary components and yet, we still do not understand in details how this is accomplished. There is no doubt that the rheogenic SGLT1 transporter in the brush border membrane is of prime importance and this is known from studies utilizing phloridzin that inhibits SGLT1 with high affinity, from humans suffering from hereditary glucose-galactose malabsorption and from mice lacking a functional SGLT1 protein. One of the critical issues is that SGLT1 when expressed heterologously in a target cell has a very high affinity whereas when glucose absorption is assessed in vivo either in rodents or in human intestinal perfusion studies affinities reported are one to two orders of magnitude lower. This discrepancy has been the starting point to search for additional glucose transporters that might be involved. Based on studies in rat intestine G. Kellett finally proposed that at very high luminal glucose concentrations SGLT1 transport function would induce a signalling cascade involving PKC that in turn would cause the recruitment of GLUT2 (a low affinity type uniporter) into the apical membrane from intracellular vesicles. This would allow glucose to move into the cell along a concentration gradient with GLUT2 simultaneously mediating also efflux across the basolateral side as the prime glucose transporting protein constitutively present in this membrane domain. However, as a uniporter GLUT2 could when incorporated into the apical membrane also cause a back-flux of glucose into the intestinal lumen in particular since SGLT1 allows uphill transport of glucose by its rheogenic transport mode. Since all biochemical studies published so far do not give conclusive and convincing data on whether GLUT2 can translocate into the apical membrane and thus contribute to overall glucose absorption, R. Naftalin now takes a modelling approach to assess how feasible a significant contribution of GLUT2 is. Since movement of bulk quantities of solutes (glucose and sodium) by the glucose transporters also induces osmotic gradients and in turn water movement, the conceptual work and the simulations presented also address water movement this as well as blood flow effects. 


A model has been build that is plausible and reveals the knowledge base of the author. This model allows changes in a variety of parameters to be visualized for the different compartments when glucose concentrations are increased. Simulations reveal that accumulation of glucose in the cytosol of intestinal epithelial cells mediated by SGLT1 is accompanied by increases in the cytosolic volume whereas an increased density of apical GLUT2 would prevent excessive glucose accumulation at high luminal glucose concentrations by back-flux that would also reduce the enterocyte volume increase. In this context GLUT2 fulfils primarily the role of an osmoregulator in controlling epithelial cell volume that is subject to rapid changes when bulk quantities of the solutes are absorbed. Although the work by R. Naftalin does not prove or disprove that GLUT2 has a important function in overall glucose absorption, it adds some novel ideas and other dimensions to the discussion. GLUT2 and its role in intestinal epithelial cells thus remains a mystery not only in its proposed function in the apical membrane but also for basolateral glucose efflux.

I have read this submission. I believe that I have an appropriate level of expertise to confirm that it is of an acceptable scientific standard.

F1000Res. 2015 Jan 19. doi: 10.5256/f1000research.6342.r7370

Referee response for version 1

George Kellett 1

BACKGROUND

Numerous papers over eight decades since 1935 have reported that intestinal glucose absorption comprises two components, one secondary active and mediated by SGLT1, the other a highly regulated “diffusive” component occurring predominantly at concentrations well above those required to saturate SGLT1. In 1987, Pappenheimer proposed that the “diffusive” component was mediated by SGLT1-dependent solvent-induced paracellular flow through tight junctions, as a result of the concentration of glucose up to ~300 mM in the intercellular spaces 2. The field was split by the ensuing debate in which Diamond and Ferraris contested the concept of paracellular flow 3 - 6. In so doing, they implied that SGLT1 is the only pathway of glucose absorption and denied the existence of two components.

Subsequently, Kellett’s (my) laboratory proposed that the “diffusive” component is mediated by the glucose- and SGLT1-dependent transient insertion of the low affinity basolateral transporter GLUT2 into the apical membrane at high glucose concentrations, so that GLUT2 then mediated a major pathway of transcellular glucose absorption 7 - 9. Detailed mechanisms for the regulation of apical GLUT2 insertion by diet, sugars, peptides, Ca 2+, artificial sweeteners, hormones and obesity have been described 10 - 18. In effect, the apical GLUT2 model replaced paracellular flow and the impasse in the long-standing debate seemed resolved.

Nevertheless, as cited, some workers have recently reported difficulty detecting apical GLUT2. They therefore continued to deny the existence of any significant pathway other than SGLT1. In fact, the known properties of apical GLUT2 dietary regulation explain both cases. In the report by Gorboulev et al. 19 , 20 mice were starved, which reduces apical GLUT2 and enhances SGLT1; mice also have higher SGLT1 activities than rat. In the report by Roder et al.  21 using SGLT1 knockout mice, KO and wild-type animals were necessarily maintained on sugar-free diets, which are well known to diminish apical GLUT2 greatly. 17

A NOVEL PARACELLULAR FLOW PROPOSAL

Professor Naftalin has undertaken the truly daunting task of seeking to provide a comprehensive, integrated model of intestinal glucose absorption. He accepts there are two components of glucose absorption and also that GLUT2 is transiently inserted into the apical membrane. However, in a further twist to the debate, he seeks to reinstate a central role for paracellular flow and thereby reinterpret that of apical GLUT2.

In essence, it is proposed that glucose transport through SGLT1 results in accumulation of cytosolic glucose to supraluminal concentrations in enterocytes. At that point, net absorption of glucose through apical GLUT2 switches to net secretion of accumulated glucose through apical GLUT2 into the lumen; it is then transported across the epithelium by a paracellular channel, along with other luminal glucose. Apical GLUT2 therefore acts, not as a direct transcellular transporter, but as a shunt to supply a major paracellular pathway of transepithelial absorption.

Paracellular flow

The proposal depends absolutely on the view that paracellular flow of glucose through tight junctions exists and, furthermore, that it occurs with rates comparable to observed luminal disappearance in perfusions in vivo. However, the concept of paracellular flow advanced by Pappenheimer lost favour during the debate with Diamond and Ferraris 22. In particular, they argued convincingly that paracellular markers, if they cross the intestinal barrier at all, do so only in low amounts after experiments of many hours or even longer, when the integrity of tissue becomes questionable. Even in cited example of cat, reported paracellular flow of glucose is only ~10% of glucose absorption. Thus the rate of absorption of paracellular markers is minimal to negligible compared with that for glucose.

Nevertheless, because of its potential importance, my laboratory made strenuous attempts to detect paracellular flow 12. Mannitol, the “gold standard” of paracellular markers was used, since L-glucose has a low affinity for SGLT1. Rats were maintained on a high carbohydrate diet and food was flushed from jejunum just before perfusion in vivo; the perfusion was single pass at low flow rate and net glucose absorption (total absorption minus secretion) was determined chemically as luminal disappearance. At 75 mM luminal glucose, the steady-state rate of glucose absorption was established within just 15 min and was some 200-fold greater than for mannitol; see Table 1 of ref 12. “Closing” tight junctions by inhibiting myosin phosphorylation had no effect on mannitol clearance; nor did clearance change over a wide range of glucose concentrations at constant osmolarity (balanced with mannitol to 75 mM total sugar). Changes in water absorption correlated with changes in rapidly inserted apical GLUT2, not mannitol clearance.

Studies from other groups lead to same conclusion. In the work of Brot-Laroche and colleagues on apical GLUT2, fructose transport studies were done in vesicles 17; paracellular flow could not be involved.  Apical GLUT2 mediated 60% of fructose transport, the rest was by GLUT5. The results with GLUT2 knockout mice correlated well with fructose and glucose perfusion data, one could be predicted from the other. Since GLUT5 and GLUT2 are facilitative transporters, there can be no concentration of the transcellular gradient in vivo, yet fructose absorption at high luminal concentrations  in vivo shows the same apparent linearity as glucose 2.

Resistin 23 and metformin 24 promote AMP-mediated rapid insertion of apical GLUT2 in mice and rat to result in an increase in associated glucose absorption; there is no effect on minimal mannitol clearance. Notably, SGLT1 membrane density and ∆Isc were halved. This switch away from SGLT1 at high glucose concentrations was first observed in a study with the powerful AMP-kinase activator, AICAR, which induces a 3-fold increase in glucose absorption through a comparable increase in apical GLUT2 25. Simultaneously, SGLT1 is degraded to such an extent as to be almost undetectable (within ~30 min), so that only GLUT2 is at the apical membrane. The switch to the facilitative, energy-independent apical GLUT2 may represent a response to energy stress as the energy-dependent SGLT1 reaches maximal capacity.

Reports that paracellular flow is minimal to negligible under the conditions of apical GLUT2 studies have not been cited. Nor have any new experimental data been presented to change the debate on paracellular flow. The integrity of the intestinal barrier is paramount, as immunologists surely agree.

Intestinal transport is simulated with a computer-based model

The novel paracellular flow proposal is based entirely on computer simulation of what is described as a “multiplicity and complexity of interactive processes”. As the extensive mathematical appendix so lucidly shows, simulation depends on many steps and their interactions, the choice of many parameters and their values, the concentrations of glucose and Na + at specific places within various compartments, and so on. Inevitably, a serious issue is that some, possibly most, values are of great uncertainty or simply unknown.

Two key examples suffice to make the point. The K t of glucose for SGLT1 is taken as 17 mM, in contrast to reports of 23 26 and 26 mM 7  in vivo. The K t of GLUT2 is also taken as 17 mM, reported for expression in oocytes. In contrast, the  value of 56 ± 14 mM, based on an empirical sigmoid curve analysis of in vivo data 7, is described as “very high”, implying the “diffusive” component is not GLUT2 but paracellular flow. In fact, the K t of GLUT2 for uptake is 48 ± 5 mM for basolateral membrane vesicle preparations 27. Moreover, the question of asymmetry in this bidirectional transporter seems not to have been addressed: V max for uptake is ~6-fold greater than for efflux 27. Such differences and uncertainties for most parameters surely have a considerable impact on simulation. Indeed, simply taking the K t values of SGLT1 and GLUT2 to be the same as each other and much lower than the literature consensus strongly biases simulation outcome.

Transcellular Glucose Gradients In Vivo

It is widely accepted that secondary active transport by SGLT1 results in glucose accumulation to enterocyte concentrations greater than in the lumen of intestinal preparations in vitro. This is because the K t for SGLT1 is very much lower than in vivo (sub mM v 26 mM) and because preparations such as everted sacs have poor clearance. The question is whether glucose accumulation occurs in vivo. If, as the balance of evidence indicates, there is negligible paracellular flow, then the transcellular gradient must be downhill (l-m-s) when luminal concentrations are high. Other evidence supporting this conclusion has been reviewed 3 - 5.

Recycling of Glucose and Na + Across Intestine

Recycling of certain key nutrients across the intestine is vital to its function. Thus Na + is recycled paracellularly to the lumen at high rates through claudin-15, to support continued activity of SGLT1 and other Na +-dependent transporters 28. Knockout of claudin-15 results in abnormally low luminal Na + (~8 mM v ~57 mM for wild-type) and a large impairment in glucose absorption (∆Isc). Recycling of Na + is important when luminal glucose concentrations are low, e.g. between meals or overnight, in starvation and desquamation. Thus SGLT1 is the only transporter capable of driving glucose uphill against its gradient to plasma and therefore preventing loss of glucose by secretion through apical GLUT2.

Conversely, glucose is important for Na + recovery.  A clear example is streptozocin-diabetes, which is characterised by hyperglycaemia and hyponatraemia; a permanently high level of apical GLUT2 is also found in diabetic rats 29. When luminal glucose is less than in plasma, secretion through apical GLUT2 16 is three-fold greater in diabetic than in normal rats and is increased by phloridzin 30. Thus recycling of glucose through apical GLUT2 is associated with recovery of Na + through SGLT1, providing potential compensation for loss of Na + by urinary excretion in diabetes. SGLT1 will also play a role in recovery of water secreted by apical GLUT2.

In the scenarios just outlined, there is clear physiological advantage to secretion of either Na + or glucose in their mutual recovery at low luminal concentrations. At high concentrations in the absence of paracellular flow, the switch to facilitated transcellular absorption through apical GLUT2 would be energy efficient and, as noted for periods of energy stress, might even be accompanied by a reduction of energy-dependent SGLT1. All that is required is a natural reversal of the transcellular concentration gradient in response to a fresh luminal glucose load. Energy-linked recycling of metabolic substrates used to be thought of as a waste of energy, a so-called “futile cycle.” It is now recognised as an amplification mechanism for rapid mobilisation of fresh substrate, or, by analogy, uptake of incoming glucose when absorption and secretion are initially comparable at low luminal glucose concentrations.

In addition to its roles as a transporter and in the mutual recovery of Na + and glucose, SGLT1 plays a major role in regulating apical GLUT2.

SUMMARY

  1. This paper highlights the sheer complexity of developing an integrated model of intestinal glucose absorption. Such contributions to the literature are rare; they are valuable for forcing us to think about many things that we have yet to learn about, including apical GLUT2 and the in vivo situation, and to promote debate. Significant issues are inevitable, though, when such an ambitious objective is in mind.

  2. The novel model places paracellular flow at the heart of intestinal glucose absorption. However, new experimental evidence necessary to justify such a role is not presented. The account of the debate on paracellular flow is very selective and gives the erroneous impression that the concept is widely accepted. At best, it is controversial. A fuller account should be given.

  3. Specifically, recent papers from several groups report that paracellular flow is minimal under the conditions of apical GLUT2 studies, when large changes in absorption, apical GLUT2 and even SGLT1 are seen. Reinterpretation of apical GLUT2 data to support the novel paracellular flow model is not possible.

  4. Simulation results are presented for just one luminal glucose concentration (50 mM) and two rather selective values of K m for key transporters; there is no consideration of GLUT2 asymmetry. A much wider range of factors, concentrations and parameter values should be explored, including the absence of paracellular flow.

  5. There is significant literature evidence to support the view that, when the glucose concentration in the lumen is much higher than in plasma, the transcellular glucose gradient (l-m-s) is downhill all the way in vivo. The differences between in vivo and in vitro situations should be clarified.

  6. Emphasis on recycling of glucose through apical GLUT2 has been as a shunt to serve paracellular flow. Evidence that recycling of glucose and Na + through SGLT1 is vital to intestinal function should be included.

  7. New title? “Computer simulation of an integrative model of intestinal glucose absorption”

I have read this submission. I believe that I have an appropriate level of expertise to confirm that it is of an acceptable scientific standard, however I have significant reservations, as outlined above.

References

  • 1.Donhoffer S: Über die elektive resorption der zucker. Arch Exp Pathol u Pharmakol.1935;177:689-692 [Google Scholar]
  • 2.Pappenheimer JR, Reiss KZ: Contribution of solvent drag through intercellular junctions to absorption of nutrients by the small intestine of the rat. J Membr Biol.1987;100(2) :123-136 [DOI] [PubMed] [Google Scholar]
  • 3.Kellett GL: The facilitated component of intestinal glucose absorption. J Physiol.2001;531(Pt 3) : 304585-595 10.1111/j.1469-7793.2001.0585h.xReference source [DOI] [PMC free article] [PubMed] [Google Scholar]
  • 4.Kellett GL, Brot-Laroche E: Apical GLUT2: a major pathway of intestinal sugar absorption. Diabetes.2005;54(10) : 3043056-3062 10.2337/diabetes.54.10.3056Reference source [DOI] [PubMed] [Google Scholar]
  • 5.Kellett GL, Brot-Laroche E, Mace OJ, Leturgue A: Sugar absorption in the intestine: the role of GLUT2. Annu Rev Nutr.2008;28: 30435-54 10.1146/annurev.nutr.28.061807.155518.Reference source [DOI] [PubMed] [Google Scholar]
  • 6.Kellet GL: Alternative perspective on intestinal calcium absorption: proposed complementary actions of Ca(v)1.3 and TRPV6. Nutr Rev.2011;69(7) : 304347-370 10.1111/j.1753-4887.2011.00395.x [DOI] [PubMed] [Google Scholar]
  • 7.Kellett GL, Helliwell PA: The diffusive component of intestinal glucose absorption is mediated by the glucose-induced recruitment of GLUT2 to the brush-border membrane. Biochem J.2000;15(Pt 1) :155-162Reference source [PMC free article] [PubMed] [Google Scholar]
  • 8.Helliwell PA, Richardson M, Affleck J, Kellett GL: Stimulation of fructose transport across the intestinal brush-border membrane by PMA is mediated by GLUT2 and dynamically regulated by protein kinase C. Biochem J.2000;350(Pt 1) :149-154Reference source [PMC free article] [PubMed] [Google Scholar]
  • 9.Helliwell PA, Richardson M, Affleck J, Kellett GL: Regulation of GLUT5, GLUT2 and intestinal brush-border fructose absorption by the extracellular signal-regulated kinase, p38 mitogen-activated kinase and phosphatidylinositol 3-kinase intracellular signalling pathways: implications for adaptation to diabetes. Biochem J.2000;350(Pt 1) :163-169Reference source [PMC free article] [PubMed] [Google Scholar]
  • 10.Helliwell PA, Kellet GL: The active and passive components of glucose absorption in rat jejunum under low and high perfusion stress. J Physiol.2002;544(Pt 2) : 304579-589 10.1113/jphysiol.2002.028209Reference source [DOI] [PMC free article] [PubMed] [Google Scholar]
  • 11.Helliwell PA, Rumsby MG, Kellet GL: Intestinal sugar absorption is regulated by phosphorylation and turnover of protein kinase C betaII mediated by phosphatidylinositol 3-kinase- and mammalian target of rapamycin-dependent pathways. J Biol Chem.2003;278(31) : 30428644-28650 10.1074/jbc.M301479200Reference source [DOI] [PubMed] [Google Scholar]
  • 12.Mace OJ, Morgan EL, Affleck JA, Lister N, Kellett GL: Calcium absorption by Cav1.3 induces terminal web myosin II phosphorylation and apical GLUT2 insertion in rat intestine. J Physiol.2007;580(Pt 2) : 304605-616 10.1113/jphysiol.2006.124784Reference source [DOI] [PMC free article] [PubMed] [Google Scholar]
  • 13.Morgan EL, Mace OJ, Affleck J, Kellett GL: Apical GLUT2 and Cav1.3: regulation of rat intestinal glucose and calcium absorption. J Physiol.2007;580(Pt 2) : 304593-604 10.1113/jphysiol.2006.124768Reference source [DOI] [PMC free article] [PubMed] [Google Scholar]
  • 14.Mace OJ, Affleck J, Patel N, Kellett GL: Sweet taste receptors in rat small intestine stimulate glucose absorption through apical GLUT2. J Physiol.2007;582(Pt 1) : 304379-392 10.1113/jphysiol.2007.130906Reference source [DOI] [PMC free article] [PubMed] [Google Scholar]
  • 15.Mace OJ, Lister N, Morgan E, Shepherd E, Affleck J, Helliwell P, Bronk JR, Kellett GL, Meredith D, Boyd R, Pieri M, Bailey PD, Pettcrew R, Foley D: An energy supply network of nutrient absorption coordinated by calcium and T1R taste receptors in rat small intestine. J Physiol.2009;587(Pt 1) : 304195-210 10.1113/jphysiol.2008.159616Reference source [DOI] [PMC free article] [PubMed] [Google Scholar]
  • 16.Ait-Omar A, Monteriro-Supulveda M, Poitou C, Le Gall M, Cotillard A, Gilet J, Garbin K, Houllier A, Chateau D, Lacombe A, Veyrie N, Hugol D, Tordjman J, Magnan C, Serradas P, Clément K, Leturgue A, Brot-Laroche E: GLUT2 accumulation in enterocyte apical and intracellular membranes: a study in morbidly obese human subjects and ob/ob and high fat-fed mice. Diabetes.2011;60(10) : 3042598-2607 10.2337/db10-1740Reference source [DOI] [PMC free article] [PubMed] [Google Scholar]
  • 17.Gouyon F, Caillaud L, Carriere V, Klein C, Dalet V, Citadelle D, Kellett GL, Thorens B, Leturgue A, Brot-Laroche E: Simple-sugar meals target GLUT2 at enterocyte apical membranes to improve sugar absorption: A study in GLUT2-null mice. J Physiol.2003;552(Pt 3) : 304823-832 10.1113/jphysiol.2003.049247Reference source [DOI] [PMC free article] [PubMed] [Google Scholar]
  • 18.Tobin V, Le Gall M, Fioramonti X, Stolarczyk E, Blazguez AG, Klein C, Prigent M, Serradas P, Cuif MH, Magnan C, Leturgue A, Brot-Laroche E: Insulin internalizes GLUT2 in the enterocytes of healthy but not insulin-resistant mice. Diabetes.2008;57(3) : 304555-562 10.2337/db07-0928Reference source [DOI] [PubMed] [Google Scholar]
  • 19.Gorboulev V, Schurmann A, Vallon V, Kipp H, Jaschke A, Klessen D, Friedrich A, Scherneck S, Rieg T, Cunard R, Veyhl-Wichmann M, Srinivasan A, Balen D, Breljak D, Rexhepaj R, Parker HE, Gribble FMReimann, F, Lang F, Wiese S, Sabolic I, Sendtner M, Koepsell H: Na+-D-glucose Cotransporter SGLT1 is Pivotal for Intestinal Glucose Absorption and Glucose-Dependent Incretin Secretion. Diabetes.2012;61(1) : 304187-196 10.2337/db11-1029Reference source [DOI] [PMC free article] [PubMed] [Google Scholar]
  • 20.Kellett GL: Comment on: Gorboulev et al. Na+-D-glucose cotransporter SGLT1 Is pivotal for intestinal glucose absorption and glucose-dependent incretin secretion. Diabetes.2012;61(6) : 304e4. 10.2337/db11-1793Reference source [DOI] [PMC free article] [PubMed] [Google Scholar]
  • 21.Roder PV, Geillinger KE, Zietek TS, Thorens B, Koepsell H, Daniel H: The role of SGLT1 and GLUT2 in intestinal glucose transport and sensing. PLoS One.2014;9(2) : 304e89977. 10.1371/journal.pone.0089977Reference source [DOI] [PMC free article] [PubMed] [Google Scholar]
  • 22.Ferraris RP, Diamond J: Regulation of intestinal sugar transport. Physiol Rev.1997;77(1) :257-302Reference source [DOI] [PubMed] [Google Scholar]
  • 23.Krimi RB, Letteron P, Chedid P, Nazaret C, Ducroc R, Marie JC: Resistin-like molecule-beta inhibits SGLT-1 activity and enhances GLUT2-dependent jejunal glucose transport. Diabetes.2009;58(9) : 3042032-2038 10.2337/db08-1786Reference source [DOI] [PMC free article] [PubMed] [Google Scholar]
  • 24.Sakar Y, Meddah B, Faouzi MA, Cherrah Y, Bado A, Ducroc R: Metformin-induced regulation of the intestinal D-glucose transporters. J Physiol Pharmacol.2010;61(3) :301-307Reference source [PubMed] [Google Scholar]
  • 25.Walker J, Jijon HB, Diaz H, Salehi P, Churchill T, Madsen KL: 5-aminoimidazole-4-carboxamide riboside (AICAR) enhances GLUT2-dependent jejunal glucose transport: a possible role for AMPK. Biochem J.2005;385(Pt 2) : 304485-491 10.1042/BJ20040694Reference source [DOI] [PMC free article] [PubMed] [Google Scholar]
  • 26.Debnam ES, Levin RJ: An experimental method of identifying and quantifying the active transfer electrogenic component from the diffusive component during sugar absorption measured in vivo. J Physiol.1975;246(1) : 304181-196 10.1113/jphysiol.1975.sp010885Reference source [DOI] [PMC free article] [PubMed] [Google Scholar]
  • 27.Please write authors as Surname X, Surname Y: The Na+-independent D-glucose transporter in the enterocyte basolateral membrane: orientation and cytochalasin B binding characteristics. J Membr Biol.1987;97(3) :259-266 [DOI] [PubMed] [Google Scholar]
  • 28.Tamura A, Hayashi H, Imasato M, Yamazaki Y, Hagiwara A, Wada M, Noda T, Watanabe M, Suzuki Y, Tsukita S: Loss of claudin-15, but not claudin-2, causes Na+ deficiency and glucose malabsorption in mouse small intestine. Gastroenterology.2011;140(3) : 304913-923 10.1053/j.gastro.2010.08.006Reference source [DOI] [PubMed] [Google Scholar]
  • 29.Corpe CP, Basaleh MM, Affleck J, Gould G, Jess TJ, Kellett GL: The regulation of GLUT5 and GLUT2 activity in the adaptation of intestinal brush-border fructose transport in diabetes. Pflugers Arch.1996;432(2) :192-201 [DOI] [PubMed] [Google Scholar]
  • 30.Levine GM, Shiau YF, Deren JA: Characteristics of intestinal glucose secretion in normal and diabetic rats. Am J Physiol.1982;242(5) :G455-G459Reference source [DOI] [PubMed] [Google Scholar]
F1000Res. 2015 Jan 21.
Richard J Naftalin 1

Dear Professor Kellett (George, GK),

Thank you for reviewing my commentary on the role of apical GLUT2 in intestinal absorption of glucose, whose main focus is examining quantitatively how apical GLUT2 interactions affect intestinal glucose transport.  Your  research has generated much interest and controversy over the last fifteen years.    I am fairly convinced that the problem that it has resurrected – namely, coping strategies with excessive glucose absorption and its subsequent accumulation within the splanchnic circulation, has important implications for the pathophysiology of glucose absorption and metabolism.   The spin offs implicating the  role of gut incretins, autocoids and hormones in control of glucose appetite, taste and absorption with ramifications in such topics as obesity and type II diabetes are likely to be of critical importance and subject of  research for the foreseeable future.    Nevertheless, I am in substantial disagreement with some of the topics you raise.     Some of the points I will make refer to simple clarifications and others are more fundamental. 

 Point 1: You GK say “ At that point, net absorption of glucose through apical GLUT2 switches to net secretion of accumulated glucose through apical GLUT2 into the lumen; it is then transported across the epithelium by a paracellular channel, along with other luminal glucose. Apical GLUT2 therefore acts, not as a direct transcellular transporter, but as a shunt to supply a major paracellular pathway of transepithelial absorption”.

Possibly, there is a slight misreading here.  GLUT2 does indeed function as an apical membrane shunt facilitating glucose reflux, thereby reducing cytosolic glucose concentration.  This has the secondary effect of reducing net glucose flux across the baso-lateral membrane, thus reducing   interstitial glucose concentration and thereby increasing the concentration gradient between the lumen and interstitial fluids.  This increased concentration gradient generates the increased diffusive flux via the parallel paracellular pathway.    No adjustment of paracellular parameters is required to accommodate this increased paracellular flow.  The mere fact that a paracellular route is present in parallel with the transcellular route will generate such an increase in flow if transcellular flux is reduced inhibited. 

Point 2:  GK contends that the (Ferraris & Diamond 1997) review eliminates the possibility of a significant functional paracellular route for glucose absorption - as you say “Diamond and Ferraris contested the concept of paracellular flow 3-6….. In so doing, they implied that SGLT1 is the only pathway of glucose absorption and denied the existence of two components” and later you say “the apical GLUT2 model replaced paracellular flow and the impasse in the long-standing debate seemed resolved”.  Perhaps!  But, then again maybe not – nothing much in Physiology is wholly resolved.   

The implication is that Ferraris and Diamond, refuted the functional existence of the paracellular absorptive pathway is contradicted by substantial literature in which the in vivo technique of monitoring passive intestinal permeability using dual sugar absorption technique e.g. lactulose and rhamnose (Laker & Menzies 1977; Bjarnason et al. 1995) demonstrates a considerable element of passive intestinal absorption of  un-metabolized  sugars in humans in vivo.      Furthermore, it is evident that neither Diamond nor his erstwhile colleagues, Ferraris and Karasov, any longer hold fast to the view that paracellular sugar fluxes are a negligible component of intestinal absorption.       Passive paracellular glucose absorption is now thought to be the dominant route of absorption in nectarivores and be of major importance in several reptiles, rodents and mammals.  It is apparent that there is wide species variability in passive intestinal absorption of sugars: from highest  in the American robin with 92% passive (paracellular) absorption  to lowest, 2.1 % in rabbits (Karasov & Cork 1994; Secor et al. 1994; Ferraris 2001).  Humans have around 20% passive absorption, assuming they have not been drinking alcohol excessively, or not  treated with non-steroidal anti-inflammatory drugs, when the paracellular flow increases by at least two-fold (Bjarnason et al. 1984).   Thus, I do not agree with your assertion that paracellular glucose transport is generally negligible – this is particularly not the case when luminal glucose concentrations exceed 25mM.    The low mannitol “clearance” you refer to should be compared with the passive, rather than the active component of glucose absorption. Passive glucose and galactose loss from rat jejunum in the presence of 0.5mM phloridzin does not differ significantly from sorbose - which is poorly selective for GLUTs and SGLTs (Debnam & Levin 1975). 

 Point 3:  A clarification:  the assigned Kt of glucose for SGLT1 transport is 2mM and for Na is 25mM and for GLUT2 at both apical and basolateral membranes the Kt is 17mM.  This requires clarification and I will amend the appendix and include these values in the legends to Figure 1. 

These values give an “operational” Kt for net glucose flux via SGLT1, as obtained from the model     ≈17mM Figure 3A. The flux via apical GLUT2 with an absent paracellular component Figure 3B has an “operational” Kt   around 25mM. These values are well within the observed values reported. 

For those   unfamiliar with modelling complex processes,    the operational Kt’s are not necessarily the same as parameters assigned to the transporter.  The operational Kt for net transport is a lumped parameter that depends upon a large number of interactions.  Operational   “parameters” –are actually variables and only equal to the assigned parameters in the ideal zero-trans condition i.e. when the opposing side of the transporter contains zero ligand and back flux is zero.   Whilst this condition may hold in a few in vitro conditions, such as uptake into oocytes, or exit fluxes from cells or vesicles into large volume of bathing solution, it is unattainable with net intestinal transport, where the cytosolic and interstitial fluids contain transported ligands at substantial concentrations.

Using pharmacological tools in complex whole tissue preparations to dissect the parameters of individual transport process is likely to be a crude and sometimes misleading practice.     However, adoption of more precise reductive approaches does not circumvent the problem of assessing how individual elements function within the integrated whole organ as is being examined here.  This is the role of modelling and simulation which depends of course on use of experimental data.    Apropos   I am disappointed that GK has made no comment on the action of phloretin as he attributed to it the unique effect of inhibiting apical GLUT2(Kellett & Helliwell 2000).  In addition to the other reported effects of phloretin I have cited   (Wright et al. 2011) have mentioned that phloretin also inhibits SGLT1 (Ki 50 µM). They  infer that Kellett and Helliwell underestimated the role of SGLT1 in intestinal transport.   

Point 4:  GK contends that the simulation results are presented for just one luminal glucose concentration (50 mM) and two rather selective values of K m  for key transporters; there is no consideration of GLUT2 asymmetry. A much wider range of factors, concentrations and parameter values should be explored, including the absence of paracellular flow. 

 It is incorrect to imply that the results are presented at just one luminal glucose concentration.  This is true only for figure 1.  In figures 2 and 3, luminal glucose concentration is varied between 0 and 50 mM and the steady state transepithelial glucose transport rates are simulated in different conditions (see figure 3A and 4A). In figure 4, the luminal glucose concentration is held at 30mM to simulate the conditions observed by (Kellett & Helliwell 2000). With phloridzin present it is certainly correct that the luminal> cytosolic > interstitial glucose concentration.  However   when phloretin is added in addition to simulate the Kellett-Helliwell experiment and it is assumed   only to inhibit apical GLUT2, no significant change in transepithelial glucose flux is observed.  The reason for this is that the reduced transcellular flow is compensated by enhanced paracellular flow.  Only when phloretin is assumed to block paracellular flow in addition to transcellular flow is any inhibitory effect of phloretin on transepithelial glucose transport observed.   

Many other conditions could be simulated e.g. varying Na concentrations, varying osmolarity etc; however the main point of this review is to illustrate some of the fallacies relating to apical GLUT2 function without excessive overload.   

Point 5 GK:  There is no consideration  of GLUT2 asymmetry… (Maenz & Cheeseman 1987) reported that the kinetic parameters observed in baso-lateral membrane vesicles from rat small intestine.  They found that the Kt for uptake was 48±5 mM glucose, whereas for influx it was 23±2mM.  A later review reported that GLUT2 in isolated hepatocytes has a Km of approximately 20mM and is symmetrical  (Thorens 1993).    I will add a reference to Thorens review on GLUT2. 

Point 6 .  GK makes the point that “Emphasis on recycling of glucose through apical GLUT2 has been as a shunt to serve paracellular flow. Evidence that recycling of glucose and Na +  through SGLT1 is vital to intestinal function should be included.”

I take this to mean glucose and Na recovery from the lumen via SGLT e.g. during periods of starvation e.g. at night.  It is certainly likely that glucose may leak via the transcellular route when the lumen is glucose free. This may also occur via the paracellular route and recovery via SGLT is an important function.  This point was made very well by (Boyd & Parsons 1976) and says much about SGLT capacity to recapture glucose leaked via either trans or paracellular routes from the blood but no much about the specific role of apical GLUT2. However it is not  very relevant to the main topic of debate here,  which is the mode of intestinal transport with high luminal glucose concentrations. 

Point 7. GK suggests a  new title  “Computer simulation of an integrative model of intestinal glucose absorption”

 I do not feel that a changed title is a warranted.  I agree that computer simulation of net glucose transport lies at the heart of this commentary,   however this is used simply as a tool-  a means  to illustrate the cardinal point  that GLUT2 does not have a functional role in augmenting net glucose transport in the way that GK has suggested  - namely during luminal overload .  However by its possible alternative roles in spreading the luminal glucose load over a wider absorptive area  and also preventing osmotic stress,  GLUT2 induction may augment net glucose transport,  as has been shown. 

References

Bjarnason, I., MacPherson, A. & Hollander, D., 1995. Intestinal permeability: An overview. Gastroenterology, 108, pp.1566–1581.

Bjarnason, I., Peters, T.J. & Wise, R.J., 1984. The leaky gut of alcoholism: possible route of entry for toxic compounds. Lancet, 1(January), pp.179–182.

Boyd, C. & Parsons, D., 1976. Effects of vascular perfusion on the accumulation distribution and transfer of 3-O-methyl-D-glucose within and across the small intestine. J Physiol, 274, pp.17–36.

Debnam, B.Y.E.S. & Levin, R.J., 1975. AN EXPERIMENTAL METHOD OF IDENTIFYING AND QUANTIFYING THE ACTIVE TRANSFER ELECTROGENIC COMPONENT FROM THE DIFFUSIVE COMPONENT DURING SUGAR ABSORPTION MEASURED IN VIVO From the Department of Physiology , University of Sheffield , side have been measured in. J Physiol, pp.181–196.

Ferraris, R. & Diamond, J., 1997. Regulation of intestinal sugar transport. Physiological Reviews, 77(1), pp.257–302. Available at: http://physrev.physiology.org/content/77/1/257.short.

Ferraris, R.P., 2001. Dietary and developmental regulation of intestinal sugar transport. The Biochemical journal, 360, pp.265–276.

Karasov, W.H. & Cork, S.J., 1994. Glucose absorption by a nectarivorous bird: the passive pathway is paramount. The American journal of physiology, 267, pp.G18–G26.

Kellett, G.L. & Helliwell, P.A., 2000. glucose-induced recruitment of GLUT2 to the brush-border membrane. Biochem J, 162, pp.155–162.

Laker, M. & Menzies, I., 1977. Increase in human intestinal permeability following ingestion of hypertonic solutions. J Physiol, 265, pp.881–894.

Maenz, D.D. & Cheeseman, C.I., 1987. The Na+-independent d-glucose transporter in the enterocyte basolateral membrane: Orientation and cytochalasin B binding characteristics. The Journal of Membrane Biology, 97, pp.259–266.

Secor, S.M., Stein, E.D. & Diamond, J., 1994. Rapid upregulation of snake intestine in response to feeding: a new model of intestinal adaptation. The American journal of physiology, 266, pp.G695–G705.

Thorens, B., 1993. Facilitated Glucose Transporters in epithelial cells. Annu Review Physiol., pp.591–608.

Wright, E.M., Loo, D.D.F. & Hirayama, B.A., 2011. Biology of human sodium glucose transporters. Physiological reviews, 91(2), pp.733–794. Available at: http://www.ncbi.nlm.nih.gov/pubmed/21527736 [Accessed September 10, 2014].


Articles from F1000Research are provided here courtesy of F1000 Research Ltd

RESOURCES