Abstract
Using serial data from the Fels Longitudinal Study (FLS), we investigate the effects of early and late attainment of the peak height velocity (PHV) in childhood on the timing of the appearance of the metabolic syndrome later in life. We show that if early attainment of PHV engenders greater risks for chronic disease in boys than in girls.
We define those boys and girls in the sex-specific quartiles of the study population that were slowest to attain PHV as having a slow tempo of development, and those in the growth that most rapidly attained PHV as having a rapid tempo of development.
Boys who experienced an early onset of PHV tended to have higher risk for the metabolic syndrome, dyslipidemia, and impaired fasting glucose than those who had late onset of PHV. Girls who had an early onset of PHV tended to develop more abdominal obesity than females who had a late onset of PHV.
Introduction
Restricting the caloric intake over a lifetime by 25% to 60% has been shown in a variety of animal models to lengthen lifespan (Duan, et al., 2003; Bodkin, et al., 2003; Apfeld, et al., 2004). One explanation for these observations is that caloric restriction leads to a decreased oxidation of nutrient substrates over a lifetime, resulting in a cumulative decrement in exposure of mitochondria, telomeres and other intracellular structures and organelles to reactive oxygen species (Beckman and Ames, 1998; Droge, 2002; Julian, et al., 2004). However, more recently Sinclair, et al. (2005) proposed a unified theory of aging that involves activation of a set of genes that evolved to manage the cell economy during periods of nutritional stress.
Conversely, models that involve overfeeding of animals have been shown to accelerate the process of aging (Keenan, et al. 1997; Armitage, et al. 2005). A possible explanation for this curtailment of lifespan is that of cumulative damage to intracellular structures and organelles caused by exposure to augmented levels of reactive oxygen species over a lifetime. These models are relevant to the present study of the influence of the tempo of physiological development on the rate of aging because they demonstrate that the rate of aging can be slowed or accelerated by caloric restriction or overfeeding. Although we do not have specific data on nutritional intake of the subjects in the Fels Longitudinal Study (FLS), we have complete serial records of their fat mass over a lifetime, determined by the direct methods of underwater weighing and dual energy x-ray absorptiometry (DXA). These serial measurements of fat mass in each of the subjects in the FLS reflect their long-term energy balance at frequent intervals over a lifetime and may be linked to the tempo of physiologic development in childhood and adolescence and to the appearance of metabolic and cardiovascular disease later in life.
The negative effects of the accumulation of excess fat mass early in life have been elucidated by Sinha et al. (2002) who demonstrated that obesity in childhood and adolescence is associated with impaired glucose tolerance (IGT) and early appearance of T2DM, and by Berenson et al. (1998), who showed that obesity early in life leads to atheromatous plaque deposition in the coronary arteries in the second and third decades of life. Garemo et al. (2006) have shown increased insulin resistance in boys and girls who gained weight rapidly in the first four years of life, and Reinehr et al. (2006) demonstrated that obese children have significantly thicker carotid intima media thickness (IMT) compared to non-obese children. An increased amount of body fat early in life also leads to an early onset of puberty in girls (Kaplowitz et al., 2001; Himes et al., 2004; Lee et al., 2007).
Conversely, a low burden of body fat during the first two decades of life retards the tempo of physiological development. Warren et al. (2000, 2003) showed that adolescent female gymnasts and ballet dancers who are in a negative energy balance or in a marginally positive energy balance have a delayed onset of menarche. More recently Roze’ et al. (2007) showed that girls with anorexia nervosa and low BMIs reach menarche at a mean age of 15.4 years, about 3 years later than the mean of girls in the FLS.
We have shown that early pubertal growth spurt predicts early attainment of adult insulin levels and lipid profiles (Remsburg et al., 2003). Sun et al. (2009) previously ascertained the influence of a prolonged juvenile state on delaying the onset of the metabolic syndrome, cardiovascular disease (CVD), and type 2 diabetes mellitus (T2DM) later in life. They found that children who matured relatively early tended to have greater BMI, waist circumference, percent of body fat and were more likely to have adverse cardiovascular risk profiles than children who matured late. The differences in these risk factors between early and late maturers were significant for percent body fat, fasting plasma triglycerides, and fasting plasma insulin at age 18 to 35 years.
In this study we ascertain the influence of a prolonged juvenile state, i.e., a retarded tempo of physiological development, on delaying the onset of the metabolic syndrome later in life. We link risk factors to this common but unhealthy feature of aging to childhood tempo of physiological development. The tempo of physiological development is determined in each subject by documenting his or her age at the time of the PHV, the age at attainment of the maximum velocity of growth in height during adolescence. Specifically, we test two hypotheses:
-
Hypothesis 1
That boys and girls with a relatively shorter or curtailed juvenile state will have higher levels of waist circumference/height, as adults than boys and girls with a prolonged juvenile state.
-
Hypothesis 2
That boys and girls with a curtailed juvenile state will have lower adult levels of fasting plasma HDL-cholesterol, higher systolic and/or diastolic blood pressures, higher fasting plasma triglycerides, and fasting plasma glucose concentration as adults than boys and girls with a prolonged juvenile state.
SUBJECTS AND METHODS
Study Sample
The study sample consists of 431 adults (213 males and 218 females) in the FLS who have sufficient childhood height data recorded to capture the age at PHV, as well as sufficient serial metabolic syndrome risk-factor data collected in the same subjects later in life. Parameters used to assess the metabolic syndrome include waist circumference, HDL-cholesterol, triglycerides, systolic and diastolic blood pressure (BP), and fasting plasma glucose.
Measurements
The FLS has enrolled cohorts of 15–25 newborn infants every year to the present, beginning in 1930. Participants were examined at birth, 1, 3, 6, 9, and 12 months of age, then every 6 months for 18 years and biennially thereafter. Anthropometric parameters and BP were measured and family health history ascertained. Beginning in 1976, body composition, fasting plasma lipids and lipoproteins were measured, and lifestyle variables such as cigarette smoking, and physical activity were recorded for participants 8 years and older. Approximately 8% of the Fels participants have been lost to follow-up, but their body composition data at last visit did not differ from the 92% who remain in the study. Measurement reliability in the FLS is excellent, and reliability coefficients for most of the variables are well above 90%.
Weight, stature, and abdominal circumference were measured using standardized procedures similar to recommendations of the Airlie Consensus Conference (Lohman et al., 1988). Weight is measured to the nearest 10 grams and stature is measured to the nearest millimeter. The waist circumference measurement is recorded to the nearest millimeter. Systolic blood pressure measurements were measured by trained technicians with the participant seated, using a standard mercury sphygmomanometer with the procedure recommended by the American Heart Association and the National Institutes of Health (NHLBI, 1974). Serial fasting plasma HDL cholesterol and triglycerides were measured annually near the time of the participants’ birthdays beginning at ages 8 years. These parameters were measured at the Medical Research Laboratory in Cincinnati. Fasting plasma levels of glucose and insulin were also measured using conventional methods. All procedures were approved by the Institutional Review Boards of Virginia Commonwealth University and Wright State University.
Quantifying Age at Peak Height Velocity
A triple logistic model was applied to individual semi-annual data for height from 2 to 18 years of age to derive the timing of the onset of the pubertal growth spurt and the age at peak height velocity (Sun et al., 2009; Bock et al., 1994):
where h(t) = height at time t, a1 = contribution of prepubertal growth to mature height, b1 = slope of the early childhood component at maximum velocity, c1 = age at maximum velocity of the early-childhood component; b2 = slope of the middle-childhood component at maximum velocity, c2 = age at maximum velocity of the middle-childhood component, p=proportion of prepubertal growth due to the middle-childhood component, q = 1−p, f−a1=contribution of the adolescent component to mature stature, b3 = slope of the adolescent component at maximum velocity, and c3 = age at maximum velocity of the adolescent component. The growth parameters that quantify the timing at the peak height velocity were derived from the coefficients in the fitted models.
Rate of Maturation
We define those boys and girls whose age of attainment of PHV is in the highest quartile of the overall FLS sample as having a prolonged juvenile state. Conversely, we define those boys and girls whose age of attainment of PHV is in the lowest percentile of the study population as having a curtailed juvenile state. The cut-offs for lower and upper quartiles are 12.8 and 14.3 y for males and 10.8 y and 12.1 y for females, respectively.
Adult Metabolic Syndrome
The Third Report of the NCEP Expert Panel on Detection, Evaluation, and Treatment of High Blood Cholesterol in Adults (ATP III) provides a working definition of the metabolic syndrome in adults as having a cluster of three, four, or five risk factors that exceed criterion values: namely, waist circumference >102 cm for men and >88 cm for women; blood pressure >130/>85 mm Hg; plasma triglyceride level >150 mg/dL; plasma HDL-cholesterol level <40 mg/dL for men and <50mg/dL for women; and fasting plasma glucose (FPG) >110 mg/dL (NIH, 2001; JAMA, 2001). Kahn et al. (2003) recommended that the criterion value for FPG be lowered to 100 mg/dL, and we have done so in our analyses. The age of first diagnosis of each of the metabolic syndrome risk factors was identified. These estimates are sufficient for the present analyses.
Statistical Methods
The ages of PHV and the age of the onset of the metabolic syndrome in the cohort of interest are summarized, separately for males and females, with means and standard deviations (SDs), and the 25th, 50th, and 75th percentiles. The mean ages of onset for the metabolic syndrome are reported separately in subjects who had curtailed and prolonged juvenile states. The prevalence of the metabolic syndrome, and for each of the five diagnostic risk factors are summarized by percentages separately for males and females. The difference in the prevalence between the sexes is tested using Pearson’s Chi-Square Test of Homogeneity.
The influence of the age at PHV was assessed by considering only the subjects who had either a curtailed or prolonged juvenile state. This resulted in a subsample of 211 subjects (107 male; 104 female). Pearson Chi-square tests of Association and Kaplan-Meier survival curves were used to assess how the age at PHV influenced the age of onset of each of the five risk factors, separately for males and females. The Nelson-Aalen cumulative distribution function was also plotted separately for males and females, as were the median survival times with the corresponding 95% confidence intervals (CIs). The difference in median in survival times between the PHV groups was tested using the Log-Rank Test. All statistical tests were performed at the p=0.05 level and were performed using SAS v9.3.
RESULTS
Age at PHV
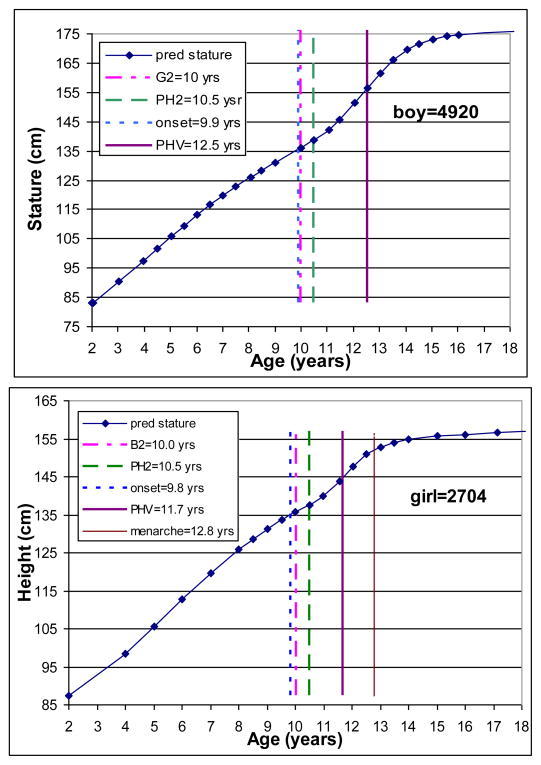
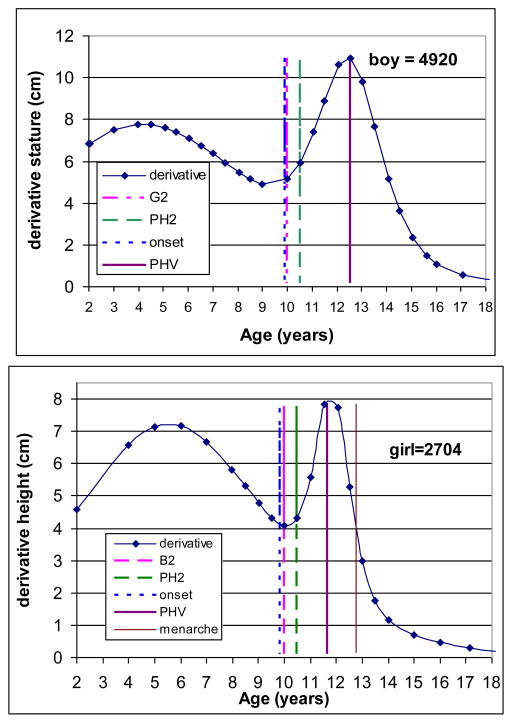
The triple logistic model was applied to each individual’s serial height data. Figure 1 illustrates examples for a randomly selected boy and girl. The upper left and right panels present distance trajectory in the boy and girl, respectively, with observed serial data and predicted values for height using the triple logistic models. The lower panels present the corresponding velocity curves for the same boy and girl. The individual fitted growth trajectory allows the estimation of the onset of the pubertal growth spurt and the age at PHV. The boy started the pubertal growth spurt at age 9.9 years and reached his PHV at age 12.8 years, while the girl started her pubertal spurt at age 9.8 years and reached her PHV at age 11.4 years. The descriptive statistics for the age at PHV are illustrated in the upper panels of Table 1.
Figure 1.
Observed (dots) and predicted (line) height from 2 to 18 years of age.
Table 1.
Summary information for age at peak height velocity estimated from the triple logistic models and age at the diagnosis of metabolic syndrome.
| Age at Peak Height Velocity | ||||||
|---|---|---|---|---|---|---|
| N | Mean | SD | 25th | 50th | 75th | |
| Males | 213 | 13.5 | 1.3 | 12.9 | 13.7 | 14.3 |
| Females | 218 | 11.5 | 0.9 | 11.0 | 11.6 | 12.1 |
| Age at the Diagnosis of Metabolic Syndrome | ||||||
|---|---|---|---|---|---|---|
| N | Mean | SD | 25th | 50th | 75th | |
| Males | 158 | 41.3 | 0.9 | 30.2 | 40.0 | 53.0 |
| Females | 154 | 43.0 | 15.7 | 29.0 | 40.7 | 56.8 |
Metabolic syndrome
The distributions for the earliest age at the onset of unhealthy events, i.e., metabolic syndrome, low HDL cholesterol, high triglycerides, glucose, blood pressure, and waist circumference are shown in the lower panels of Table 1. The overall mean age at the onset of the metabolic syndrome is 41.3 y for men and is 43.0 y for women. The prevalence of the metabolic syndrome is 27.7% in men and 20.7% in women (Table 2). Both men and women who had a curtailed juvenile state had an earlier age of onset of the metabolic syndrome (males: mean=43.8 y; females: mean=45.9 y) than subjects who had a prolonged state (males: mean=50.0 y, females: mean=56.4 y). There is difference between men and women in the individual prevalence of risk factors that contribute to the metabolic syndrome. Women had significantly greater prevalence of abdominal obesity (44.7%) than men (29.1%). Men had significantly greater prevalence of elevated blood pressure (35.2%) than women (20.3%). Men also had a significantly greater risk of having elevated plasma triglycerides (40.4%) than women (29.8%). In addition, men (36.8%) had a significantly greater prevalence of elevated plasma glucose concentration than women (20.7%).
Table 2.
Prevalence of metabolic syndrome and each risk factor separately by sex.
| Risk Factor | Male Prevalence | Female Prevalence | P-value |
|---|---|---|---|
| Metabolic Syndrome | 27.7% | 20.7% | 0.092 |
| Waist Circumference | 29.1% | 44.7% | <0.001 |
| Blood Pressure | 35.2% | 20.3% | <0.001 |
| Triglycerides | 40.4% | 29.8% | 0.022 |
| HDL | 37.1% | 37.6% | 0.910 |
| Glucose | 36.8% | 20.7% | <0.001 |
The effects of age at PHV on risk factors
Table 3 lists the prevalence of metabolic syndrome and each of the five risk factors by the timing of peak height velocity, separately for males and females. The prevalences of all the cardiovascular risk factors show no uniform patterns with respect to either the timing of the peak height velocity or sex. Nominally, early maturing males had higher prevalence of metabolic syndrome (31.5%) than late maturers (24.5%), although this difference is not statistically significant (P=0.423). No difference was observed in the prevalence of the metabolic syndrome between subjects in the curtailed (21.7%) and prolonged (21.1%) juvenile state (P-0.933). Female subjects who had a curtailed juvenile state are more likely than late maturers to have an unhealthy waist circumference (P=0.017). Males with an early age of PHV tended to have a higher risk of having levels of HDL cholesterol below the cut-points compared to those with a late age of PHV (P=0.037). No other statistically significant difference in the prevalence of the risk factors was observed between subjects with curtailed and prolonged juvenile states.
Table 3.
Frequencies, percentages, and median survival times of risk status over the categorized age of peak height velocity separately by sex
| Male | Female | ||||||||
|---|---|---|---|---|---|---|---|---|---|
|
| |||||||||
| Metabolic Syndrome †† | Metabolic Syndrome | ||||||||
| PHV Groups | Healthy | At Risk | % At Risk | Median Survival | PHV Groups | Healthy | At Risk | % At Risk | Median Survival |
| Early | 37 | 17 | 31.5% | 54.6 (43.3, 62.2) | Early | 36 | 10 | 21.7% | 65.5 (51.3, 74.9) |
| Late | 40 | 13 | 24.5% | 65.7 (56.5, 73.6) | Late | 45 | 12 | 21.1% | 60.6 (57.8, 75.1) |
|
| |||||||||
| Waist Circumference | Waist Circumference ** †† | ||||||||
|
| |||||||||
| PHV Groups | Healthy | At Risk | % At Risk | Median Survival | PHV Groups | Healthy | At Risk | % At Risk | Median Survival |
| Early | 42 | 12 | 22.2% | 54.6 (54.3, 64.2) | Early | 19 | 27 | 58.7% | 46.1 (35.4, 56.8) |
| Late | 35 | 18 | 34.0% | 58.9 (52.5, 58.5) | Late | 37 | 20 | 35.1% | 58.6 (51.3, 71.2) |
|
| |||||||||
| Blood Pressure | Blood Pressure | ||||||||
|
| |||||||||
| PHV Groups | Healthy | At Risk | % At Risk | Median Survival | PHV Groups | Healthy | At Risk | % At Risk | Median Survival |
| Early | 35 | 19 | 35.2% | 54.3 (41.6, 62.6) | Early | 40 | 6 | 13.0% | 66.5 (51.3, 71.9) |
| Late | 32 | 21 | 39.6% | 56.5 (48.2, 61.0) | Late | 42 | 15 | 26.3% | 59.4 (56.9, 74.8) |
|
| |||||||||
| Glucose †† | Glucose | ||||||||
|
| |||||||||
| PHV Groups | Healthy | At Risk | % At Risk | Median Survival | PHV Groups | Healthy | At Risk | % At Risk | Median Survival |
| Early | 33 | 21 | 38.9% | 47.1 (42.0, 58.1) | Early | 36 | 9 | 20.0% | 65.5 (47.4, 74.9) |
| Late | 36 | 16 | 30.8% | 59.9 (52.3, 68.5) | Late | 48 | 9 | 15.8% | NA (NA, NA) ‡ |
|
| |||||||||
| Triglycerides †† | Triglycerides | ||||||||
|
| |||||||||
| PHV Groups | Healthy | At Risk | % At Risk | Median Survival | PHV Groups | Healthy | At Risk | % At Risk | Median Survival |
| Early | 29 | 25 | 46.3% | 43.5 (41.6, 57.5) | Early | 31 | 15 | 32.6% | 57.3 (41.5, 74.9) |
| Late | 34 | 19 | 35.9% | 58.9 (49.6, 65.7) | Late | 38 | 20 | 34.5% | 60.0 (51.3, 63.8) |
|
| |||||||||
| HDL** †† | HDL | ||||||||
|
| |||||||||
| PHV Groups | Healthy | At Risk | % At Risk | Median Survival | PHV Groups | Healthy | At Risk | % At Risk | Median Survival |
| Early | 27 | 27 | 50.0% | 43.2 (36.6, 62.2) | Early | 25 | 21 | 45.7% | 46.1 (38.7, 65.5) |
| Late | 37 | 16 | 30.2% | 65.7 (NA, NA) ‡ | Late | 36 | 22 | 37.9% | 63.8 (42.0, 75.1) |
Pearson Chi-square test of association p-values:
0.05<P<0.01,
0.01<P<0.001,
P<0.001;
Log-rank test p-values:
0.05<P<0.01,
0.01<P<0.001,
P<0.001;
Estimates don’t exist due to heavy censoring.
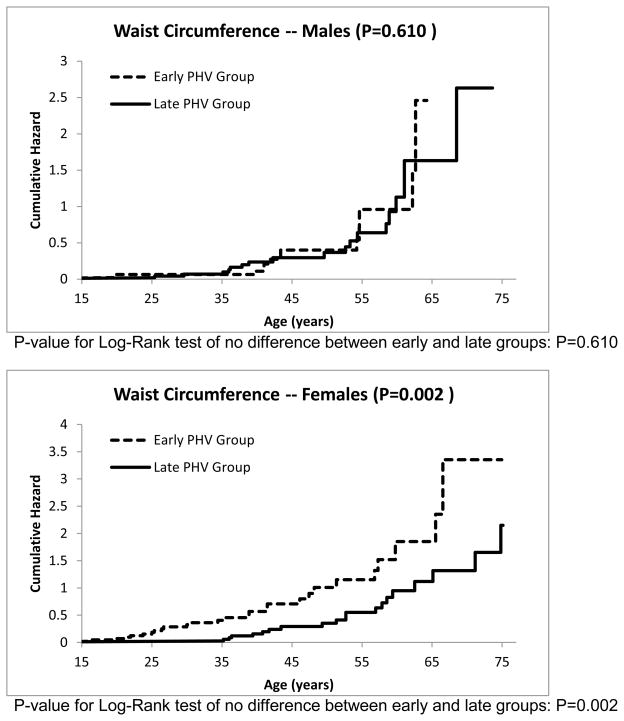
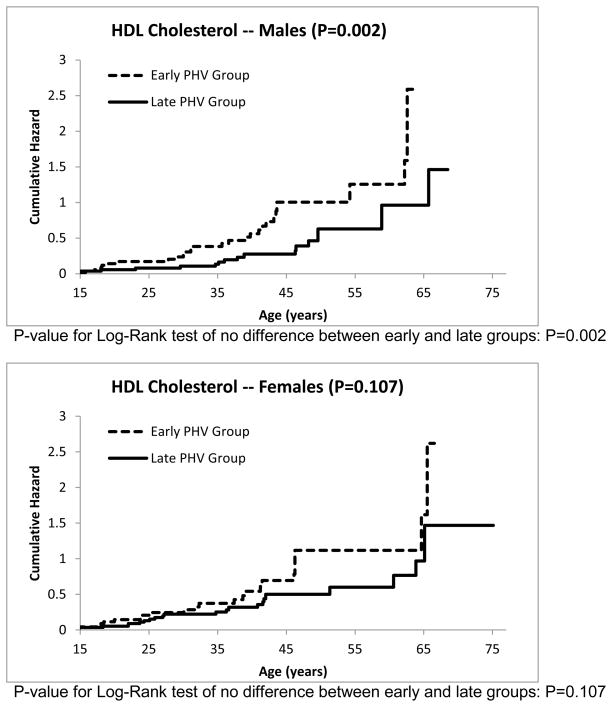
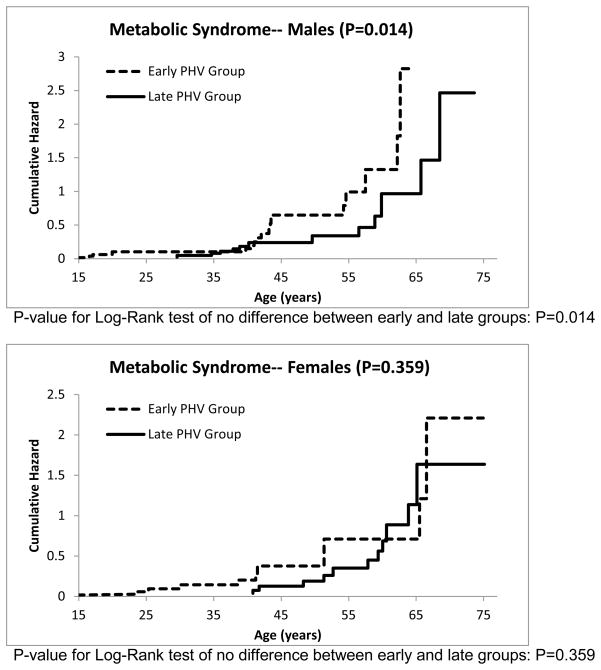
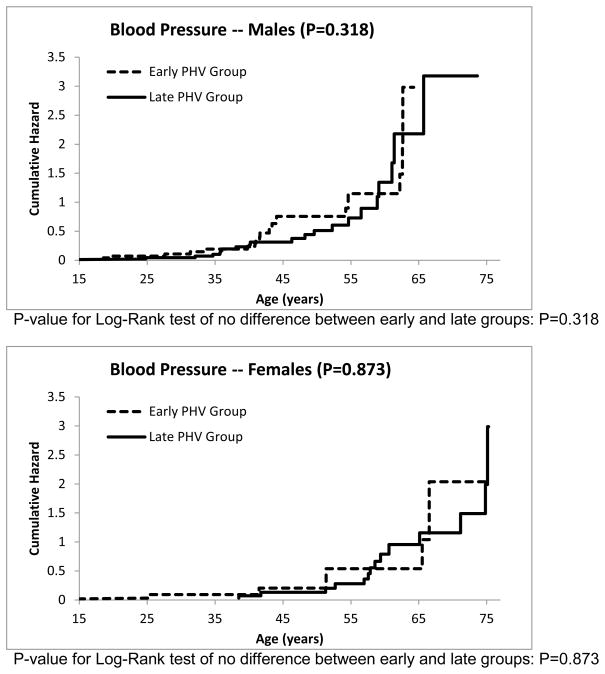
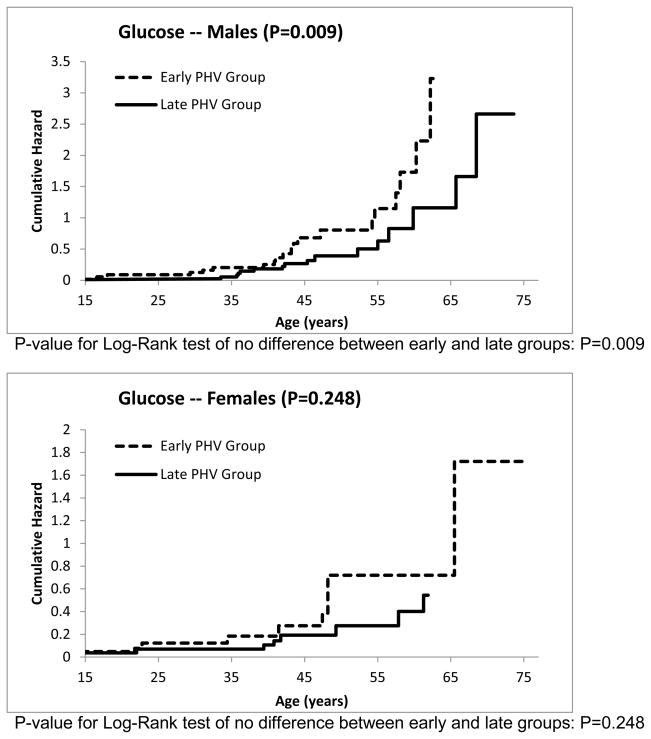
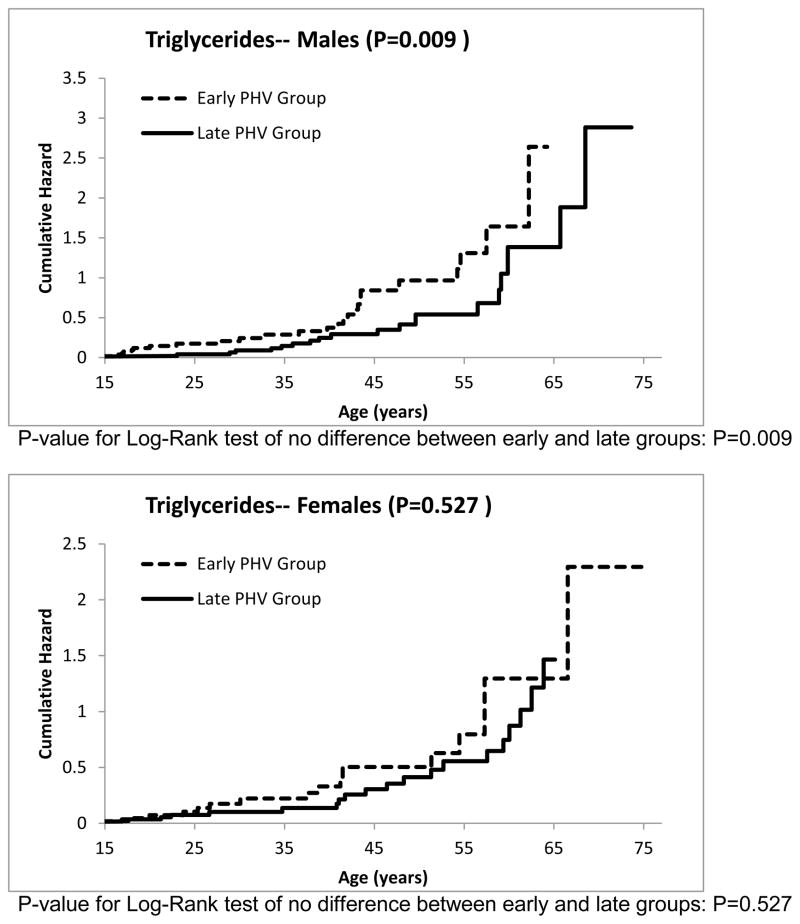
The cumulative hazard functions for the other risk factors can be seen in Figures 3–7. The estimated median age of onset of each of the risk factors can be seen in Table 3 with the corresponding 95% CIs. The p-values from the Log-Rank test are shown in the Figures 2–7 as well in Table 3. Generally, the subjects who had an early timing of peak height velocity had earlier onsets of metabolic syndrome and the corresponding risk factors. For metabolic syndrome, males who had an early PHV had an earlier onset of the metabolic syndrome (P=0.031) than those who had a late peak height velocity, indicating a cohort at higher risk of this condition (Figure 2). Males who were in a curtailed juvenile state also had a higher risk of having an unhealthy fasting plasma glucose, triglycerides, and HDL cholesterol levels (P=0.009, P=0.009, P=0.002, respectively). Females with either curtailed or prolonged juvenile states exhibited no difference in the age of onset of metabolic syndrome (P=0.580). However, females who had a curtailed juvenile state were more at risk of having a higher waist circumference than those who had a prolonged juvenile state (P=0.002). No other differences in the age of onset of any of the risk factors were observed for either males or females.
Figure 3.
Cumulative risk of developing abdominal obesity for curtailed versus prolong juvenile state.
Figure 7.
Cumulative risk of developing dyslipidemia, i.e., low HDL-C for curtailed versus prolong juvenile state.
Figure 2.
Cumulative risk of developing metabolic syndrome for curtailed versus prolong juvenile state.
DISCUSSION
The innovative approach taken in this study includes the application of time-to-event models to relate the age at peak height velocity to onset of metabolic syndrome later in life. The timing of attaining peak height velocity was determined by fitting individual serial data for height from 2 to 18 years to triple logistic models. No previously published studies linking the tempo of physiological development in the first two decades of life to the onset of the metabolic syndrome were found.
The present study takes advantage of a unique data set which permits the examination of relationships from variables collected in childhood to those collected in adulthood. Embedded within this large collection of serial data are relationships that can be revealed by the application of growth curve models and the Kaplan-Meier estimate of the survivor function. The FLS contains information on numerous parameters measured semi-annually in over 2500 participants for the first 18 years of life and biennially thereafter for decades. Many of the participants are now in their sixth and seventh decades of life and are afflicted with typical age-related chronic conditions. The FLS provides a unique opportunity to characterize accurately the rates and patterns of events during the pubertal growth spurt and to analyze their effects on risk factors for metabolic and cardiovascular disease later in life.
We previously characterized human growth in height from 2 to 18 years (Sun and Schubert, 2009). The pubertal growth spurt in height begins in girls at about 9 or 10 years and in boys at about 10 or 11 years, and the PHV is reached at about 12 years in girls and 14 years in boys (Malina et al., 2004; Sun et al., 2009). The mean age of PHV in this sample of the FLS population is 13.5±1.3 years for males and 11.5±0.9 years for females. The age differences between a slow rate of maturation versus a rapid rate of maturation are approximately 1.4 y for boys and 1.1 y for girls. Yet, the mean ages at earliest onset of metabolic syndrome for the slow maturers versus the rapid maturers was 50.0 y vs. 43.8 y for the men, and 56.4 y vs 45.9 y for women. Therefore, this study suggests that the tempo of physiological development affects the onset of metabolic syndrome.
Reaven (1988) reported a clustering of dyslipidemia, hypertension, and glucose intolerance which he named syndrome X. The NCEP ATP III expanded the cluster of risk factors for the syndrome by adding waist circumference, a proxy for visceral fat accumulation (Expert Panel 2001). The existence of the metabolic syndrome as a true syndrome, rather than an association of risk factors that co-vary with obesity, has been debated in the literature (Kahn et al., 2005; Cheng and Leiter, 2006). Sun et al. (2012) indicate that the risk factors for the metabolic syndrome operate in concert with or without obesity, and imply the existence of a true syndrome that is not simply a collection of covariates driven by obesity. Using the NCEP ATP III criteria, Ford, Giles, and Dietz (2002) reported that approximately 24 percent of US adults have the metabolic syndrome and that its prevalence is age-dependent and sexually dimorphic. These findings agree with ours. However, in the FLS, men (27.7%) had a greater prevalence of metabolic syndrome than women (20.7%). The frequency distribution of risk factors that contribute to the metabolic syndrome differs greatly between men and women. The FLS women are more likely than the FLS men to meet the criteria for abdominal obesity and low levels of fasting HDL-cholesterol, while the men are more likely than the women to meet the criteria for hypertriglyceridemia, hypertension and IFG.
The impact of the timing of the age at the PHV appears to be related to the onset metabolic syndrome. These results expand our knowledge of the natural history of the development of obesity, hypertension, dyslipidemia, and impaired glucose metabolism, and inform future studies directed at mechanistic relationships. Our findings reveal how the rate of growth in height during childhood may lead either to metabolic and cardiovascular health or disease in adulthood. Elucidating adverse relationships through such a linkage may lead to the early identification of children at high risk for adult cardiovascular disease.
There has been a significant increase in obesity in the US population over the past 25 years. This secular trend toward increasing obesity has also occurred among FLS participants (Sun et al., 2012). While there has been an increase in the prevalence of obesity over the course of the FLS, we do not anticipate that the individual biological relationships in rate of maturation and the onset of the metabolic syndrome will have changed as a result of the secular trend toward increased prevalence of obesity.
Although the FLS cohort is not a US population-based sample terms of race and ethnicity, it is nonetheless a rich and suitable resource for this analysis. The FLS is unique in having serial measurements of hormone levels and direct measurements of body composition on more than 2500 individuals over a period of 35 years. Although nearly all of the subjects in the FLS are non-Hispanic white, information related to associations investigated in this study is lacking in all racial and ethnic groups. While the results of our analysis will apply to non-Hispanic whites, analysis of this extensive longitudinal data set may also elucidate biologic relationships that apply to other races and ethnicities as well as to whites.
Conclusions
The mean age of the PHV in the FLS population is 13.5±1.3 years for boys and 11.5±0.9 years for girls. The mean differences between a slow rate of maturation and a rapid rate of maturation are approximately 1.4 y for boys and 1.1 y for girls. Yet, the onset of the metabolic syndrome in males with a slow rate of maturation versus a rapid rate of maturation was 50.0 y vs. 43.7 y of age and 56.4 y vs 45.9 y of age for females.
In the FLS, men had a greater prevalence of the metabolic syndrome than women. The frequency distributions of risk factors that contribute to the metabolic syndrome differed greatly between men and women. The FLS women are more likely than the FLS men to meet the criteria for abdominal obesity and low levels of fasting HDL-cholesterol, while men are more likely than women to meet the criteria for hypertriglyceridemia, hypertension and impaired fasting glucose.
Females with an early PHV had significantly greater abdominal obesity than those with a late PHV. Males who had an early PHV had an earlier onset of elevated levels of fasting plasma glucose, elevated triglycerides, and low HDL-cholesterol levels (P=0.009, 0.009, and 0.002, respectively). No other differences were observed between the PHV groups and the risk factors for the metabolic syndrome.
Figure 4.
Cumulative risk of developing elevated blood pressure for curtailed versus prolong juvenile state.
Figure 5.
Cumulative risk of developing impaired fasting plasma glucose concentration for curtailed versus prolong juvenile state.
Figure 6.
Cumulative risk of developing dyslipidemia for curtailed versus prolong juvenile state.
References
- 1.Anonymous. Manual of Laboratory Operations I: Lipid and Lipoprotein Analysis. National Heart, Lung and Blood Institute, National Institutes of Health, US Government Printing Office, Lipid Research Clinics Program; Bethesda, Maryland: 1974. p. Report Number 75628. [Google Scholar]
- 2.Armitage JA, Taylor PD, Poston L. Experimental models of developmental programming: consequences of exposure to an energy rich diet during development. Physiol. 2005;565(Pt 1):3–8. doi: 10.1113/jphysiol.2004.079756. [DOI] [PMC free article] [PubMed] [Google Scholar]
- 3.Beckman KB, Ames BN. The Free Radical Theory of Aging Matures. Physiol Rev. 1998;78:547–581. doi: 10.1152/physrev.1998.78.2.547. [DOI] [PubMed] [Google Scholar]
- 4.Berenson GS, Srinivasan SR, Bao W, Newman WP, III, Tracy RE, Wattingney WA. Association between multiple cardiovascular risk factors and atherosclerosis in children and young adults. N Engl J Med. 1998;338:1650–56. doi: 10.1056/NEJM199806043382302. [DOI] [PubMed] [Google Scholar]
- 5.Bodkin NL, Alexander TM, Ortmeyer HK, Johnson E, Hansen BC. Mortality and Morbidity in Laboratory-maintained Rhesus Monkeys and Effects of Long-term Dietary Restriction. J Gerontol A Biol Sci Med Sci. 2003;58:B212–219. doi: 10.1093/gerona/58.3.b212. [DOI] [PubMed] [Google Scholar]
- 6.Droge W. Free Radicals in the Physiological Control of Cell Function. Physiol Rev. 2002;82:47–95. doi: 10.1152/physrev.00018.2001. [Abstract] [Full Text] [DOI] [PubMed] [Google Scholar]
- 7.Duan T, Liang MF, Gu SY. Human anti-HCMV neutralizing Fab antibody generated by phage display library. [PubMed] [Google Scholar]
- 8.Executive Summary of the Third Report of the National Cholesterol Education Program (NCEP) andTreatment of High Blood Cholesterol in Adults (Adult Treatment Panel III) JAMA. 2001;285:2486–97. doi: 10.1001/jama.285.19.2486. [DOI] [PubMed] [Google Scholar]
- 9.Ford ES, Giles WH, Dietz WH. Prevalence of the Metabolic Syndrome Among US Adults, Findings form the Third National Health and Nutrition Examination Survey. JAMA. 2002;287(3):356–359. doi: 10.1001/jama.287.3.356. [DOI] [PubMed] [Google Scholar]
- 10.Ford ES, Giles WH, Dietz WH. Prevalence of the Metabolic Syndrome Among US Adults, Findings form the Third National Health and Nutrition Examination Survey. JAMA. 2002;287(3):356–359. doi: 10.1001/jama.287.3.356. [DOI] [PubMed] [Google Scholar]
- 11.Garemo M, Palsdottir V, Strandvik B. Metabolic markers in relation to nutrition and growth in healthy 4-y-old children in Sweden. Am J Clin Nutr. 2006 Nov;84(5):1021–6. doi: 10.1093/ajcn/84.5.1021. [DOI] [PubMed] [Google Scholar]
- 12.Himes JH, Obarzanek E, Baranowski T, Wilson DM, Rochon J, McClanahan BS. Early sexual maturation, body composition, and obesity in African-American girls. Obes Res. 2004 Sep;12(Suppl):64S–72S. doi: 10.1038/oby.2004.270. [DOI] [PubMed] [Google Scholar]
- 13.IOM. Bridging the gap in obesity prevention: A framework to inform decision making. Washington DC: The National Academies Press; 2010. [PubMed] [Google Scholar]
- 14.IOM. Accelerating progress in obesity prevention. Washington DC: The National Academies Press; 2012. [Google Scholar]
- 15.Julian D, Leeuwenburgh C. Linkage between insulin and the free radical theory of aging. Am J Physiol Regul Integr Comp Physiol. 2004;286:R20–R21. doi: 10.1152/ajpregu.00522.2003. [DOI] [PubMed] [Google Scholar]
- 16.Kahn R. Follow-up Report on the Diagnosis of Diabetes Mellitus. The Expert Committee on the Diagnosis and Classification of Diabetes Mellitus. Diabetes Care. 2003;26:3160–3167. doi: 10.2337/diacare.26.11.3160. [DOI] [PubMed] [Google Scholar]
- 17.Kaplowitz PB, Slora EJ, Wasserman RC, Pedlow SE, Herman-Giddens ME. Earlier onset of puberty in girls: relation to increased body mass index and race. Pediatrics. 2001;108:347–353. doi: 10.1542/peds.108.2.347. [DOI] [PubMed] [Google Scholar]
- 18.Keenan KP, Ballam GC, Dixit R, Soper KA, Laroque P, Mattson BA, Adams SP, Coleman JB. The effects of diet, overfeeding and moderate dietary restriction on Sprague-Dawley rat survival, disease and toxicology. J Nutr. 1997 May;127(5 Suppl):851S–856S. doi: 10.1093/jn/127.5.851S. Review. [DOI] [PubMed] [Google Scholar]
- 19.Lee JM, Appugliese D, Kaciroti N, Corwyn RF, Bradley RH, Lumeng JC. Weight status in young girls and the onset of puberty. Clin Endocrinol (Oxf) 2007 Sep;67(3):462–7. doi: 10.1542/peds.2006-2188. Epub 2007 Jun 11. [DOI] [PubMed] [Google Scholar]
- 20.Lohman GT, Roche AF, Martorell R. Anthropometric Standardization Reference Manual. Human Kinetics; Champaign, IL: [Google Scholar]
- 21.Malina RM, Bouchard C. Growth, Maturation, and Physical Activity. Human Kinetics; Chicago, IL: 2004. Bar-Or Oded. [Google Scholar]
- 22.National Institutes of Health. Third Report of the National Cholesterol Education Program Expert Panel on Detection, Evaluation, and Treatment of High Blood Cholesterol in Adults (Adult Treatment Panel III) Bethesda, MD: National Institutes of Health; 2001. NIH Publication 01-3670. [Google Scholar]
- 23.National Institutes of Health. Third Report of the National Cholesterol Education Program Expert Panel on Detection, Evaluation, and Treatment of High Blood Cholesterol in Adults (Adult Treatment Panel III) Bethesda, MD: National Institutes of Health; 2001. NIH Publication 01-3670. [PubMed] [Google Scholar]
- 24.Ogden CL, Carroll MD, Flegal KM. High body mass index for age among US children and adolescents 2003–2006. JAMA. 2008;299:2401–2405. doi: 10.1001/jama.299.20.2401. [DOI] [PubMed] [Google Scholar]
- 25.Reaven G. Banting lecture 1988: Role of insulin resistance in human disease. Diabologia. 1988;30:1595–1607. doi: 10.2337/diab.37.12.1595. [DOI] [PubMed] [Google Scholar]
- 26.Reinehr T, Kiess W, de Sousa G, Stoffel-Wagner B, Wunsch R. Intima media thickness in childhood obesity: relations to inflammatory marker, glucose metabolism, and blood pressure. Metabolism. 2006 Jan;55(1):113–8. doi: 10.1016/j.metabol.2005.07.016. [DOI] [PubMed] [Google Scholar]
- 27.Remsberg KE, Schubert CM, Chumlea WC, Sun SS, Demerath EW, Czerwinski SA, Towne B, Siervogel RM. Age at menarche and cardiovascular disease (CVD) risk factors in adolescent girls: The Fels Longitudinal Study. Circulation. 2003;107(7):e7001. 34. [Google Scholar]
- 28.Rozé C, Doyen C, Le Heuzey MF, Armoogum P, Mouren MC, Léger J. Predictors of late menarche and adult height in children with anorexia nervosa. Clin Endocrinol (Oxf) 2007 Sep;67(3):462–7. doi: 10.1111/j.1365-2265.2007.02912.x. Epub 2007 Jun 11. [DOI] [PubMed] [Google Scholar]
- 29.Sinclair DA. J Physiol. Toward a unified theory of caloric restriction and longevity regulation 2005. J Physiol. May 15;565(Pt 1):3–8. doi: 10.1016/j.mad.2005.03.019. Epub 2005 Feb 3. [DOI] [PubMed] [Google Scholar]
- 30.Sinha R, Fisch G, Teague B, Tamborlane WV, Banyas B, Allen K, Savoye M, Rieger V, Taksali S, Barbetta G, Sherwin RS, Caprio S. Prevalence of impaired glucose tolerance among children and adolescents with marked obesity. N Engl J Med. 2002;346 (11):802–10. doi: 10.1056/NEJMoa012578. [DOI] [PubMed] [Google Scholar]
- 31.Sun SS, Sabo R, Arslanian S, Wu R, Sabo C. Age variation and sexual dimorphism in the sixteen diagnostic clusters of risk factors for the metabolic syndrome. Journal of Public Health. 2012;20:487–497. doi: 10.1007/s10389-012-0490-2. [DOI] [PMC free article] [PubMed] [Google Scholar]
- 32.Sun SS, Schubert CM. Prolonged juvenile states and delay of cardiovascular and metabolic risk factors: the Fels longitudinal study. J Pediatr. 2009;155:S7, e1–e6. doi: 10.1016/j.jpeds.2009.04.050. [DOI] [PMC free article] [PubMed] [Google Scholar]
- 33.Warren MP, Goodman LR. Exercise-induced endocrine pathologies. J Endocrinol Invest. 2003 Sep;26(9):873–8. doi: 10.1007/BF03345238. Review. [DOI] [PubMed] [Google Scholar]
- 34.Warren MP, Shantha S. Baillieres Best Pract Res Clin Endocrinol Metab. 2000 Mar;14(1):37–53. doi: 10.1053/beem.2000.0052. Review. The female athlete. [DOI] [PubMed] [Google Scholar]


