Abstract
The Simbox mission was the first joint space project between Germany and China in November 2011. Eleven-day-old Arabidopsis thaliana wild type semisolid callus cultures were integrated into fully automated plant cultivation containers and exposed to spaceflight conditions within the Simbox hardware on board of the spacecraft Shenzhou 8. The related ground experiment was conducted under similar conditions. The use of an in-flight centrifuge provided a 1 g gravitational field in space. The cells were metabolically quenched after 5 days via RNAlater injection. The impact on the Arabidopsis transcriptome was investigated by means of whole-genome gene expression analysis. The results show a major impact of nonmicrogravity related spaceflight conditions. Genes that were significantly altered in transcript abundance are mainly involved in protein phosphorylation and MAPK cascade-related signaling processes, as well as in the cellular defense and stress responses. In contrast to short-term effects of microgravity (seconds, minutes), this mission identified only minor changes after 5 days of microgravity. These concerned genes coding for proteins involved in the plastid-associated translation machinery, mitochondrial electron transport, and energy production.
1. Introduction
Gravitation biology is a field of research which has made considerable progress within the last years, involving prokaryotes, fungi, plants, and animals. Plants are especially interesting, because, as sessile organisms, they possess high versatility in responding to environmental challenges and abiotic as well as biotic ones. In order to investigate responses to altered gravitation, a large range of methods is available that allows for modification of the Earth's gravitational field. These involve centrifugation (hypergravity), clinorotation, magnetic levitation, and random positioning (simulated microgravity), or parabolic flights of planes and sounding rockets, as well as satellites and spacecrafts (deliver microgravity). Experiments with plants show that not only tissues and organelles [1, 2] but also single-cell systems like characean rhizoids [3–7] as well as spores (Ceratopteris richardii, [8, 9]) and protoplasts [10–12] or homogeneous cell cultures (Arabidopsis thaliana) exhibit gravisensitivity [2, 13–16]. Experimental approaches that analyze the response to altered gravitation such as transcriptomics, proteomics, and metabolomics dominate recently. First molecular approaches were using transcriptomics, that is, the search for genes which change their expression under altered gravitation. In plants, like in other organisms, the improvement of gene expression quantification technologies, together with growing databases, supports this development considerably. To date, databases are available that exhibit plant datasets representing their response to diverse experimental stimuli [17–20]. They show that external signals are translated into biochemical ones, resulting in molecular signaling cascades which eventually result in a life-sustaining adaptation process.
For Arabidopsis (Arabidopsis thaliana) cell suspension cultures, the response to short-term microgravity was investigated intensely in our group by means of parabolic flights [21]. A combination of transcriptomics with phosphoproteomics showed that changes in gene expression and protein modification occur within seconds. The investigation of effects caused by longer-lasting microgravity depends on much scarcer availability of respective flight opportunities. However, data on cellular and molecular long-term responses of plants such as Brassicaceae (Arabidopsis), Fabaceae, and Poaceae has recently been published [2, 15, 22–31]. With regard to long-term experiments on gene expression, there are conflicting reports. Stutte et al. [30], for example, could not observe differentially expressed genes (DEGs) above a 2-fold cut-off in 24-day-old wheat leaves after a 21-day-space mission. In contrast, Paul et al. [15, 24] detected many DEGs in nearly 20-day-old Arabidopsis callus cultures and 18-day-old seedlings after a nearly 13-day-space mission. Furthermore, the set of altered genes detected in whole seedlings was different from that in callus cultures [15]. Thereby, the spaceflight-mediated upregulated expression of heat shock proteins appeared to be an age-independent cell culture specific response [15, 16]. Within the so-called TROPI-2 experiment, only 24 genes were altered in their abundance in Arabidopsis seedlings [2], due to possible microgravity effects after 4 days. In addition, these authors reported differences between the 1 g ground sample and the 1 g in-flight controls, with over 200 DEGs [2]. Also Zhang et al. [32] observed a greater difference between flight and ground samples with respect to 1 g in-flight conditions. These observations indicate that the differing results could be related to the organisms investigated, the time of exposure, hardware, experimental parameters, and set-up.
In this study, we report on results of a spaceflight experiment. This experiment was part of the Simbox (Science in Microgravity Box) mission, a joint project between the space agencies from Germany (Deutsches Zentrum für Luft- und Raumfahrt e. V.) and China (China Manned Space Engineering) in November 2011. As one out of 17 biological experiments, semisolid callus cultures of Arabidopsis were exposed to a 17-day spaceflight on board of the Chinese spacecraft Shenzhou 8. Due to reduced viability after longer periods of exposure within the flight hardware, the callus cultures were metabolically quenched after 5 days in space. Results of a whole-genome microarray screening (μg exposed samples, 1 g in-flight samples kept in a reference centrifuge, and 1 g ground samples) revealed major differences between both 1 g controls but a minor impact of microgravity.
2. Material and Methods
2.1. Experiment-Specific Hardware (HW)
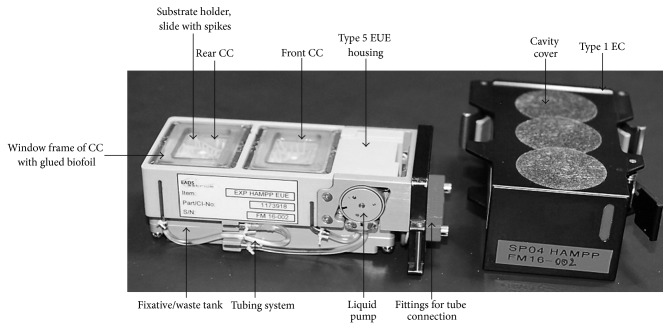
The Simbox was a modification of the Biobox-6 [33, 34] which was developed for unmanned recoverable capsules and space shuttle missions. Development and production were carried out by Astrium/EADS, Friedrichshafen, Germany [35]. This incubator (size of 461 × 551 × 273 mm, internal volume of 34 L, max. power consumption of 130 W, and empty mass of 17 kg) served as carrier for an experiment/static platform with an integrated centrifuge rotor (provides 1 g in-flight control). The Simbox incubator (Figure 1) enabled sample cultivation at 22–24°C (nominal temperature range) and 30–40% humidity throughout the mission. A duplicate model of the Simbox was constructed for the ground experiment. Our biological approach (experiment number 16) was realized by means of three fully automated type V Experiment Unit Envelopes (EUE, plant cultivation unit, without illumination). EUEs consisted of support housing made of polyetherketone with two culture chambers each (front and rear CC, 31.7 × 24 × 14.3 mm ± 0.15 mm). Our biological material was positioned on substrate holders (slides) with plastic spikes (Figure 2). The latter were needed to keep the cultures in place. In order to allow gas exchange, the CCs were sealed with a biofoil made of polysulfone (Tecason S Polysulfone, Ensinger Inc., Washington-Pennsylvania, USA). In addition, a peristaltic pump (flow rate of ≥2.43 mL/min) was used to connect the CC to a fixative/waste unit (volume 20.3 mL ± 0.5 mL). EUEs were accommodated inside type I Experiment Containers (ECs) (Figure 3). Via sensors, parameters such as temperature, humidity, CO2, and O2 content as well as activation of the pump system were recorded and transmitted.
Figure 1.
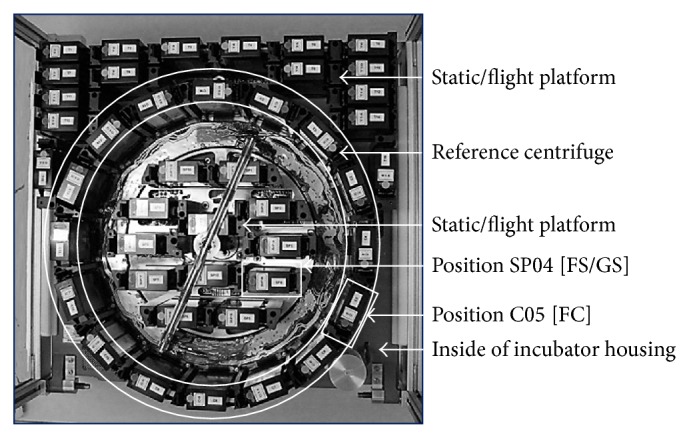
Photograph of the inside of the Simbox incubator used within the flight/ground experiment (housing removed). The rotor of the reference centrifuge (position C05 for sample group FC) is indicated by a circle. The static experimental platform is in the middle and outside of the centrifuge rotor (position SP04 for sample group FS within the flight experiment and GS within the ground experiment, resp.) (photograph: DLR/Astrium).
Figure 2.
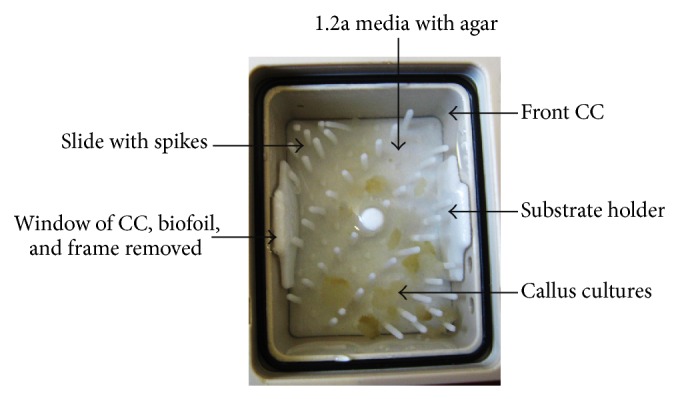
Photograph of the inside of one culture chamber (CC) (experiment container (EC), window, biofoil, and frame removed). The semisolid callus cultures were positioned on substrate holders (slides) with plastic spikes on 1.2a agar containing culture media.
Figure 3.
Photograph of the fully automated plant cultivation unit, type V EUE (left side), and EC removed (right side) (photograph: DLR/Astrium).
2.2. Cell Cultures
Sterile cuttings (about 50 mm long) of stems of wild type Arabidopsis thaliana (cv. Columbia Col-0) plants were used for callus formation on 1.2a media [36] containing 1% agar (Sigma-Aldrich, Germany). Calli were transferred to 500 mL Erlenmeyer flasks with 200 mL liquid 1.2a medium and cultivated under sterile conditions at 23°C in the dark on a rotary shaker (130 rpm, Infors, Bottmingen, Switzerland), as described previously [14]. New medium was added every week to the resulting cell suspension. Eight months before the Simbox mission, an aliquot of this culture (3 g) was spread on 6 cm Petri dishes (Greiner Bio-One, Frickenhausen, Germany) containing agar and 1.2a medium. Cell cultures were mailed to the Institute of Physiology and Ecology, Shanghai (Laboratory of Prof. Zheng), and the cultivation continued (as liquid suspension) as described above. These suspension cultures were transferred to the PITC (Payload Integration and Test Center, Beijing, China). The cultivation was then continued on agar plates (see above) and, finally these semisolid calli were brought to the launch site (Jiuquan Satellite Launch Center, Jiuquan, China) by plane.
2.3. Preparation of Final Experiment Configuration
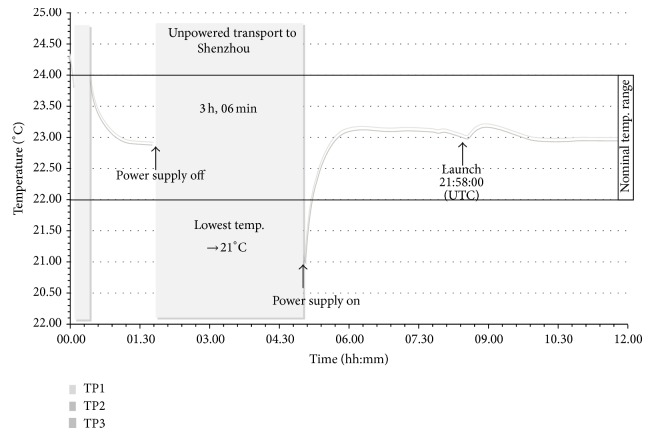
One day before the launch, 11-day-old semisolid callus cultures were transferred into the CCs with 2 mL agar containing medium (Figures 2 and 3). Two ECs were used for the spaceflight (flight models: FM 16001 and FM 16002) and one for the ground experiment (FM 16003), respectively. One of the two ECs was contained in the centrifuge rotor, and the other one was fixed at the experiment/static platform (flight platform), respectively (Figure 1). Metabolic quenching of the samples was by the injection of RNAlater (Ambion, Life Technologies, Darmstadt, Germany). This reagent is also used to stabilize nucleic acids. Twenty mL of this fixative was filled into the fixative/waste unit attached to the bottom of the EC. Between handover and integration into the Simbox flight/ground incubator, the ECs were stored at nominal laboratory temperature conditions (22–24°C). The Simbox incubator was unpowered for about 3 hours during transport to the spacecraft. During this time, the lowest temperature was 21°C (Figure 4).
Figure 4.
Temperature profile as recorded by 3 temperature sensors (TP1-3) attached to the Simbox incubator during integration of ECs into the incubator, transport to Shenzhou, and launch (data: Astrium).
2.4. The Experiment in Orbit
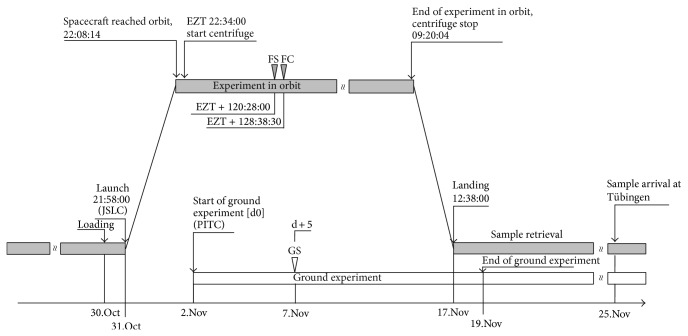
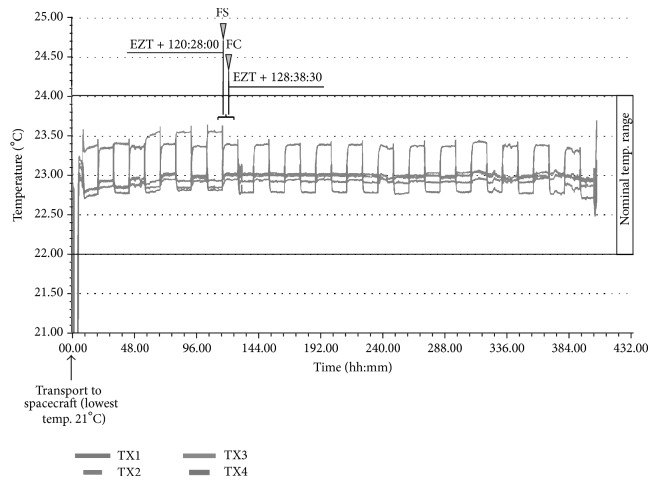
The Simbox was launched on board of the unmanned spacecraft Shenzhou 8 on October 31, 2011, at 21:58 UTC (universal time coordinated) with a Long March 2F rocket from the cosmodrome in JSLC. The precise mission timings including sample fixation time points are illustrated in Figure 5 (for a gravity-level profile, see Supplementary Material S1 available online at http://dx.doi.org/10.1155/2014/547495). Experiment zero time (EZT) was set when the spacecraft reached the orbit. At EZT, the centrifuge was activated to run with 74.40 rpm. Within the spacecraft, the oxygen partial pressure ranged from 18.04 to 27.32 kPa, and the carbon dioxide partial pressure was between −0.03 and 0.46 kPa. Radiation measurements yielded a total dose of 5.93 to 8.1 mSv and an equivalent dose of 0.37 to 0.51 mSv/d near the Simbox incubator (telemetry data: Chinese authorities, personal communication). The pump system was activated after 5 days in space and injected the fixative solution from the fixative/waste unit into the CC's of FMs. This yielded a final RNAlater concentration of about 90% (v/v) after mixing. Temperature in CCs was kept at a nominal range of 22 to 24°C before, during, and after fixation (Figure 6). After 17 days in space, the spacecraft was separated from Tjangong-1 and touched ground on November 17, 2011. After landing and recovery of the capsule, samples were retrieved within 6 hours. The ECs were disassembled and stored around 4°C until they arrived in Tübingen on November 25, 2011. In the home laboratory, calli were harvested and stored at −80°C until processing.
Figure 5.
Precise mission timeline of the experiment in orbit (grey) and related ground experiment (white). Universal time coordinated (UTC), time units are given in hours:minutes: seconds, experimental zero time (EZT). Arrowheads (∇) indicate sample fixation time points of sample groups FS, FC, and GS, respectively.
Figure 6.
Temperature profile as recorded by 4 temperature sensors (TX1-4) attached to the Simbox incubator during the whole Simbox mission (data: Astrium). Sample fixation time points for the spaceflight samples (FS and FC) are indicated by arrowheads (grey triangle).
2.5. Ground Control
Immediately after the launch, the laboratory equipment and cell cultures were brought back to the PITC by Chinese scientists. The ground experiment started with a one-day delay on November 2, 2011 (Figure 5). The EUE was integrated into the Simbox duplicate, according to the position in the flight incubator (experiment/static platform), and kept at 23°C. As in the experiment in orbit, samples were metabolically quenched after 5 days (November 7). The ground experiment ended on November 19. The samples were handled as described for the experiment in orbit.
2.6. Experiment Conditions and Specification of Generated Samples
During the Simbox mission, the samples were exposed to different experimental conditions. In the experiment in orbit, FM 16002 was attached to the static platform of the Simbox incubator and experienced 5 days of microgravity (group FS, Flight Static). FM 16001 was centrifuged, resulting in a 1 g control (group FC, in-flight centrifugation). In the ground experiment, the same experimental design was used. FM 16003 was fixed to the static platform (group GS, ground static). In summary, we obtained one biological sample per CC, resulting in two replicates for each FM (front and rear CC) and for each experimental condition, respectively.
2.7. Isolation of Total RNA and High-Density Oligonucleotide Arrays
Total RNA was extracted using the RNeasy Plus kit (Qiagen, Hilden, Germany) according to the manufacturer's instructions. Quantity and quality controls were performed and samples were processed using the MessageAmp II-Biotin Enhanced, Single Round aRNA Amplification Kit (Ambion, Life Technologies, Darmstadt, Germany) as described earlier [21, 37]. Fragmented, biotin-labeled aRNA was then submitted to a high throughput microarray analysis (GeneChip Arabidopsis ATH1 Genome Array, Ref: 510690, LOT: 4155830, Affymetrix, Santa Clara, California, USA). Hybridization was performed according to the manufacturer's instructions (for details, see http://www.affymetrix.com/support/technical/manuals.affx). The Affymetrix protocol EukGE-WS2_V4 was used for washing and staining procedures.
2.8. Gene Expression Analysis
Expression data were calculated from raw values of the detected signal intensity of hybridization events of all spotted probe sets and saved as .CEL data files. Microarray data are available in the ArrayExpress database (http://www.ebi.ac.uk/arrayexpress, [38]) under accession number E-MTAB-2518. For integrative data analysis, we used the open-source software Mayday [39]. Normalization was performed using the robust multiarray average method of background-adjustment, quantile-normalization, and median-polish to ensure comparability of arrays and estimate log2 expression values [40–42]. Hierarchical clustering was performed by means of the neighbour joining method [43] in order to reconstruct and visualize relationships within expression values due to experiment conditions. The Pearson Correlation coefficient was used to calculate the distance between each experimental condition (FS, FC, and GS) and biological replicates (front and rear CC). The matrix of variant genes was filtered and subjected to a Student's t-test (P ≤ 0.1) with combined false discovery rate (FDR) correction to identify significantly altered transcripts (P < 0.1) between the sample groups FS and FC, FS, and GS, and FC and GS, respectively. Differentially expressed genes were determined by fold change (fc) calculation of log2 transformed expression data. Thereby, the threshold was set at −1 ≥ log2 (fold change) ≥ 1 for at least 2-fold altered transcripts [40, 41, 44]. Additionally, the Affymetrix probe identifiers were tested by Gene Set Enrichment Analysis (GSEA, [45]) for enrichment of functional ontologies using Gene Ontology terms [46] within Mayday. Thereby, we focused on genes that share their function in identical biological processes for interpreting the genome-wide expression profiles.
3. Results
The aim of this experiment was to characterize the transcriptome of Arabidopsis semisolid callus cultures after 5 days in space. Due to the availability of an in-flight centrifuge, it was possible to compare expression data with (a) real microgravity samples (thought to yield the microgravity related alterations) and with (b) those from the ground controls (which should deliver effects of nonmicrogravity related spaceflight conditions). This was achieved with high-density oligonucleotide arrays.
3.1. Performance of Hardware and Biological Material
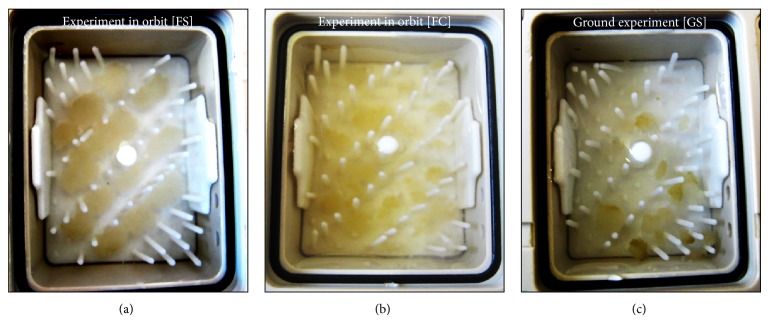
The hardware was thoroughly tested in order to retain viability of the callus cultures for as long as possible. These tests were focused on the biocompatibility of the used materials, gas-exchange properties of membranes, and viability of the cell cultures under the cultivation conditions within the EC. We also recorded the oxygen content within the CC [37]. As this declined from 8 to about 2 mg/L after 5 days, automated sample fixation was set at day 5 after take-off. Mission parameters, such as temperature, were within nominal range during the mission. Radiation measurements recorded increased values. After landing and return of the biological material to the University of Tübingen (Germany), the samples were visually checked. The fixed calli showed good morphology and had well grown during the initial culture of 5 days in space. The calli from the 1 g controls (flight and ground experiment) were smaller compared to those exposed to microgravity (Figure 7).
Figure 7.
Photograph of Arabidopsis thaliana semisolid callus cultures after a 5-day µg cultivation in orbit ((a), FS), 1 g in-flight cultivation ((b), FC) or on ground ((c), GS). The photographs were taken after fixation by RNAlater and recovery of the spacecraft.
3.2. Biology of Samples and Gene Expression Analysis
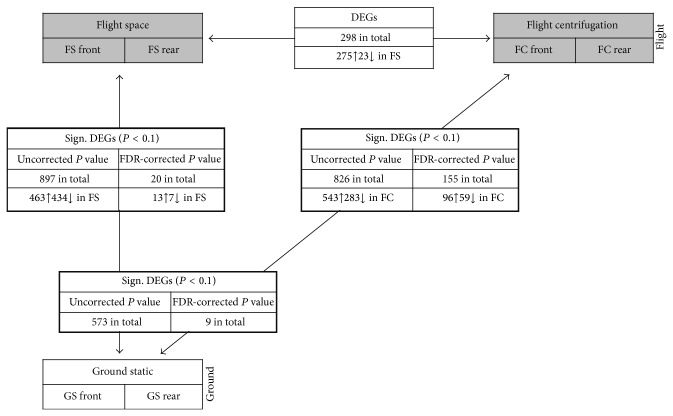
The quality of the extracted total ribonucleic acid was satisfying for GeneChip hybridization (for RNA quality, see Supplementary Material S2) with clear bands representing the 28S and 18S rRNA. Whole-genome microarray screening was performed for each sample. Due to the limited amount of total RNA, the confirmation of expression data by quantitative real-time PCR was not possible. The data analysis revealed experiment-specific properties of biological replicates which were visualized by hierarchical clustering on the basis of the calculation of the Pearson Correlation coefficient (Figure 8). In this graph, a relatively short distance implies a high correlation between the samples. As obvious from Figure 8, the flight and ground experiment showed group-based clustering. The short distance between FS and FC (FS and FC boxes) in contrast to GS (GS boxes) indicates that nonmicrogravity related spaceflight conditions have major impact. The transcriptome of the biological replicates within the experiment groups (front and rear chamber of FS, FC, GS; n = 2) showed a high degree of similarity (Figure 8). This fact was confirmed by heat map generation based on calculated correlations (Figure 9). The Pearson Correlation was about 0.99 between front and rear CC for all three modules (FS, FC, and GS, n = 2, Figure 9). Statistical (Student's t-test, P < 0.1, and FDR correction) and comparative analysis showed a relatively low response of semisolid callus cultures (Figure 10). Interestingly, microgravity conditions did not induce statistically significant changes (P < 0.1) at the gene expression level, although 298 genes were at least 2-fold differentially expressed (275 up- and 23 downregulated) within flight space (FS) samples. In contrast, nonmicrogravity related spaceflight conditions interfered with gene expression, considerably. Eight hundred ninety-seven genes were significantly and differentially expressed (at least 2-fold, P < 0.1) when 1 g ground and μg exposed flight samples were compared. Among them, 463 were upregulated and 434 genes were downregulated within FS (Figure 10). Comparison between both 1 g controls (in-flight, ground) resulted in 826 significantly (P < 0.1) differentially altered genes (543 up and 283 downregulated, Figure 10). Thereby, 573 significant DEGs (P < 0.1) were identical in both comparisons (Figure 10).
Figure 8.
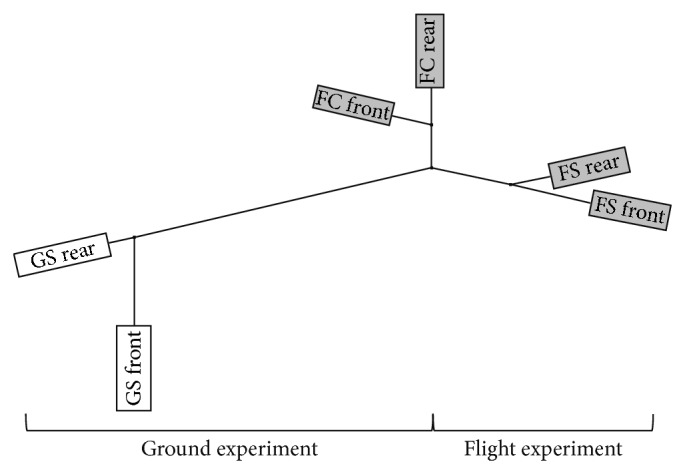
Hierarchical clustering by means of the neighbour joining method of generated sample groups (white: ground experiment; GS: ground static; grey: flight experiment; FS: flight space; FC: in-flight centrifugation). Each EUE consisted of two culture chambers (front and rear chambers, illustrated by boxes).
Figure 9.
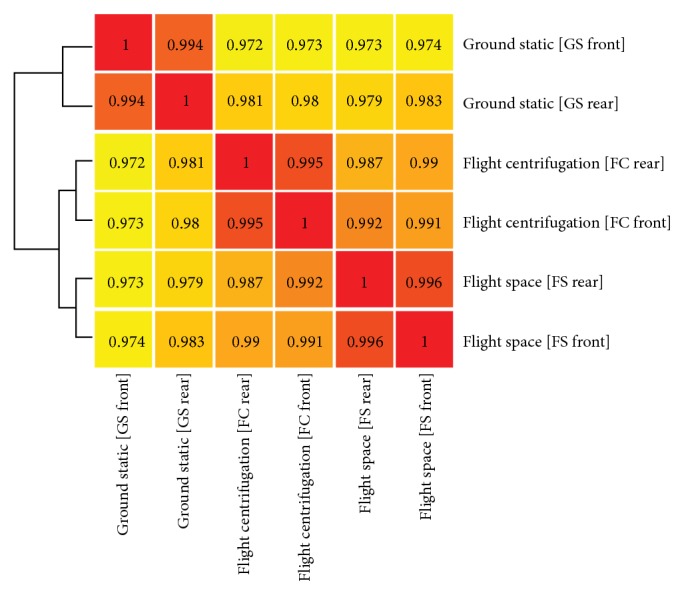
Pearson correlation heat map shows high degree of similarity between front and rear culture chamber of each sample within each sample group. Flight space (FS), in-flight centrifugation (FC), and ground static (GS).
Figure 10.
Overview of the number of differentially (fold change (fc) at least 2) and significantly expressed genes (DEGs, P < 0.1) within the flight (grey) and ground (white) experiment. The different sample groups are illustrated by boxes. Up- and downregulated transcripts are symbolized by arrows behind the number of altered genes. Genes that are significantly (P < 0.1) differentially expressed are shown in boxes framed in black (bold lines).
3.3. Identification of Altered Genes after Long-Term Microgravity
For detection of gene expression changes due to μg exposure, we compared data generated out of the sample groups flight space (FS) and in-flight centrifugation (FC). Two hundred seventy-five genes were at least 2-fold differentially upregulated and 23 downregulated (Figure 10). The application of statistics showed that there were no significant (P < 0.1) alterations at the expression level after 5 days in space. By means of a Gene Ontology [46] based Gene Set Enrichment Analysis (GSEA), the DEGs were related to common biological processes. In order to identify processes which are specifically influenced by microgravity conditions, we compared overrepresented processes that were identical between sample group FS versus FC and FS compared to GS (Table 1). Most prominent were effects on the translation machinery (Table 1, gene set number 24). Interestingly, all genes that were differentially upregulated and involved in translation processes were chloroplast-encoded. This gene set comprises genes coding for several protein subunits and components of ribosomes (e.g., ATCG00065, ATCG00660, ATCG00770, and ATCG00790) but also the nucleus-encoded translation initiation factor EIF-5A (AT1G13950) that is well known to regulate translation initiation and termination within the cytoplasma of eukaryotes (Table 2). The other part of identified differentially upregulated genes is involved in electron transport chains located within mitochondria (Table 1, gene sets number 4, 8 and 11) such as subunits of the NADH dehydrogenase multi-enzyme complex of the respiratory chain (ATMG00650, ATMG00070, ATMG00580) (Table 2). Mitochondrial electron transport is connected to the production of adenosine triphosphate (ATP). Thus, the gene set representative for ATP biosynthesis was also part of the DEGs (ATCG00120, ATMG00410, ATCG00480, and ATCG00150) (Table 2). Within the 23 downregulated genes (at least 2-fold), no special gene sets could be found, but the largest group codes for heat shock proteins (AT4G27670, AT2G29500, AT5G12020, AT5G59720, AT4G25200, AT1G53540, and AT5G12030).
Table 1.
Visualization of enriched Gene Ontology categorization terms (GSEA, Gene Set Enrichment Analysis of biological processes). Gene sets identical in FS/FC and FS/GS are not colored; the ones identical in FS/GS, FC/GS and the overlap of both are in bold font (FS = flight space; FC = flight centrifugation, and GS = ground static).
| Number | Enriched gene set (biological process) | FS/FC | FS/GS | FC/GS | Overlap |
|---|---|---|---|---|---|
| Gene set size | |||||
| 1 | ATP catabolic process | 0 | 8 | 8 | 7 |
| 2 | ATP biosynthetic process | 10 | 9 | 0 | 0 |
| 3 | Defense response | 0 | 20 | 26 | 14 |
| 4 | Mitochondrial electron transport chain | 7 | 7 | 0 | 0 |
| 5 | Lipid metabolic process | 0 | 8 | 7 | 6 |
| 6 | MAPK cascade | 0 | 29 | 36 | 27 |
| 7 | Metabolic process | 0 | 25 | 20 | 16 |
| 8 | Mitochondrial electron transport | 11 | 11 | 0 | 0 |
| 9 | Oxidation-reduction process | 0 | 13 | 12 | 8 |
| 10 | Photosynthesis, light harvesting | 0 | 5 | 5 | 5 |
| 11 | Photosynthetic electron transport chain | 5 | 5 | 0 | 0 |
| 12 | Protein phosphorylation | 0 | 23 | 31 | 18 |
| 13 | Protein targeting to membrane | 0 | 12 | 13 | 10 |
| 14 | Regulation of transcription, DNA-dependent | 0 | 12 | 11 | 8 |
| 15 | Respiratory burst involved in defense response | 0 | 22 | 26 | 21 |
| 16 | Response to chitin | 0 | 7 | 6 | 6 |
| 17 | Response to ethylene stimulus | 0 | 5 | 6 | 5 |
| 18 | Response to hypoxia | 0 | 6 | 9 | 6 |
| 19 | Response to oxidative stress | 0 | 15 | 13 | 9 |
| 20 | Response to stress | 0 | 9 | 9 | 6 |
| 21 | rRNA processing | 0 | 16 | 15 | 14 |
| 22 | Toxin catabolic process | 0 | 7 | 7 | 6 |
| 23 | Transition metal ion transport | 0 | 10 | 12 | 8 |
| 24 | Translation | 27 | 28 | 0 | 0 |
| 25 | Two-component signal transduction system | 0 | 6 | 5 | 5 |
Table 2.
Differentially expressed genes (fold change (fc) at least 2) within the sample group flight space (FS, front/rear CC) compared to in-flight centrifugation (FC). Samples taken after 5-day cultivation at microgravity and sorted according to the overrepresented biological processes identified by GSEA to be the most prominent.
| Number | ATG number | Gene name/description | log(fc) | Enriched Gene set (biological process) |
|---|---|---|---|---|
| 1 | ATCG00065 | Ribosomal protein S12 | 2.36 | Translation |
| 2 | ATCG00660 | Ribosomal protein L20 | 2.14 | Translation |
| 3 | ATCG00770 | 30S ribosomal protein S8 | 1.96 | Translation |
| 4 | ATCG00160 | Ribosomal protein S2 | 1.84 | Translation |
| 5 | ATCG00790 | Ribosomal protein L16 | 1.8 | Translation |
| 6 | ATCG00780 | Ribosomal protein L14 | 1.63 | Translation |
| 7 | AT1G13950 | Eukaryotic translation initiation factor 5A-1 | 1.14 | Translation |
| 8 | ATCG01120 | Ribosomal protein S15 | 1.11 | Translation |
| 9 | ATCG00750 | Ribosomal protein S11 | 1.05 | Translation |
| 10 | ATCG00800 | Ribosomal protein S3 | 1.04 | Translation |
| 11 | ATMG00650 | NADH dehydrogenase subunit 4L | 2.3 | Mitochondrial electron transport |
| 12 | ATMG00060 | NADH dehydrogenase subunit 5 | 1.84 | Mitochondrial electron transport |
| 13 | AT2G07751 | NADH-ubiquinone/plastochinone oxidoreductase | 1.75 | Mitochondrial electron transport |
| 14 | ATCG01050 | Subunit of NAD(P)H dehydrogenase complex | 1.74 | Mitochondrial electron transport |
| 15 | ATMG00160 | Cytochrome c oxidase subunit 2 | 1.66 | Mitochondrial electron transport |
| 16 | ATMG00070 | NADH dehydrogenase subunit 9 | 1.5 | Mitochondrial electron transport |
| 17 | ATCG00420 | NADH dehydrogenase subunit J | 1.43 | Mitochondrial electron transport |
| 18 | ATCG01250 | NADH dehydrogenase ND2 | 1.25 | Mitochondrial electron transport |
| 19 | ATMG00510 | NADH dehydrogenase subunit 7 | 1.24 | Mitochondrial electron transport |
| 20 | ATMG00270 | NADH dehydrogenase subunit 6 | 1.24 | Mitochondrial electron transport |
| 21 | ATMG00580 | NADH dehydrogenase subunit 4 | 1.19 | Mitochondrial electron transport |
| 22 | ATCG01070 | NADH dehydrogenase ND4L | 1.13 | Mitochondrial electron transport |
| 23 | ATCG00120 | ATPase α-subunit | 2.15 | ATP biosynthesis |
| 24 | ATCG00140 | ATPase III subunit | 1.59 | ATP biosynthesis |
| 25 | ATMG00410 | ATPase subunit 6 | 1.56 | ATP biosynthesis |
| 26 | ATCG00130 | ATPase F subunit | 1.47 | ATP biosynthesis |
| 27 | ATCG00480 | β-Subunit of ATP synthase | 1.33 | ATP biosynthesis |
| 28 | ATCG00150 | Subunit of ATPase complex CF0 | 1.12 | ATP biosynthesis |
3.4. Attempt to Distinguish between Effects of Microgravity and Nonmicrogravity Related Spaceflight Conditions on Gene Expression
One aim of this investigation was to separate responses to microgravity from those of nonmicrogravity related spaceflight conditions. Until today, only marginal data exist about these effects on plants in space. Thus, we screened for genes that were significantly (P < 0.1) altered within spaceflight samples (FS and FC) compared to the 1 g ground control and were identical between FS and FC compared to GS. This overlap yielded 573 significantly altered (P < 0.1) DEGs (Figure 10). The GSEA of these genes represented diverse biological processes (Table 1, bold font). The majority of these genes could be related to intracellular signaling pathways such as mitogen-activated protein kinase (MAPK) cascades and protein phosphorylation (Table 1, gene set number 6 and 12). Included were different MAP kinases (e.g., AT1G01560, AT1G73500), serine/threonine/tyrosine kinases (e.g., AT1G20650, AT5G16900, and AT4G38470), and many other kinases (Table 3). Furthermore, we identified genes coding for members of the calcium-binding EF-hand protein family (AT3G01830, AT3G47480) and the WRKY transcription factors 54, 70, and 38 (AT2G40750, AT3G56400, and AT5G22570) that have also transcription regulation activity (Table 3). Additionally, the spaceflight environment other than microgravity had a significant (P < 0.1) impact on general stress-responsive (gene set number 20) and defense-related genes (3), especially those involved in the response to oxidative stress and respiratory burst responses (21). These are peroxidases 21, 4, 52, and 25 (AT2G37130, AT1G14540, AT5G05340, and AT2G41480), catalase 3 (AT1G20620), and receptor-like kinases (AT5G46330, AT2G19190). The latter can be induced upon contact with the bacterial protein flagellin which is an important elicitor of the plant defense response. These kinases are also important members of the MAP kinase signaling cascade. Furthermore, general metabolic processes (gene set number 7), protein targeting (13), and rRNA processing (21) were overrepresented due to nonmicrogravity related conditions in space.
Table 3.
Differentially (at least 2-fold) and significantly expressed genes (P < 0.1, 573 in total) that are identical between flight space (FS) as well as in-flight centrifugation (FC) compared to ground static (GS). Changes are due to nonmicrogravity related spaceflight conditions. The genes are sorted according to the overrepresented biological processes identified by GSEA to be most prominent.
| No | ATG number | Gene name/description | log(fc) (P value) FS versus GS |
log(fc) (P value) FC versus GS |
Biological process |
|---|---|---|---|---|---|
| 1 | AT1G01560 | MAP kinase 11 | 1.83 (0.034) | 2.13 (0.027) | MAPK cascade |
|
| |||||
| 2 | AT1G73500 | MAP kinase 9 | 1.34 (0.006) | 1.37 (0.038) | MAPK cascade |
|
| |||||
| 3 | AT3G01830 | Calcium-binding EF-hand family protein | 1.3 (0.032) | 1.85 (0.027) | MAPK cascade |
|
| |||||
| 4 | AT3G47480 | Calcium-binding EF-hand family protein | 1.24 (0.081) | 1.87 (0.037) | MAPK cascade |
|
| |||||
| 5 | AT2G40750 | WRKY DNA-binding transcription factor 54 | 1.29 (0.008) | 1.74 (0.006) | MAPK cascade |
|
| |||||
| 6 | AT3G56400 | WRKY DNA-binding transcription factor 70 | 1.85 (0.008) | 2.19 (0.004) | MAPK cascade |
|
| |||||
| 7 | AT5G22570 | WRKY DNA-binding transcription factor 38 | 2.52 (0.006) | 3.28 (0.004) | MAPK cascade |
|
| |||||
| 8 | AT3G15500 | NAC-domain containing transcription factor 3 | 2.98 (5.72E − 4) | 2.63 (0.003) | MAPK cascade |
|
| |||||
| 9 | AT1G35670 | Calcium-dependent calmodulin-independent protein kinase 2 | 1.2 (0.002) | 1.23 (0.003) | Protein phosphorylation |
|
| |||||
| 10 | AT1G20650 | Serine/threonine protein kinase superfamily protein | −1.4 (0.024) | −1.5 (0.018) | Protein phosphorylation |
|
| |||||
| 11 | AT3G61160 | Serine/threonine protein kinase family protein | −1.22 (0.007) | −1.4 (0.008) | Protein phosphorylation |
|
| |||||
| 12 | AT1G78290 | Serine/threonine protein kinase family protein 2C | 1.71 (0.019) | 2.0 (0.034) | Protein phosphorylation |
|
| |||||
| 13 | AT4G18640 | Serine/threonine protein kinase family protein | 1.08 (0.019) | 1.07 (0.014) | Protein phosphorylation |
|
| |||||
| 14 | AT4G18950 | Serine/threonine/tyrosine protein kinase family protein | 2.53 (0.031) | 3.17 (0.02) | Protein phosphorylation |
|
| |||||
| 15 | AT5G16900 | Leucine-rich repeat protein kinase family protein | 1.42 (0.023) | 2.0 (0.012) | Protein phosphorylation |
|
| |||||
| 16 | AT1G51890 | Leucine-rich repeat protein kinase family protein | 2.55 (0.05) | 2.64 (0.047) | Protein phosphorylation |
|
| |||||
| 17 | AT4G11480 | Cysteine-rich receptor-like protein kinase family protein | 1.56 (0.05) | 1.89 (0.033) | Protein phosphorylation |
|
| |||||
| 18 | AT4G23260 | Cysteine-rich receptor-like protein kinase family protein | 1.65 (0.068) | 2.49 (0.041) | Protein phosphorylation |
|
| |||||
| 19 | AT4G38470 | Tyrosine kinase family protein 46 | 1.14 (0.008) | 1.34 (0.015) | Protein phosphorylation |
|
| |||||
| 20 | AT1G69790 | Protein kinase superfamily protein | 1.19 (0.038) | 1.12 (0.009) | Protein phosphorylation |
|
| |||||
| 21 | AT5G53450 | Protein kinase | 1.88 (0.088) | 1.89 (0.075) | Protein phosphorylation |
|
| |||||
| 22 | AT1G51620 | Protein kinase family protein | 1.8 (0.052) | 2.31 (0.048) | Protein phosphorylation |
|
| |||||
| 23 | AT3G04530 | Phosphoenolpyruvate carboxylase kinase 2 | −1.6 (0.06) | −1.19 (0.43) | Protein phosphorylation |
|
| |||||
| 24 | AT5G63650 | Protein kinase 2.5 | −1.26 (0.028) | −1.01 (0.032) | Protein phosphorylation |
|
| |||||
| 25 | AT1G16260 | Cell-wall associated protein kinase family protein | 1.73 (0.006) | 2.13 (0.003) | Protein phosphorylation |
|
| |||||
| 26 | AT1G68690 | Proline-rich extension-like receptor kinase family protein | 1.04 (0.002) | 1.03 (0.04) | Protein phosphorylation |
|
| |||||
| 27 | AT5G46330 | Flagellin 2-induced receptor-like kinase | −1.85 (0.043) | −2.38 (0.016) | Defense response |
|
| |||||
| 28 | AT2G19190 | Flagellin 22-induced receptor-like kinase | 2.48 (0.065) | 2.27 (0.075) | Defense response |
|
| |||||
| 29 | AT2G15120 | Disease-resistance family protein | 2.68 (0.035) | 2.53 (0.04) | Defense response |
|
| |||||
| 30 | AT1G59780 | Disease resistance protein | 1.37 (0.092) | 1.98 (0.052) | Defense response |
|
| |||||
| 31 | AT1G63880 | Disease resistance protein | −1.81 (0.003) | −1.79 (0.016) | Defense response |
|
| |||||
| 32 | AT2G39200 | Transmembrane domain-containing protein, similar to mildew resistance protein 12 | 2.6 (0.059) | 2.55 (0.063) | Defense response |
|
| |||||
| 33 | AT1G19610 | Pathogenesis-related protein 1.4 | −2.17 (0.002) | −2.14 (0.029) | Defense response |
|
| |||||
| 34 | AT3G20600 | Nonrace specific disease resistance protein | 1.05 (0.037) | 2.12 (0.011) | Defense response |
|
| |||||
| 35 | AT1G02360 | Chitinase family protein | 2.6 (0.026) | 2.87 (0.019) | Defense response |
|
| |||||
| 36 | AT3G54420 | Chitinase family protein class IV | 1.73 (0.055) | 2.53 (0.026) | Defense response |
|
| |||||
| 37 | AT4G21390 | Serine/threonine protein kinase family protein | 1.5 (0.068) | 1.86 (0.031) | Defense response |
|
| |||||
| 38 | AT3G46280 | Protein kinase family protein | 1.83 (0.074) | 2.3 (0.048) | Defense response |
|
| |||||
| 39 | AT5G35750 | Histidine kinase 2 | −1.21 (0.042) | −1.35 (0.026) | Defense response |
|
| |||||
| 40 | AT2G37130 | Peroxidase 21 | −3.06 (0.014) | −3.4 (0.008) | Response to oxidative stress |
|
| |||||
| 41 | AT1G14540 | Peroxidase 4 | 3.35 (0.018) | 3.28 (0.02) | Response to oxidative stress |
|
| |||||
| 42 | AT5G05340 | Peroxidase 52 | 2.15 (0.014) | 2.06 (0.019) | Response to oxidative stress |
|
| |||||
| 43 | AT4G37530 | Peroxidase family protein | 2.17 (0.035) | 2.15 (0.026) | Response to oxidative stress |
|
| |||||
| 44 | AT2G41480 | Peroxidase 25 | −1.04 (0.011) | −1.06 (0.034) | Response to oxidative stress |
|
| |||||
| 45 | AT1G20620 | Catalase 3 | −1.12 (0.07) | −1.39 (0.052) | Response to oxidative stress |
|
| |||||
| 46 | AT2G29490 | Glutathione S-transferase 19 class tau 1 | 1.75 (0.07) | 1.7 (0.073) | Response to oxidative stress |
|
| |||||
| 47 | AT3G22370 | Oxidase family protein | 1.3 (0.013) | 1.0 (0.089) | Response to oxidative stress |
|
| |||||
| 48 | AT4G37220 | Stress-responsive protein | 2.87 (0.004) | 1.87 (0.049) | Response to stress |
|
| |||||
| 49 | AT4G21870 | Heat shock protein 26.5 | −1.31 (0.002) | −1.43 (0.012) | Response to stress |
|
| |||||
| 50 | AT2G38750 | Calcium-dependent phospholipid binding protein | 1.48 (0.02) | 1.15 (0.032) | Response to stress |
4. Discussion
The expression data of Arabidopsis semisolid callus cultures show alterations in differential gene expression in response to microgravity. However, the influence of the spaceflight environment, in addition to microgravity, is significant.
4.1. Identification of Altered Genes after 5 Days of Microgravity
Comparison between microgravity and 1 g space controls revealed about 298 differentially (but not significantly) expressed genes. This number is low in comparison to short-term exposures to microgravity within a range of minutes (TEXUS 47, sounding rocket experiment, [47]) or seconds (14. DLR parabolic flight campaign, [21]). This finding could be due to the small number of biological replicates (2 biological replicates only due to limited material and hardware). However, similar observations are also reported by others. After 4 days in space, Arabidopsis plants exhibited only 27 transcripts which were at least 2-fold altered at their expression level [2]. This might indicate that plants respond immediately to a microgravity environment but then adapt to the new situation on the longer run. Also Zhang et al. [32] could also identify only 45 proteins changed in expression after 14 days in space (same mission). Genes with prolonged changes in expression could, however, provide important information about the physiological needs after a few days in space. These include an upregulated group of genes which code for proteins that constitute the ribosomal complex within plastids. These are necessary for translation of mRNA. The upregulation of the mitochondrial electron transport chain could indicate an increased need for ATP. The upregulated expression of NADH dehydrogenase could have the same reason. Interestingly, gene products involved in processes like the response to stress, protein degradation, or programmed cell death appeared not to be altered in expression. The involvement of a series of genes with still unknown functions (not shown) suggests that the space environment induces also unknown cellular processes. Together with the fact that there were no significant changes in gene expression detectable after 5 days of microgravity, lets us suggest that at this stage the impact of a lack of gravitation on cell physiology was not too heavy. The space environment per se, however, causes possibly an increased energy demand, as shown by the upregulation of respiratory components. This aspect should be taken into consideration when plants will be used to provide nutrients, oxygen, and energy on long duration space missions.
Heat shock proteins (HSPs) dominate the group of transcripts which are reduced in amount (not shown). These proteins are involved in many forms of stress response. They enable the folding and membrane translocation of proteins and are thought to reconstitute the tertiary structure of proteins affected by stress events. This way they can increase the stress tolerance. A decreased expression (our study) should thus indicate a lower number of proteins affected in their structure and was also reported for Arabidopsis in vitro callus cultures under simulated microgravity conditions (magnetic levitation, magnetic field strength 10.1 Tesla) [48] as well as for the single-cell system of the fern Ceratopteris richardii [9]. There are, however, also reports on increased expression of HSPs [15, 16, 21, 24].
A group of plant genes which are always affected by altered gravity are those involved in cell wall modification [2, 49–51]. This reflects the need for increased stability (hypergravity) or more flexibility (microgravity). In the present study, expression of expansins (cell wall loosening) is increased (not shown). This might be the reason for the enhanced size of the microgravity cultures when compared to the 1 g controls (Figure 7).
4.2. Impact of the Nonmicrogravity Related Spaceflight Conditions on Gene Expression
The availability of a 1 g reference centrifuge enabled us to screen for genes affected by nonmicrogravity related spaceflight conditions in that we compared expression data between μg exposed and 1 g space with 1 g ground samples. This resulted in a considerable number of identical genes altered in mRNA abundance (573 genes) (Figure 10). We thus assume that this could be due to effects of spaceflight-related environmental conditions, including space radiation. Radiation measurements inside the capsule in a position close to our samples yielded a total dose of 5.9 to 8.1 mSV (milliSieverts) and an equivalent dose of 0.37 to 0.51 mSV/d (data: Chinese authorities). This is considerably more compared to terrestrial conditions (1 to 2 mSV/a) and could be one of the reasons for the alterations at transcript levels, obviously not related to μg. Also Zhang et al. [32] reported a greater difference on protein expression of non-μg conditions. Analysis showed that both experimental conditions (μg and non-μg spaceflight conditions) affect different biological processes (Table 1). Overrepresented processes should not be regarded separately, as they are closely linked together within a plant cell. For example, the formation of reactive oxygen species (ROS) is one of the initial responses upon most kinds of stresses. They are also produced as by-products of redox reactions. They are important second messengers, as well as toxic species, and their cellular levels are closely controlled by detoxification systems [52–54]. The role of ROS in response to environmental changes can, however, also be deduced from alterations in gene products, involved in ROS production and turnover. In this study, we observed that many ROS-related genes are significantly regulated (Table 3). These comprise peroxidases, catalase, and a glutathione S-transferase (Table 3). These proteins are suggested to be part of the stress-induced antioxidant system [55]. Glutathione S-transferases also possess peroxidase activity and can thus prevent cell damage by peroxides, such as hydrogen peroxide [56, 57]. The increase in detoxification-related transcripts appears reasonable, as radiation in orbit consists of highly energetic (HZE) particles from interplanetary galactic sources or results from solar particle events, which could have an impact on cells [58–62]. Wan et al. [63, 64] showed that X-rays, γ-rays, protons, and heavy charged particles increased oxidative stress in different cell types, and countermeasures for space radiation effects are the use of antioxidants [62]. Similar responses are probable for plant cells. Therefore, the impact of long-term space radiation on the transcriptome of Arabidopsis should be investigated in ground-based studies in simulation testbeds for the space environments [59].
In addition, a range of WRKY transcription factors and components of signaling chains (Ca2+-dependent proteins, MAP kinases) were identified (Table 3). These responsive kinases (Table 3) are potentially also modulated by cytosolic fluctuations of H2O2 and can thus be part of signal transduction chains starting from hydrogen peroxide (for defense-related genes in tomato, see Orozco-Cárdenas et al. [65]). In contrast to other observations to altered gravitation [2, 15], in this study, genes which are defense-, resistance-, and pathogen-related are significantly altered due to non-μg related spaceflight conditions.
5. Conclusions
In this study, gene expression changes within Arabidopsis wild type semisolid callus cultures were investigated after a 5-day spaceflight and compared to on-board and ground controls. Faced with limited HW capacities (only 3 EUEs) and small amounts of biological material (n = 2 for each sample group), high-density oligonucleotide arrays were used to screen for changes at the gene expression level. For future investigations, it would thus be desirable to have flight repetitions and an adequate amount of samples for additional analysis (e.g., qPCR). Unexpectedly, the response of callus cultures to long-term microgravity was less prominent compared to nonmicrogravity related spaceflight conditions. The latter, including space radiation, induced differential and significant expression changes of transcripts that are involved in the stress-induced antioxidant system, signalling chains, and defense-/resistance-related genes. These findings clearly highlight that the use of an in-flight reference centrifuge (1 g in-flight control) should be mandatory during space flight missions.
Supplementary Material
Supplementary material S1 shows the accelerometer-recorded gravity level profile (x-/y-/z-axis) as measured during the Simbox mission from EZT (Experiment Zero Time) until landing on November 17, 2011 (data: China Manned Space Engineering). Data was provided by Chinese authorities to DLR/Astrium.
Supplementary material S2 shows the formaldehyde agarose gel analysis of extracted RNA from flight (FC) and ground samples (GS), front and rear CC (Culture Chamber).
Acknowledgments
This work was supported by a grant of the Deutsches Zentrum für Luft- und Raumfahrt (DLR) (Grant no. 50WB0723) to Rüdiger Hampp. The authors are indebted to Dr. Markus Braun (DLR) for perfect campaign organization and to Achim Schwarzwälder, Dr. Astrid Horn, and the EADS Astrium team for hardware construction and technical support. They thank the China Manned Space Engineering and the Chinese scientists, especially Professor Zheng, for good cooperation at launch site. They are grateful to Margret Ecke for skilful production and maintenance of the cell cultures and Fabian Bergwitz for assistance in China, as well as Anne Hennig for ground-based experiments before the mission.
Conflict of Interests
The authors declare that there is no conflict of interests regarding the publication of this paper.
References
- 1.Perbal G., Driss-Ecole D. Mechanotransduction in gravisensing cells. Trends in Plant Science. 2003;8(10):498–504. doi: 10.1016/j.tplants.2003.09.005. [DOI] [PubMed] [Google Scholar]
- 2.Correll M. J., Pyle T. P., Millar K. D. L., et al. Transcriptome analyses of Arabidopsis thaliana seedlings grown in space: implications for gravity-responsive genes. Planta. 2013;238(3):519–533. doi: 10.1007/s00425-013-1909-x. [DOI] [PubMed] [Google Scholar]
- 3.Braun M. Gravitropism in tip-growing cells. Planta. 1997;203(1):S11–S19. doi: 10.1007/PL00008098. [DOI] [PubMed] [Google Scholar]
- 4.Braun M., Buchen B., Sievers A. Electron microscopic analysis of gravisensing Chara rhizoids developed under microgravity conditions. The FASEB Journal. 1999;13(8):S113–S120. doi: 10.1096/fasebj.13.9001.s113. [DOI] [PubMed] [Google Scholar]
- 5.Braun M. Gravity perception requires statoliths settled on specific plasma membrane areas in characean rhizoids and protonemata. Protoplasma. 2002;219(3-4):150–159. doi: 10.1007/s007090200016. [DOI] [PubMed] [Google Scholar]
- 6.Braun M., Hauslage J., Czogalla A., Limbach C. Tip-localized actin polymerization and remodeling, reflected by the localization of ADF, profilin and villin, are fundamental for gravity-sensing and polar growth in characean rhizoids. Planta. 2004;219(3):379–388. doi: 10.1007/s00425-004-1235-4. [DOI] [PubMed] [Google Scholar]
- 7.Braun M., Limbach C. Rhizoids and protonemata of characean algae: model cells for research on polarized growth and plant gravity sensing. Protoplasma. 2006;229(2–4):133–142. doi: 10.1007/s00709-006-0208-9. [DOI] [PubMed] [Google Scholar]
- 8.Salmi M. L., Bushart T. J., Roux S. J. Autonomous gravity perception and responses of single plant cells. Gravitational and Space Biology. 2011;25:6–13. [Google Scholar]
- 9.Salmi M. L., Roux S. J. Gene expression changes induced by space flight in single-cells of the fern Ceratopteris richardii . Planta. 2008;229(1):151–159. doi: 10.1007/s00425-008-0817-y. [DOI] [PubMed] [Google Scholar]
- 10.Rasmussen O., Klimchuk D. A., Kordyum E. L., et al. The effect of exposure to microgravity on the development and structural organisation of plant protoplasts flown on Biokosmos 9. Physiologia Plantarum. 1992;84(1):162–170. doi: 10.1111/j.1399-3054.1992.tb08779.x. [DOI] [PubMed] [Google Scholar]
- 11.Hoffmann E., Schönherr K., Hampp R. Regeneration of plant cell protoplasts under microgravity: investigation of protein patterns by SDS-PAGE and immunoblotting. Plant Cell Reports. 1996;15(12):914–919. doi: 10.1007/s002990050148. [DOI] [PubMed] [Google Scholar]
- 12.Hampp R., Hoffmann E., Schönherr K., Johann P., De Filippis L. Fusion and metabolism of plant cells as affected by microgravity. Planta. 1997;203:S42–S53. doi: 10.1007/PL00008114. [DOI] [PubMed] [Google Scholar]
- 13.Martzivanou M., Babbick M., Cogoli-Greuter M., Hampp R. Microgravity-related changes in gene expression after short-term exposure of Arabidopsis thaliana cell cultures. Protoplasma. 2006;229(2–4):155–162. doi: 10.1007/s00709-006-0203-1. [DOI] [PubMed] [Google Scholar]
- 14.Martzivanou M., Hampp R. Hyper-gravity effects on the Arabidopsis transcriptome. Physiologia Plantarum. 2003;118(2):221–231. doi: 10.1034/j.1399-3054.2003.00092.x. [DOI] [PubMed] [Google Scholar]
- 15.Paul A. L., Zupanska A. K., Ostrow D. T., et al. Spaceflight transcriptomes: Unique responses to a novel environment. Astrobiology. 2012;12(1):40–56. doi: 10.1089/ast.2011.0696. [DOI] [PMC free article] [PubMed] [Google Scholar]
- 16.Zupanska A. K., Denison F. C., Ferl R. J., Paul A.-L. Spaceflight engages heat shock protein and other molecular chaperone genes in tissue culture cells of Arabidopsis Thaliana . The American Journal of Botany. 2013;100(1):235–248. doi: 10.3732/ajb.1200343. [DOI] [PubMed] [Google Scholar]
- 17.Edgar R., Domrachev M., Lash A. E. Gene Expression Omnibus: NCBI gene expression and hybridization array data repository. Nucleic Acids Research. 2002;30(1):207–210. doi: 10.1093/nar/30.1.207. [DOI] [PMC free article] [PubMed] [Google Scholar]
- 18.Brazma A., Parkinson H., Sarkans U., et al. ArrayExpress—a public repository for microarray gene expression data at the EBI. Nucleic Acids Research. 2003;31(1):68–71. doi: 10.1093/nar/gkg091. [DOI] [PMC free article] [PubMed] [Google Scholar]
- 19.Kilian J., Whitehead D., Horak J., et al. The AtGenExpress global stress expression data set: protocols, evaluation and model data analysis of UV-B light, drought and cold stress responses. Plant Journal. 2007;50(2):347–363. doi: 10.1111/j.1365-313X.2007.03052.x. [DOI] [PubMed] [Google Scholar]
- 20.Swarbreck D., Wilks C., Lamesch P., et al. The Arabidopsis Information Resource (TAIR): Gene structure and function annotation. Nucleic Acids Research. 2008;36(1):D1009–D1014. doi: 10.1093/nar/gkm965. [DOI] [PMC free article] [PubMed] [Google Scholar]
- 21.Hausmann N., Fengler S., Hennig A., Franz-Wachtel M., Hampp R., Neef M. Cytosolic calcium, hydrogen peroxide and related gene expression and protein modulation in Arabidopsis thaliana cell cultures respond immediately to altered gravitation: parabolic flight data. Plant Biology. 2014;16(1):120–128. doi: 10.1111/plb.12051. [DOI] [PubMed] [Google Scholar]
- 22.Kiss J. Z., Katembe W. J., Edelmann R. E. Gravitropism and development of wild-type and starch-deficient mutants of Arabidopsis during spaceflight. Physiologia Plantarum. 1998;102(4):493–502. doi: 10.1034/j.1399-3054.1998.1020403.x. [DOI] [PubMed] [Google Scholar]
- 23.Paul A. L., Daugherty C. J., Bihn E. A., Chapman D. K., Norwood K. L. L., Ferl R. J. Transgene expression patterns indicate that spaceflight affects stress signal perception and transduction in Arabidopsis. Plant Physiology. 2001;126(2):613–621. doi: 10.1104/pp.126.2.613. [DOI] [PMC free article] [PubMed] [Google Scholar]
- 24.Paul A.-L., Popp M. P., Gurley W. B., Guy C., Norwood K. L., Ferl R. J. Arabidopsis gene expression patterns are altered during spaceflight. Advances in Space Research. 2005;36(7):1175–1181. doi: 10.1016/j.asr.2005.03.066. [DOI] [Google Scholar]
- 25.Millar K. D. L., Kumar P., Correll M. J., et al. A novel phototropic response to red light is revealed in microgravity. New Phytologist. 2010;186(3):648–656. doi: 10.1111/j.1469-8137.2010.03211.x. [DOI] [PubMed] [Google Scholar]
- 26.Allen J., Bisbee P. A., Darnell R. L., et al. Gravity control of growth form in Brassica Rapa and Arabidopsis Thaliana (Brassicaceae): consequences for secondary metabolism. American Journal of Botany. 2009;96(3):652–660. doi: 10.3732/ajb.0800261. [DOI] [PubMed] [Google Scholar]
- 27.Musgrave M. E., Kuang A., Xiao Y., et al. Gravity independence of seed-to-seed cycling in Brassica rapa . Planta. 2000;210(3):400–406. doi: 10.1007/PL00008148. [DOI] [PubMed] [Google Scholar]
- 28.Perbal G., Driss-Ecole D. Sensitivity to gravistimulus of lentil seedling roots grown in space during the IML 1 Mission of Spacelab. Physiologia Plantarum. 1994;90(2):313–318. doi: 10.1034/j.1399-3054.1994.900211.x. [DOI] [PubMed] [Google Scholar]
- 29.Tripathy B. C., Brown C. S., Levine H. G., Krikorian A. D. Growth and photosynthetic responses of wheat plants grown in space. Plant Physiology. 1996;110(3):801–806. doi: 10.1104/pp.110.3.801. [DOI] [PMC free article] [PubMed] [Google Scholar]
- 30.Stutte G. W., Monje O., Hatfield R. D., Paul A. L., Ferl R. J., Simone C. G. Microgravity effects on leaf morphology, cell structure, carbon metabolism and mRNA expression of dwarf wheat. Planta. 2006;224(5):1038–1049. doi: 10.1007/s00425-006-0290-4. [DOI] [PubMed] [Google Scholar]
- 31.Ueda J., Miyamoto K., Yuda T., et al. Growth and development, and auxin polar transport in higher plants under microgravity conditions in space: BRIC-AUX on STS-95 space experiment. Journal of Plant Research. 1999;112(1108):487–492. doi: 10.1007/PL00013904. [DOI] [PubMed] [Google Scholar]
- 32.Zhang Y., Wang L., Xie J., Zheng H. Differential protein expression profiling of Arabidopsis thaliana callus under microgravity on board the Chinese SZ-8 spacecraft. doi: 10.1007/s00425-014-2196-x. Planta. In press. [DOI] [PubMed] [Google Scholar]
- 33.Vukich M., Donati A., Zolesi V. Kayser Italia hardware for radiation and microgravity experiments in space. Rendiconti Lincei. 2014;25(1):7–11. doi: 10.1007/s12210-013-0261-1. [DOI] [Google Scholar]
- 34.Brinckmann E. Centrifuges and their application for biological experiments in space. Microgravity Science and Technology. 2012;24(6):365–372. doi: 10.1007/s12217-012-9300-2. [DOI] [Google Scholar]
- 35.Astrium GmbH. Astrium Space Transportation. Friedrichshafen, Germany: Astrium Space Biology Product Catalog; 2012. [Google Scholar]
- 36.Kleinig H. Pflanzliche Gewebekultur. Ein Praktikum. Biologie in unserer Zeit. 1986;16(4):p. 128. doi: 10.1002/biuz.19860160413. [DOI] [Google Scholar]
- 37.Fengler S., Neef M., Ecke M., Hampp R. The Simbox experiment with Arabidopsis thaliana cell cultures: hardware tests and first results from the German-Chinese satellite mission Shenzhou 8. Proceedings of the Life in Space for Life on Earth Symposium; 2013. [Google Scholar]
- 38.Rustici G., Kolesnikov N., Brandizi M., et al. ArrayExpress update-trends in database growth and links to data analysis tools. Nucleic Acids Research. 2013;41(1):D987–D990. doi: 10.1093/nar/gks1174. [DOI] [PMC free article] [PubMed] [Google Scholar]
- 39.Battke F., Symons S., Nieselt K. Mayday—integrative analytics for expression data. BMC Bioinformatics. 2010;11, article 121 doi: 10.1186/1471-2105-11-121. [DOI] [PMC free article] [PubMed] [Google Scholar]
- 40.Irizarry R. A., Bolstad B. M., Collin F., Cope L. M., Hobbs B., Speed T. P. Summaries of Affymetrix GeneChip probe level data. Nucleic Acids Research. 2003;31(4) doi: 10.1093/nar/gng015. [DOI] [PMC free article] [PubMed] [Google Scholar]
- 41.Irizarry R. A., Hobbs B., Collin F., et al. Exploration, normalization, and summaries of high density oligonucleotide array probe level data. Biostatistics. 2003;4(2):249–264. doi: 10.1093/biostatistics/4.2.249. [DOI] [PubMed] [Google Scholar]
- 42.Bolstad B. M., Irizarry R. A., Åstrand M., Speed T. P. A comparison of normalization methods for high density oligonucleotide array data based on variance and bias. Bioinformatics. 2003;19(2):185–193. doi: 10.1093/bioinformatics/19.2.185. [DOI] [PubMed] [Google Scholar]
- 43.Simonsen M., Mailund T., Pedersen C. N. Algorithms in Bioinformatics. Vol. 5251. Berlin, Germany: Springer; 2008. Rapid neighbour-joining; pp. 113–122. (Lecture Notes in Computer Science). [Google Scholar]
- 44.Mutch D. M., Berger A., Mansourian R., Rytz A., Roberts M.-A. The limit fold change model: a practical approach for selecting differentially expressed genes from microarray data. BMC Bioinformatics. 2002;3, article 17 doi: 10.1186/1471-2105-3-17. [DOI] [PMC free article] [PubMed] [Google Scholar]
- 45.Subramanian A., Tamayo P., Mootha V. K., et al. Gene set enrichment analysis: a knowledge-based approach for interpreting genome-wide expression profiles. Proceedings of the National Academy of Sciences of the United States of America. 2005;102(43):15545–15550. doi: 10.1073/pnas.0506580102. [DOI] [PMC free article] [PubMed] [Google Scholar]
- 46.Ashburner M., Ball C. A., Blake J. A., et al. Gene ontology: tool for the unification of biology. Nature Genetics. 2000;25(1):25–29. doi: 10.1038/75556. [DOI] [PMC free article] [PubMed] [Google Scholar]
- 47.Babbick M., Barjaktarović Ž., Hampp R. Alterations in the expression of transcription factors in Arabidopsis thaliana cell cultures during sounding rocket μG. Proceedings of the 18th ESA Symposium on European Rocket and Balloon Programmes; June 2007; pp. 473–477. [Google Scholar]
- 48.Manzano A. I., van Loon J. J. W. A., Christianen P. C. M., Gonzalez-Rubio J. M., Medina F. J., Herranz R. Gravitational and magnetic field variations synergize to cause subtle variations in the global transcriptional state of Arabidopsis in vitro callus cultures. BMC Genomics. 2012;13(1, article 105) doi: 10.1186/1471-2164-13-105. [DOI] [PMC free article] [PubMed] [Google Scholar]
- 49.Wang H., Hui Q. Z., Sha W., Zeng R., Qi C. X. A proteomic approach to analysing responses of Arabidopsis thaliana callus cells to clinostat rotation. Journal of Experimental Botany. 2006;57(4):827–835. doi: 10.1093/jxb/erj066. [DOI] [PubMed] [Google Scholar]
- 50.Hoson T., Soga K., Mori R., et al. Stimulation of elongation growth and cell wall loosening in rice coleoptiles under microgravity conditions in space. Plant and Cell Physiology. 2002;43(9):1067–1071. doi: 10.1093/pcp/pcf126. [DOI] [PubMed] [Google Scholar]
- 51.Nasir A., Strauch S. M., Becker I., et al. The influence of microgravity on Euglena gracilis as studied on Shenzhou 8. Plant Biology. 2014;16(supplement 1):113–119. doi: 10.1111/plb.12067. [DOI] [PubMed] [Google Scholar]
- 52.Apel K., Hirt H. Reactive oxygen species: metabolism, oxidative stress, and signal transduction. Annual Review of Plant Biology. 2004;55:373–399. doi: 10.1146/annurev.arplant.55.031903.141701. [DOI] [PubMed] [Google Scholar]
- 53.Davletova S., Schlauch K., Coutu J., Mittler R. The zinc-finger protein Zat12 plays a central role in reactive oxygen and abiotic stress signaling in Arabidopsis. Plant Physiology. 2005;139(2):847–856. doi: 10.1104/pp.105.068254. [DOI] [PMC free article] [PubMed] [Google Scholar]
- 54.Mittler R. Abiotic stress, the field environment and stress combination. Trends in Plant Science. 2006;11(1):15–19. doi: 10.1016/j.tplants.2005.11.002. [DOI] [PubMed] [Google Scholar]
- 55.Sappl P. G., Carroll A. J., Clifton R., et al. The Arabidopsis glutathione transferase gene family displays complex stress regulation and co-silencing multiple genes results in altered metabolic sensitivity to oxidative stress. The Plant Journal. 2009;58(1):53–68. doi: 10.1111/j.1365-313X.2008.03761.x. [DOI] [PubMed] [Google Scholar]
- 56.Roxas V. P., Smith R. K., Jr., Allen E. R., Allen R. D. Overexpression of glutathione S-transferase/glutathione peroxidase enhances the growth of transgenic tobacco seedlings during stress. Nature Biotechnology. 1997;15(10):988–991. doi: 10.1038/nbt1097-988. [DOI] [PubMed] [Google Scholar]
- 57.Roxas V. P., Lodhi S. A., Garrett D. K., Mahan J. R., Allen R. D. Stress tolerance in transgenic tobacco seedlings that overexpress glutathione S-transferase/glutathione peroxidase. Plant and Cell Physiology. 2000;41(11):1229–1234. doi: 10.1093/pcp/pcd051. [DOI] [PubMed] [Google Scholar]
- 58.Horneck G. Radiobiological experiments in space: a review. Nuclear Tracks and Radiation Measurements. 1992;20(1):185–205. doi: 10.1016/1359-0189(92)90099-H. [DOI] [Google Scholar]
- 59.Horneck G. Laboratory Astrophysics and Space Research. 1999. Astrobiology studies of microbes in simulated interplanetary space; pp. 667–685. [Google Scholar]
- 60.Baumstark-Khan C., Hellweg C. E., Arenz A., Meier M. M. Cellular monitoring of the nuclear factor κB pathway for assessment of space environmental radiation. Radiation Research. 2005;164(4):527–530. doi: 10.1667/RR3397.1. [DOI] [PubMed] [Google Scholar]
- 61.Hellweg C. E., Baumstark-Khan C. Getting ready for the manned mission to Mars: the astronauts' risk from space radiation. Naturwissenschaften. 2007;94(7):517–526. doi: 10.1007/s00114-006-0204-0. [DOI] [PubMed] [Google Scholar]
- 62.Kennedy A. R. Biological effects of space radiation and development of effective countermeasures. Life Sciences in Space Research. 2014;1(1):10–43. doi: 10.1016/j.lssr.2014.02.004. [DOI] [PMC free article] [PubMed] [Google Scholar]
- 63.Wan X. S., Zhou Z., Kennedy A. R. Adaptation of the dichlorofluorescein assay for detection of radiation-induced oxidative stress in cultured cells. Radiation Research. 2003;160(6):622–630. doi: 10.1667/3099. [DOI] [PubMed] [Google Scholar]
- 64.Wan X. S., Zhou Z., Ware J. H., Kennedy A. R. Standardization of a fluorometric assay for measuring oxidative stress in irradiated cells. Radiation Research. 2005;163(2):232–240. doi: 10.1667/RR3299. [DOI] [PubMed] [Google Scholar]
- 65.Orozco-Cárdenas M. L., Narváez-Vásquez J., Ryan C. A. Hydrogen peroxide acts as a second messenger for the induction of defense genes in tomato plants in response to wounding, systemin, and methyl jasmonate. The Plant Cell. 2001;13(1):179–191. doi: 10.1105/tpc.13.1.179. [DOI] [PMC free article] [PubMed] [Google Scholar]
Associated Data
This section collects any data citations, data availability statements, or supplementary materials included in this article.
Supplementary Materials
Supplementary material S1 shows the accelerometer-recorded gravity level profile (x-/y-/z-axis) as measured during the Simbox mission from EZT (Experiment Zero Time) until landing on November 17, 2011 (data: China Manned Space Engineering). Data was provided by Chinese authorities to DLR/Astrium.
Supplementary material S2 shows the formaldehyde agarose gel analysis of extracted RNA from flight (FC) and ground samples (GS), front and rear CC (Culture Chamber).


