

Abstract
Objective
Knee osteoarthritis (OA) remains a leading cause of disability and joint pain. Though other risk factors of knee OA have been identified, how physical activity affects incident knee OA remains unclear.
Methods
Using data from the Johnston County Osteoarthritis Project study’s first (1999–2004) and second follow-up (2005–2010), we tested the association between meeting physical activity guidelines and incident knee outcomes among 1522 adults aged ≥ 45 years. The median (range) follow-up time was 6.5 (4.0–10.2) years. Physical activity at baseline (moderate-equivalent min/week) was calculated using the Minnesota Leisure Time Physical Activity questionnaire. Incident knee radiographic OA (ROA) was defined as the development of a Kellgren-Lawrence grade of ≥ 2 in a knee at follow-up. Incident knee symptomatic ROA (sROA) was defined as the development of ROA and symptoms in at least one knee at follow-up. Weibull regression modeling was used to estimate hazard ratios (HR) and 95% confidence intervals (CI) for interval censored data.
Results
In multivariable models, meeting the 2008 HHS physical activity guidelines (≥150 min/week) was not significantly associated with ROA (HR: 1.20; 95% CI=0.94, 1.56) or sROA (HR: 1.24; 95% CI=0.87, 1.76). Adults in the highest (≥300 min/week) level of physical activity had a higher risk of knee ROA and sROA compared with inactive (0-<10 min/week) participants; however these associations were not statistically significant (HR: 1.62; 95% CI=0.97, 2.68 and HR: 1.42; 95% CI=0.76, 2.65, respectively).
Conclusion
Meeting HHS physical activity guidelines was not associated with incident knee ROA or sROA in a cohort of middle-aged and older adults.
Keywords: physical activity, radiographic and symptomatic knee osteoarthritis, incidence, Weibull regression modeling, interval censoring
Introduction
Knee osteoarthritis (OA) affects an estimated 19–27% of adults ages 45 and older (1) and remains a leading cause of disability and pain (2). Some of the major consequences of knee OA are immobility, requirement for knee arthroplasty, high health care costs, and poor quality of life(2). Annually, knee pain is reported in almost half of adults aged 50 years; an estimated 23% report severe and disabling knee pain (3).
Obesity, older age, history of knee injury, and female sex are risk factors that have been associated with the development of knee OA (4). The role that physical activity might play has been considered, but the association between physical activity and incident knee OA appears complex and is not well understood. Experimentally, animal studies show that weight-bearing exercise activities may prevent OA development (5, 6). Observationally, several longitudinal studies in humans have evaluated these associations with conflicting results (7–13). While some research indicates that physical activity is protective(11) or has no impact(9, 12) on knee OA development, other studies suggest that torsional loading and high impact activities are risk factors for knee OA(7, 8, 10, 13). Moderate volumes of low impact activities (i.e., walking) may be protective for OA, because joint loading and movement is necessary for optimal bone and joint health (14). Furthermore, dynamic compression can stimulate chondrocyte biosynthesis and augment the cartilage matrix, which suggests that regular physical activity could a be protective factor for development of knee OA(15). Adding to the enigma, physical activity is recommended as a first line non-pharmacological intervention for OA patients as it has been proven to decrease pain, improve function and mood, and to delay disability(16).
Prior longitudinal studies(7–13) have been limited by study populations from convenience samples with restricted generalizability, crudely measured physical activity variables which fail to capture a broad range of activities, inadequate adjustment for potential confounders, and methods that do not account for uncertainty in onset of disease (i.e., interval censoring) during the long observation intervals typically found in such studies. The majority of these studies have also used predominately Caucasian samples. Comparing these findings presents several challenges, including different definitions of physical activity and OA, disparate populations, and varying follow-up times.
The purpose of our study is to examine the association between meeting Department of Health and Human Services (HHS) physical activity guidelines and incident knee OA among middle-aged and older community-dwelling adults using methods that address some of the limitations identified in previous studies.
Methods
Study Population
We analyzed data from the Johnston County Osteoarthritis (JoCo OA) Project, an ongoing population-based prospective cohort study of knee and hip osteoarthritis in Johnston County, North Carolina. The survey methods are described in detail elsewhere (17). In brief, the JoCo OA project at T0 (1991–1997) enrolled 3068 community-dwelling, non-institutionalized, white and black residents, ages ≥ 45 years, who were physically and mentally capable of completing the study’s protocol and had resided in one of 6 townships in Johnston County for at least 1 year. At the 1999–2004 baseline for our analyses, there were 2,573 participants who completed both clinic visit and home interview, including 1590 from the first follow-up of this original cohort (T1:1999–2003) and 983 from a newly enrolled cohort recruited to replace losses and enrich the cohort for black participants (T1*:2003–2004). Of these 2,573 participants, 1,528 completed both a clinic visit and home interview during the subsequent follow-up visit (T2: 2005–2010) (Figure 1). The median (range) follow-up time (from T1/T1* to T2) of participants was 6.5 (4.0–10.2) years. This study was approved by the Institutional Review Boards of the University of North Carolina Schools of Medicine and Public Health and the Centers for Disease Control and Prevention. All participants gave written informed consent at the time of recruitment.
Figure 1.

Flow chart for Johnston County Project participants from study baseline (T1 and T1* visits) to follow-up (T2)
Physical Activity Variables
We measured physical activity at our study baseline using the Minnesota Leisure Time Physical Activity (MLTPA) questionnaire, which collects self-reported information on physical activity during the previous year(18). A previous comprehensive evaluation of the MLTPA concluded that the validity (direct validation measures, 0.21 ≤ r ≤ 0.75) and reliability (one month test-retest, r=0.92 and one year test-rest, r=0.69) of this instrument was reasonably good(19). The MLTPA consists of 65 activities partitioned into 10 categories. We used the frequency and duration of 62 activities classified as moderate or vigorous activities (metabolic equivalents or METs ≥ 3) to estimate the average minutes of moderate-equivalent physical activity per week (1 minute of vigorous aerobic activity=2 minutes of moderate aerobic activity). We excluded 6 participants with extreme outlying values for physical activity (based on statistical criteria of >3 standard deviations from the mean, i.e., 6,063.8 min/wk or 14.4 hrs/day), leaving a final analytic sample of 1,522 participants.
We classified physical activity in two ways. The first defined physical activity as meeting or not meeting the HHS physical activity guidelines of ≥ 150 minutes of moderate-equivalent physical activity per week(16). The second defined physical activity using the 4 health benefit levels from the 2008 HHS Physical Activity Guidelines for Americans: inactive=no benefits (0–<10 min/week), low=some benefits (10–<150 min/week), medium=substantial benefits (150–<300 min/week) and high=additional benefits (≥300 min/week)(16).
Radiographic Knee Osteoarthritis Outcomes
Posterior-anterior paired reads of knee radiographs were performed at baseline and follow-up by a single bone and joint radiologist using the conventional Kellgren/Lawrence (K/L) scale(20). Previous interrater and intrarater reliability were high (weighted kappa=0.86 and 0.89, respectively) (21).
Incident knee radiographic OA (ROA) was defined as a K/L grade ≥ 2 or knee replacement at follow-up in a knee with a K/L grade <2 at baseline. Participants with a baseline K/L grade of ≥ 2, knee replacement, missing radiographic data, or a non-OA diagnosis (i.e., x-ray evidence of inflammatory arthritis, for instance, rheumatoid arthritis) in either knee were excluded.
Incident symptomatic knee ROA (sROA) was defined as a knee with ROA and symptoms at follow-up among participants without both ROA and symptoms in that specific knee at baseline. Knee symptoms were defined as a “yes” answer to the survey question “On most days, do you have pain, aching or stiffness, in your knee?” asked separately for left and right knees. Because participants with ROA without symptoms, symptoms without ROA, or neither ROA nor symptoms in a knee at baseline were included, we refer to this outcome as incident knee sROA (less restrictive definition). We performed a secondary analysis of incident knee sROA restricted to those with neither ROA nor symptoms in a knee at baseline (restrictive definition).
We also analyzed joint space narrowing (JSN, graded on a scale of 0–3) as an outcome in our analysis, We defined incident knee JSN as at least a 1-grade increase on either the medial or lateral compartment of the tibiofemoral joint from baseline to follow-up. The JSN analysis was limited to participants with K/L grade of <2 in both knees at baseline.
Potential Confounders
Potential confounders examined at study baseline were self-reported age, sex, race, education (no college vs. attended college), and history of knee injury. Body mass index (BMI) was calculated from measured weight and height using the formula weight (kg)/height2 (m2) and was treated as a continuous variable. Because MLTPA does not include occupational activity we calculated a composite self-reported occupational activity variable (0–9), which estimates the total number of tasks from 9 occupational activities (light work standing, sitting, heavy work standing, kneeling, walking, hand motion, lifting 10 kg, lifting 20 kg, or lifting 50 kg) performed at least 50% of the time for a particular job.
Statistical Analysis
The unit of analysis was the person, so an incident outcome needed to occur in only one knee to be considered an event for that person. To assess attrition bias, we compared those who did or did not complete follow-up using chi-square and two-sample t-tests for baseline characteristics. Similarly, characteristics by physical activity level, and incident ROA status were examined using the same statistical inference tests.
Interval-censored data are common in longitudinal time-to-event studies and reflect uncertainty as to the exact time that an event (failure) occurred in a known interval of time. The use of semi-parametric Cox regression is problematic for interval-censored data, due to its dependence on ordering of event times. Weibull parametric regression can accommodate variable follow-up times and interval-censored data, so we used this procedure to estimate hazard ratios (HRs) with 95% confidence intervals (CIs)(22). All multivariate analyses were adjusted for age, sex, race, BMI, education, occupational activity, and prior knee injury. We also evaluated the potential for interactions between physical activity and the following variables: BMI, sex, and race. However, the interaction terms were not significant (p>0.05 for all models), so stratified analyses were not performed. Because the association between physical activity and knee sROA differed by restrictive/less restrictive definition used, sensitivity analyses were performed to better understand what factors might be influencing these discordant findings (appendix).
The complex sample design of the JoCo Project was fully accommodated in our analyses. Specifically, population-calibrated sampling weights were applied in all analyses to account for oversampling of blacks and differential rates of non-response, thereby enabling our estimates to be more representative of the target population. Furthermore, to correct for sampling without replacement, and reduce sampling error, a finite population correction (FPC) was computed in conjunction with the Jackknife resampling method that was used to account for intra-cluster correlation (i.e., correlation between participants residing within the same street) in estimating standard errors. The significance level was set at p<0.05 for two tailed tests. All analyses were performed through the use of Stata 12.0 software (Stata Corp., College Station, TX, USA). The Stata module INTCENS was used to perform the interval censored survival analysis(23).
Results
Table 1 shows baseline characteristics of the 1,528 participants who completed follow-up and the 1,045 who were lost to follow-up. Compared with completers, the participants who were lost to follow up were older, more often men, of black race, had not attended college, of lower BMI, of higher occupational activity, less likely to meet physical activity guidelines, more often physically inactive, and had a higher prevalence of knee ROA.
Table 1.
Baseline (1999–2004) characteristics of 2573 JoCo OA Project participants, by follow-up status¶
| Completed follow-up | |||
|---|---|---|---|
| Baseline characteristics | Yes N=1528 (59.4%) Mean (SE), % |
No N=1045 (40.6%) Mean (SE), % |
P-value |
| Age (years), mean (SE) | 59.8 (0.3) | 63.6 (0.5) | <0.01 |
| Men | 40.0 | 45.1 | <0.01 |
| Blacks | 20.5 | 26.9 | <0.01 |
| Attended college | 33.9 | 22.8 | <0.01 |
| BMI (kg/m2), mean (SE) | 30.8 (0.2) | 30.3 (0.2) | 0.045 |
| History of knee injury | 21.5 | 26.9 | <0.01 |
| Occupational activity (0–9)**, mean (SE) | 2.21 (0.05) | 2.53 (0.07) | <0.01 |
| Meets HHS physical activity guidelines† | 55.9 | 50.7 | <0.01 |
| HHS physical activity health benefits level‡ | <0.01 | ||
| Inactive (<10 min/week) | 10.6 | 17.2 | |
| Low (10–<150 min/week) | 34.0 | 32.6 | |
| Medium (150–<300 min/week) | 21.8 | 19.4 | |
| High (≥300 min/week) | 33.6 | 30.8 | |
| Prevalent knee ROA, | 27.2 | 35.3 | <0.01 |
| Prevalent knee sROA | 14.5 | 15.9 | 0.27 |
Moderate-equivalent physical activity for ≥ 150 minutes/week; excluded outliers with >3 standard deviations from the mean (6,063.8 min/wk)
Moderate-equivalent minutes of physical activity: inactive= no health benefits, low=some health benefits, medium= substantial health benefits, high= additional health benefits; excluded outliers with >3 standard deviations from the mean (6,063.8 min/wk)
BMI=body mass index, SE= standard error, ROA=radiographic osteoarthritis, sROA=symptomatic radiographic osteoarthritis
Weighted analysis; all means and percentages reported are based on weighted estimates
P-values are based on chi-square and two-sample t-tests
Composite measure of occupational activity (0–9) which estimates the total number of tasks from 9 occupational activities performed at least 50% of the time for a particular job.
Figure 2 shows the distribution of all leisure time physical activity (min/week) by the 10 MLTPA categories. Walking, conditioning exercises, and lawn and garden activities were the most reported types of physical activity comprising 62.8% of all activities.
Figure 2.
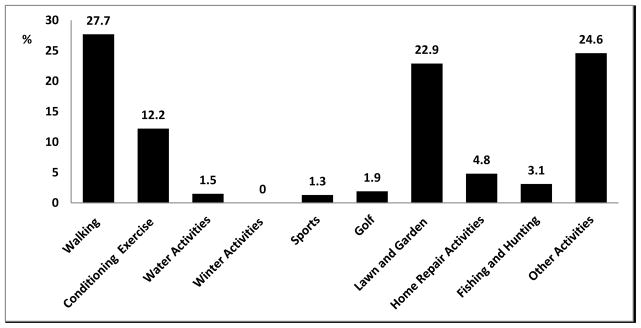
Percent distribution of physical activity (min/week) by MLTPA categories
The majority (55.9%) of participants met physical activity guidelines, with significantly higher proportions observed among whites, those attending college, and those with a lower BMI (Table 2). Participants who met physical activity guidelines had higher occupational activity, however this association was not statistically significant (p=0.06). Physical activity status did not differ significantly by age, sex, or history of knee injury.
Table 2.
Distribution of physical activity level and incident knee ROA status¶ of study participants, by baseline (1999–2004) characteristics
| Met physical activity guidelines† N=1522 |
P-value | Incident knee ROA N=993 |
P-value | |||
|---|---|---|---|---|---|---|
|
| ||||||
| Baseline characteristics | No (N=684) | Yes (N=838) | No (N=742) | Yes (N=251) | ||
| Overall, % | 44.1 | 55.9 | 74.7 | 25.3 | ||
| Age (years), mean (SE) | 59.9 (0.5) | 59.6 (0.4) | 0.62 | 58.2 (0.4) | 61.8 (0.6) | <0.01 |
| Sex, % | 0.31 | 0.04 | ||||
| Women | 45.1 | 54.9 | 80.1 | 19.9 | ||
| Men | 42.1 | 57.9 | 74.6 | 25.4 | ||
| Race, % | <0.01 | 0.52 | ||||
| Whites | 41.2 | 58.8 | 77.4 | 21.6 | ||
| Blacks | 55.5 | 45.5 | 76.4 | 23.6 | ||
| Attended college, % | <0.01 | 0.17 | ||||
| No | 48.9 | 51.1 | 76.6 | 23.4 | ||
| Yes | 34.2 | 65.8 | 80.3 | 19.7 | ||
| BMI (kg/m2) | 31.8 (0.3) | 30.0 (0.2) | <0.01 | 29.3 (0.3) | 30.8 (0.3) | <0.01 |
| Occupational activity**, % | 2.30 (0.07) | 2.13 (0.07) | 0.06 | 2.21 (0.07) | 2.20 (0.08) | 0.95 |
| History of knee injury, % | 0.70 | 0.79 | ||||
| No | 44.2 | 55.8 | 77.8 | 22.2 | ||
| Yes | 42.8 | 57.2 | 88.6 | 21.4 | ||
P-values are based on chi-square and two-sample t-tests
Moderate-vigorous physical activity for ≥ 150 minutes/week
BMI=body mass index, SE= standard error, ROA=radiographic osteoarthritis
Weighted analysis; all means and percentages reported are based on weighted estimates
Composite measure of occupational activity (0–9) which estimates the total number of tasks from 9 occupational activities performed at least 50% of the time for a particular job.
Of the 993 participants without ROA at baseline, 251 had incident knee ROA at follow-up. Incident ROA was significantly higher among older adults, men, and those with a higher BMI were, but did not differ significantly by race, education, occupational activity, or history of knee injury (Table 2).
Multivariate Analysis
Table 3 shows the adjusted association between physical activity variables and incident knee ROA, incident knee sROA, and incident knee JSN. Meeting recommended physical activity levels (≥ 150 min/week) was not associated with incident ROA (HR: 1.20; 95% CI: 0.92, 1.56) or incident sROA (less restrictive definition) (HR: 1.24; 95% CI: 0.87, 1.76), but there was a borderline significant association (HR: 2.20; 95% CI: 0.99, 4.90) (data not shown) with incident sROA (restrictive definition). The sensitivity analysis (appendix) was limited by relatively low statistical power, but suggested that the association between physical activity and sROA (restrictive compared with the less restrictive definition) was potentially modified by sex, knee injury, and having a combination of both knee injury and being obese/overweight.
Table 3.
Adjusted hazard ratios for the effects of meeting HHS physical activity guidelines and HHS physical activity health benefits levels on the risk of incident knee ROA, sROA, and JSN¶
| Incident knee ROA HR (95% CI) N=981** |
Incident knee sROA* (Less restrictive definition) HR (95% CI) N=1114** |
JSN HR (95% CI) N=981** |
|
|---|---|---|---|
| Meets HHS physical activity guidelines† | |||
| No | 1.0 | 1.0 | 1.0 |
| Yes (≥150 minutes/week) | 1.20 (0.92, 1.56) | 1.24 (0.87, 1.76) | 1.42 (1.10, 1.82) |
| HHS physical activity health benefits level‡ | |||
| Inactive (<10 min/week) | 1.0 | 1.0 | 1.0 |
| Low (10–<150 min/week) | 1.25 (0.75, 2.10) | 1.07 (0.56, 2.05) | 1.22 (0.73, 2.04) |
| Medium (150–<300 min/week) | 1.14 (0.67, 1.97) | 1.16 (0.60, 2.25) | 1.22 (0.72, 2.07) |
| High (≥300 min/week) | 1.62 (0.97, 2.68) | 1.42 (0.76, 2.65) | 1.97 (1.20, 3.26) |
Weibull parametric hazards weighted regression adjusted for age, sex, race, BMI, education, occupational activity, and prior knee injury
Moderate-equivalent minutes of physical activity for ≥ 150 minutes/week
Moderate-equivalent minutes of physical activity: inactive= no benefits (<10 min/week), low=some benefits (10–<150 min/week), medium= substantial benefits (150–<300 min/week), high= additional benefits (≥300 min/week)
Participants with one or neither condition (ROA and symptoms) in a knee at baseline were included
Number of observations in multivariate analysis.
Participants in the highest level (300 min/week) of physical activity had a higher risk of incident ROA and incident sROA when compared with those who were inactive, however these associations were non-significant (HR: 1.62; 95% CI=0.97, 2.68 and HR: 1.42; 95% CI: 0.76, 2.65, respectively) (Table 3).
Both meeting physical activity guidelines and the highest level of physical activity were significantly associated with incident JSN (HR: 1.42; 95% CI: 1.10, 1.82 and HR: 1.97; 95% CI=1.20, 3.26, respectively) (Table 3).
Discussion
In our prospective cohort study, meeting physical activity guidelines was not associated with an incident knee ROA or sROA over 6.5 years among community-dwelling middle-aged and older adults. When analyzed by level of physical activity, high levels (300 min/week) were suggestive of an increased risk of knee ROA and sROA, although these differences were not statistically significant. Additionally, meeting physical activity guidelines and high levels of physical activity were associated with an increased risk of knee JSN.
For knee ROA, comparing studies with similar aims and objectives is difficult because of disparate and crude measurements of physical activity. No other studies used “meeting HHS guidelines” as a measure. Instead, they compared levels of physical activity. Two fairly recent studies (9, 12) found that physical activity neither protects nor increases the risk of knee ROA. The Framingham study (9) used crude measures of physical activity (i.e., walking and sweating), while the HUNT study (12) estimated self-report of physical activity per week, but did not ask about individual activities. Other studies (7, 8, 10) have found that high levels of physical activity are associated with an increased risk of knee ROA. Cooper et al found that participants engaging in weekly sports participation for 10 years or more had more than 3-fold risk of knee ROA development compared to others(7), although this finding was only significant when knee OA was defined using a K/L grade threshold of 1, rather than the conventional K/L grade of 2. Felson et al found that physical activity significantly increased the risk of knee ROA by 3.3 times for those in the highest quartile compared with the lowest quartile(8). This study used the Framingham Physical Activity Index(24) which assigns a level of activity (i.e., slight, moderate, heavy) to different items and derives a weighted sum of activity over 24 hours. Despite including many activities the Framingham Physical Activity Index does not estimate physical activity over a year or account for seasonality of certain activities, which the MLTPA does. McAlindon et al. used the same Framingham Physical Activity Index and similarly found that the highest risk of knee ROA was among participants in the highest physical activity categories(10). What appears to be consistent from the studies above is that comprehensive measures of physical activity (which account for many individual activities) are more likely to show an increased risk of ROA at high levels of activity, compared with crude measures of physical activity.
Knee sROA has major public health and clinical implications, but few studies have attempted to address this outcome (9, 10). McAlindon et al. found that higher physical activity was a risk factor for knee sROA (using the same restrictive definition)(10). Conversely, a more recent Framingham study found no link between recreational physical activity and knee sROA (using the same less restrictive definition)(9). We classified sROA using two different definitions as indicated above. In our primary analysis, meeting the HHS physical activity guidelines did not significantly increase the risk of knee sROA (less restrictive definition), whereas in our secondary analysis, meeting physical activity guidelines was borderline associated with an increased risk of sROA (restrictive definition). The sudden onset of both symptoms and ROA suggests greater exposure to a major risk factor for the outcome. Perhaps, the concordant findings regarding higher physical activity and increased risk of sROA (restrictive definition) may be explained by an interaction between physical activity and risk factors such as history of an injury, or overweight/obesity (shown in our sensitivity analysis).
JSN, often a surrogate for cartilage loss (25) although there may be other causes, was significantly associated with both meeting physical activity guidelines (≥150 min/week) and high levels (≥300 min/week) of physical activity in our analysis. Using cruder measures of physical activity the Framingham Cohort found a null association of physical activity with JSN(9) while Hart et al. found that walking significantly decreased the odds of JSN(11). The disparate measures of physical activity may explain these discrepant findings. Additional studies are needed to sort out these differences.
This study has several strengths. First, we used a population-based study that is generalizable to a community population rather than a convenience sample. Second, we used a comprehensive physical activity measure that captures a broad range of leisure time activities and accounts for seasonality of some activities (i.e., shoveling snow or mowing a lawn). Third, we controlled for a variety of well-known confounders (i.e., age, sex, race, BMI, education, and knee injury) and for another measure of physical activity (i.e., occupational activity) to allow an assessment of the independent effect of leisure time physical activity. Finally, we addressed interval censoring by using the Weibull distribution rather than using cumulative incidence, which does not account for time in the analysis, or taking the midpoint time at follow-up, which can produce widely varying hazard ratios when time intervals vary greatly(26). The Weibull distribution also has the following advantages: (1) it allows for increasing, decreasing, and constant hazard rates as opposed to the exponential distribution, and (2) Weibull parameter estimates are based on the maximum likelihood estimates and not partial likelihood estimates produced by the semi-parametric Cox proportional hazards model which contain an unspecified baseline hazard function(27).
There were also some limitations in this study. First, we measured leisure time physical activity at baseline only, as a result, physical activity levels that are most important to knee OA etiology may have occurred different time points (i.e., prior to baseline or follow-up). Physical activity is dynamic and may change individually over time, although a study from the Netherlands among older adults showed that walking time (which comprised a large portion of physical activity in our study) was stable over a period of 10 years (28). Second, physical activity was self-reported, and therefore, subject to misclassification of the physical activity levels. Over-reporting of physical activity may have occurred due to social desirability or recall bias; nonetheless, a recent CDC report(29) showed that for the US population, about 52% met the HHS aerobic guidelines, which compares well with our findings. Additionally, to our knowledge, there is no prior evidence to suggest that physical activity misclassification would be differential by OA status, or even demographic variables (30), and if anything, our results would likely be biased to the null. Third, attrition bias may have occurred because those who did not complete the follow-up differed in some characteristics from those who completed the study. Differential loss to follow-up would have occurred if the association between physical activity and ROA among participants lost to follow-up differed from association among participants not lost to follow-up, but we do not have ROA status at follow-up for the missing adults, so the direction of bias, if any, cannot be determined. Fourth, follow-up was for only a median of 6.5 years. Continuing follow-up on this cohort will extend the observation time. Fifth, it would have been worthwhile to explore the effect of more vigorous activities (i.e., running and swimming) individually on knee OA, but these activities were performed at low frequency and duration in our cohort. Sixth, because our study uses only two time points we were unable to estimate the mediating effect of weight change on onset of knee OA outcomes. For instance, higher physical activity may lead to lower weight gain, which in turn reduces the risk of OA. Finally, there were only 42 participants that developed sROA when applying the restrictive definition. Consequently, the secondary analysis was limited to the association between meeting physical activity guidelines and sROA, because of limited statistical power.
In summary, meeting HHS leisure time physical activity guidelines was not associated with a significantly increased risk of incident knee ROA or sROA in a cohort of middle-aged and older community-dwelling adults over a median follow-up of 6.5 years. These findings and reports in the literature suggest that engaging in moderate levels of physical activity does not increase the risk of knee OA, and that activities such as walking, conditioning exercises, and household activities can continue to be encouraged in the population. On the other hand, we and others find an elevated risk of knee OA outcomes (including increased JSN) among persons in highest level of physical activity, so high levels of physical activity may have negative implications for knee OA outcomes.
Significance and Innovation.
These findings support recommendations to engage in moderate levels of physical activity, as this does not increase the risk of knee osteoarthritis (OA), and that activities such as walking, conditioning exercises, and household activities can continue to be encouraged in the population.
Importantly, however, we also corroborated evidence of an elevated risk of negative knee OA outcomes (including increased joint space narrowing (JSN)) among persons in highest level of physical activity, so high levels of physical activity may have negative implications for knee OA outcomes.
Acknowledgments
Financial Support
The Johnston County Osteoarthritis Project is supported in part by cooperative agreements S043, S1734, and S3486 from the Centers for Disease Control (CDC) and Prevention/Association of Schools of Public Health; the NIAMS Multipurpose Arthritis and Musculoskeletal Disease Center grant 5-P60-AR30701; and the NIAMS Multidisciplinary Clinical Research Center grant 5 P60 AR49465-03.
We would like to acknowledge researchers Yiling Cheng, Barbara Do, and Yvonne Golightly for their feedback which has helped improved the quality of this manuscript.
Appendix
Sensitivity analysis
The association between physical activity and knee sROA differed by knee sROA definition: with the less restrictive definition, there was no association between meeting physical activity recommendations and the risk of sROA (HR: 1.24; 95% CI=0.87, 1.76) whereas with the restrictive definition, the association was borderline significant (HR: 2.20; 95% CI: 0.99, 4.90). We conducted additional analyses to understand this difference.
First, to determine whether the difference in HRs was potentially attributable to differences in the characteristics of these two samples, we compared the characteristics of the respondents in populations defined with each of the criteria (Appendix Table 1). A higher proportion of those in the restrictive definition population were younger (age 45–54 years) than in the less restricted definition population (40.9% vs. 17.9%) and those in the former were more likely to have greater than a high school education (43.5% vs. 36.8%). Next, for each definition, we examined the characteristics of those who met the definitions (i.e., with knee sROA). Those who developed restrictively defined knee sROA were also much younger (45–64 years) (53.3% vs. 36.6%) and more likely to be women (76.4% vs. 62.1%) compared to those who developed the less restrictively defined knee sROA.
The short latency period to onset of restrictively defined sROA suggests greater exposure to a major risk factor for the outcome. Therefore, we conducted further descriptive analysis to examine the age-stratified distribution of other characteristics of the population, including knee risk factors such as sex, obesity and knee injury history. Appendix table 2 compares characteristics across symptomatic knee ROA definition among participants who had knee sROA by age groups. Whereas younger women (66.7%) were more likely than older women (33.3%) to have restrictively defined knee sROA, older women (60%) were more likely than the younger women (40%) to have less restrictively defined knee sROA; furthermore, among younger adults with restrictively defined knee sROA, 85% were women whereas among those with less restrictively defined sROA, only 43.5% were women. More than 70% of younger adults who had restrictively defined sROA were obese, whereas only 23.2% of older adults who developed restrictively defined sROA were obese. Younger adults with knee sROA (restrictive definition) had by far the highest prevalence (23.1%) of injury in one knee compared to all other groups (Appendix Table 2); among those with restrictively defined knee sROA, 28.7% of men had a history of knee injury compared with 18.5% of women (data not shown).
Appendix table 3 shows the hazard ratios for the effects of meeting physical activity recommendations on the risk of incident knee sROA stratified by age, sex, age and sex, and BMI. We conducted this analysis to explore, for each definition of sROA, whether the association between meeting physical activity recommendations and sROA varied across different subpopulations in our study. In the knee sROA (restrictive definition) analysis, men who met physical activity recommendations had a more than 10 fold risk of the outcome. Also, the association between having a history of knee injury and meeting physical activity recommendations was much greater (HR: 4.61 vs. 1.45) in the analysis which used the sROA (restrictive definition) compared with less restrictive definition. Stratifying further by those who were overweight/obese and have a history of knee injury, we observed that all 6 participants with incident knee sROA (restrictive definition) met physical activity recommendations.
We interpret the results very cautiously because of the low statistical power of the analysis. In the sensitivity analysis, we observed that the association between meeting physical activity recommendations and onset of restrictively defined sROA was strongest among men, and those with a history of knee injury, those who were overweight/obese, and those who were overweight/obese and had a history of knee injury. This potentially indicates that meeting physical activity recommendations may be associated with an increased risk of sROA in the presence of other major risk factors for sROA such as history of an injury or overweight/obesity. While being a woman is typically a risk factor for development of sROA, the higher prevalence of knee injuries among men likely accounts for the increased risk of sROA among men.
Appendix Table 1.
Baseline characteristics (1999–2003) of JoCo Project participants; comparison across two symptomatic knee ROA definitions at follow-up
| Knee sROA definition | ||||
|---|---|---|---|---|
|
| ||||
| Restrictive | (Less Restrictive) | |||
|
| ||||
| Overall N=599 % |
Yes N=42 (7.0%) % |
Overall N=1130 % |
Yes N=145 (12.8%) % |
|
| Age (years) | ||||
| 45–<55 | 40.9 | 15.4 | 17.9 | 12.6 |
| 55–<65 | 34.7 | 37.9 | 37.7 | 24.0 |
| 65–<75 | 20.3 | 41.9 | 27.2 | 37.4 |
| ≥75 | 4.1 | 4.8 | 17.2 | 26.0 |
| Sex | ||||
| Women | 60.7 | 76.4 | 59.3 | 62.1 |
| Men | 39.3 | 23.6 | 40.7 | 37.9 |
| Race | ||||
| Whites | 77.2 | 80.2 | 74.5 | 77.8 |
| Blacks | 22.8 | 19.8 | 25.5 | 22.2 |
| Education | ||||
| <High School | 4.9 | 5.4 | 6.9 | 9.5 |
| High School | 51.6 | 67.8 | 56.3 | 61.8 |
| >High School | 43.5 | 26.8 | 36.8 | 28.7 |
| BMI (kg/m2) | ||||
| Under/normal weight (BMI <25) | 20.7 | 7.6 | 19.8 | 10.4 |
| Overweight (25>=BMI <30) | 42.0 | 42.9 | 38.4 | 36.0 |
| Obese (BMI>=30) | 37.3 | 49.5 | 41.8 | 53.6 |
| History of knee injury | ||||
| No knee | 83.0 | 79.1 | 81.4 | 81.1 |
| One knee | 14.2 | 18.0 | 14.5 | 12.6 |
| Both knees | 2.8 | 2.9 | 4.1 | 6.3 |
BMI=body mass index
Appendix Table 2.
Baseline characteristics (1999–2003) of JoCo Project participants who had knee sROA at follow-up; a comparison across knee sROA definition by age groups
| Knee sROA (Restrictive Definition) (N=42) | Knee sROA (Less Restrictive Definition) (N=145) | |||
|---|---|---|---|---|
|
| ||||
| Age (years) | Age (years) | |||
|
| ||||
| 45–<65 (N=28, 66.7%) % (95% CI) |
≥65 (N=14, 33.3%) % (95% CI) |
45–64 (N=58, 40%) % (95% CI) |
≥65 (N=87, 60%) % (95% CI) |
|
| Sex | ||||
| Women | 85.0 (62.9, 95.0) | 65.7 (24.6, 91.8) | 43.5 (28.1, 60.3) | 71.8 (57.4, 82.8) |
| Men | 15.0 (5.0, 37.1) | 34.3 (8.2, 75.4) | 56.5 (39.7, 71.9) | 28.2 (17.2, 42.6) |
| Race | ||||
| Whites | 68.9 (39.4, 88.3) | 94.3 (56.8, 99.5) | 64.9 (46.5, 79.7) | 84.8 (74.4, 91.5) |
| Blacks | 31.1 (11.7, 60.6) | 5.8 (0.5, 43.2) | 35.1 (20.3, 53.5) | 15.2 (8.5, 25.6) |
| Education | ||||
| <High School | 0.0 | 12.1 (2.2, 46.2) | 0.7 (0.1, 4.8) | 14.8 (8.2, 25.2) |
| High School | 67.4 (46.8, 82.9) | 68.2 (30.1, 91.5) | 61.7 (44.0, 76.8) | 61.8 (49.2, 73.1) |
| >High School | 32.6 (17.1, 53.2) | 19.6 (3.2, 64.5) | 37.6 (22.6, 55.3) | 23.4 (15.0, 34.6) |
| BMI (kg/m2) | ||||
| Under/normal weight (BMI <25) | 10.5 (2.2, 38.0) | 3.9 (2.5, 5.9) | 9.7 (2.6, 30.4) | 11.3 ( 5.2, 22.7) |
| Overweight (25>=BMI <30) | 18.6 (8.9, 34.8) | 72.9 (28.7, 94.7) | 33.9 (18.3, 53.9) | 38.6 (28.0, 50.5) |
| Obese (BMI>=30) | 70.9 (44.1, 88.2) | 23.2 (3.6, 70.9) | 56.4 (37.5, 73.7) | 50.1 (39.4, 60.8) |
| History of knee injury | ||||
| No knee | 74.9 (50.5, 89.7) | 84.4 (56.8, 95.7) | 78.5 (59.3, 90.2) | 82.6 ( 70.7, 90.4) |
| One knee | 23.1 (8.9, 48.0) | 11.7 (2.1, 45.4) | 12.6 (4.3, 31.6) | 12.6 (6.4, 23.2) |
| Both knees | 2.0 (0.17, 19.5) | 3.9 (2.5, 5.9) | 8.9 (2.3, 28.4) | 4.8 (1.5, 14.6) |
BMI=body mass index
Appendix Table 3.
Hazard ratios¶ for the effects of meeting physical activity recommendations† on the risk of incident knee sROA stratified by age, sex, age and sex, and BMI
| Incident Knee sROA (Restrictive Definition) HR (95% CI) |
Incident Knee sROA* (Less Restrictive Definition) HR (95% CI) |
|
|---|---|---|
| Age (years) | ||
| 45–64 | 1.97 (0.60, 6.40) | 1.30 (0.62, 2.71) |
| ≥65 | 2.20 (0.33, 14.74) | 1.00 (0.61, 1.64) |
| Sex | ||
| Women | 1.46 (0.56, 3.76) | 1.00 (0.66, 1.51) |
| Men | 11.88 (<0.01, >99.99) | 1.31 (0.61, 2.85) |
| Age and sex | ||
| Women ages 45–64 | 1.59 (0.42, 6.11) | 0.83 (0.36, 1.89) |
| Women ages ≥ 65 | 1.46 (0.21, 10.41) | 1.22 (0.75, 2.00) |
| Men ages 45–64 | 3.76 (0, >99.99) | 2.08 (0.53, 8.24) |
| Men ages ≥ 65 | N/A | 0.73 (0.20, 2.73) |
| Knee injury | ||
| Yes | 4.61 (<0.01, >99.99) | 1.45 (0.45, 4.64) |
| No | 1.77 (0.70, 4.47) | 1.04 (0.66, 1.62) |
| BMI (kg/m2) | ||
| Overweight/obese†† | 2.19 (0.87, 5.49) | 1.28 (0.85, 1.92) |
| Normal/underweight††† | 1.89 (0, >99.99) | 0.56 (0.12, 2.77) |
| Injury and BMI (kg/m2) | ||
| No knee injury and normal/underweight | NA | 0.61 (0.11, 3.44) |
| Knee injury and normal/underweight | 0.43 (0, 99.99) | 0.22 (0, >99.99) |
| No knee injury and overweight/obese | 1.85 (0.72, 4.79) | 1.19 (0.73, 1.95) |
| Knee injury and overweight/obese | ** | 1.76 (0.48, 6.49) |
Weibull parametric hazards regression
Moderate-equivalent minutes of physical activity for ≥ 150 minutes/week,
BMI ≥ 25 kg/m2,
BMI <25 kg/m2
All participants without both symptoms and ROA in a knee at baseline were included
All 6 participants with sROA (strict definition) in this group met the physical activity recommendations (HR too large to show)
NA: HRs could not be estimated
Footnotes
Conflict of Interest
All authors have no conflict of interest to declare
CDC Disclaimer
The findings and conclusions in this report are those of the authors and do not necessarily represent the official position of the Centers for Disease Control and Prevention.
Contributor Information
KE Barbour, Email: iyk1@cdc.gov.
JM Hootman, Email: JHootman@cdc.gov.
CG Helmick, Email: cgh1@cdc.gov.
LB Murphy, Email: alx2@cdc.gov.
Kristina A. Theis, Email: cko3@cdc.gov.
TA Schwartz, Email: tschwart@email.unc.edu.
WD Kalsbeek, Email: bill_kalsbeek@unc.edu.
JB Renner, Email: jordan_renner@med.unc.edu.
JM Jordan, Email: joanne_jordan@med.unc.edu.
References
- 1.Lawrence RC, Felson DT, Helmick CG, Arnold LM, Choi H, Deyo RA, et al. Estimates of the prevalence of arthritis and other rheumatic conditions in the United States. Part II. Arthritis and rheumatism. 2008;58(1):26–35. doi: 10.1002/art.23176. [DOI] [PMC free article] [PubMed] [Google Scholar]
- 2.Woolf AD, Pfleger B. Burden of major musculoskeletal conditions. Bulletin of the World Health Organization. 2003;81(9):646–56. [PMC free article] [PubMed] [Google Scholar]
- 3.Jinks C, Jordan K, Ong BN, Croft P. A brief screening tool for knee pain in primary care (KNEST). 2. Results from a survey in the general population aged 50 and over. Rheumatology. 2004;43(1):55–61. doi: 10.1093/rheumatology/keg438. [DOI] [PubMed] [Google Scholar]
- 4.Blagojevic M, Jinks C, Jeffery A, Jordan KP. Risk factors for onset of osteoarthritis of the knee in older adults: a systematic review and meta-analysis. Osteoarthritis and cartilage / OARS, Osteoarthritis Research Society. 2010;18(1):24–33. doi: 10.1016/j.joca.2009.08.010. [DOI] [PubMed] [Google Scholar]
- 5.Galois L, Etienne S, Grossin L, Cournil C, Pinzano A, Netter P, et al. Moderate-impact exercise is associated with decreased severity of experimental osteoarthritis in rats. Rheumatology. 2003;42(5):692–3. doi: 10.1093/rheumatology/keg094. author reply 3–4. [DOI] [PubMed] [Google Scholar]
- 6.Otterness IG, Eskra JD, Bliven ML, Shay AK, Pelletier JP, Milici AJ. Exercise protects against articular cartilage degeneration in the hamster. Arthritis and rheumatism. 1998;41(11):2068–76. doi: 10.1002/1529-0131(199811)41:11<2068::AID-ART23>3.0.CO;2-L. [DOI] [PubMed] [Google Scholar]
- 7.Cooper C, Snow S, McAlindon TE, Kellingray S, Stuart B, Coggon D, et al. Risk factors for the incidence and progression of radiographic knee osteoarthritis. Arthritis and rheumatism. 2000;43(5):995–1000. doi: 10.1002/1529-0131(200005)43:5<995::AID-ANR6>3.0.CO;2-1. [DOI] [PubMed] [Google Scholar]
- 8.Felson DT, Zhang Y, Hannan MT, Naimark A, Weissman B, Aliabadi P, et al. Risk factors for incident radiographic knee osteoarthritis in the elderly: the Framingham Study. Arthritis and rheumatism. 1997;40(4):728–33. doi: 10.1002/art.1780400420. [DOI] [PubMed] [Google Scholar]
- 9.Felson DT, Niu J, Clancy M, Sack B, Aliabadi P, Zhang Y. Effect of recreational physical activities on the development of knee osteoarthritis in older adults of different weights: the Framingham Study. Arthritis and rheumatism. 2007;57(1):6–12. doi: 10.1002/art.22464. [DOI] [PubMed] [Google Scholar]
- 10.McAlindon TE, Wilson PW, Aliabadi P, Weissman B, Felson DT. Level of physical activity and the risk of radiographic and symptomatic knee osteoarthritis in the elderly: the Framingham study. The American journal of medicine. 1999;106(2):151–7. doi: 10.1016/s0002-9343(98)00413-6. [DOI] [PubMed] [Google Scholar]
- 11.Hart DJ, Doyle DV, Spector TD. Incidence and risk factors for radiographic knee osteoarthritis in middle-aged women: the Chingford Study. Arthritis and rheumatism. 1999;42(1):17–24. doi: 10.1002/1529-0131(199901)42:1<17::AID-ANR2>3.0.CO;2-E. [DOI] [PubMed] [Google Scholar]
- 12.Mork PJ, Holtermann A, Nilsen TI. Effect of body mass index and physical exercise on risk of knee and hip osteoarthritis: longitudinal data from the Norwegian HUNT Study. Journal of epidemiology and community health. 2012 doi: 10.1136/jech-2011-200834. [DOI] [PubMed] [Google Scholar]
- 13.Cheng Y, Macera CA, Davis DR, Ainsworth BE, Troped PJ, Blair SN. Physical activity and self-reported, physician-diagnosed osteoarthritis: is physical activity a risk factor? Journal of clinical epidemiology. 2000;53(3):315–22. doi: 10.1016/s0895-4356(99)00168-7. [DOI] [PubMed] [Google Scholar]
- 14.Hootman JM, Macera CA, Helmick CG, Blair SN. Influence of physical activity-related joint stress on the risk of self-reported hip/knee osteoarthritis: a new method to quantify physical activity. Preventive medicine. 2003;36(5):636–44. doi: 10.1016/s0091-7435(03)00018-5. [DOI] [PubMed] [Google Scholar]
- 15.Kim YJ, Bonassar LJ, Grodzinsky AJ. The role of cartilage streaming potential, fluid flow and pressure in the stimulation of chondrocyte biosynthesis during dynamic compression. Journal of biomechanics. 1995;28(9):1055–66. doi: 10.1016/0021-9290(94)00159-2. [DOI] [PubMed] [Google Scholar]
- 16.Physical Activity Guidelines Advisory Committee Report, 2008. Nutr Rev. 2009;67(2):114–20. doi: 10.1111/j.1753-4887.2008.00136.x. [DOI] [PubMed] [Google Scholar]
- 17.Jordan JM, Helmick CG, Renner JB, Luta G, Dragomir AD, Woodard J, et al. Prevalence of knee symptoms and radiographic and symptomatic knee osteoarthritis in African Americans and Caucasians: the Johnston County Osteoarthritis Project. The Journal of rheumatology. 2007;34(1):172–80. [PubMed] [Google Scholar]
- 18.Taylor HL, Jacobs DR, Jr, Schucker B, Knudsen J, Leon AS, Debacker G. A questionnaire for the assessment of leisure time physical activities. Journal of chronic diseases. 1978;31(12):741–55. doi: 10.1016/0021-9681(78)90058-9. [DOI] [PubMed] [Google Scholar]
- 19.Richardson MT, Leon AS, Jacobs DR, Jr, Ainsworth BE, Serfass R. Comprehensive evaluation of the Minnesota Leisure Time Physical Activity Questionnaire. Journal of clinical epidemiology. 1994;47(3):271–81. doi: 10.1016/0895-4356(94)90008-6. [DOI] [PubMed] [Google Scholar]
- 20.Kellgren JH, Lawrence JS. Radiological assessment of osteo-arthrosis. Annals of the rheumatic diseases. 1957;16(4):494–502. doi: 10.1136/ard.16.4.494. [DOI] [PMC free article] [PubMed] [Google Scholar]
- 21.Jordan JM, Linder GF, Renner JB, Fryer JG. The impact of arthritis in rural populations. Arthritis care and research : the official journal of the Arthritis Health Professions Association. 1995;8(4):242–50. doi: 10.1002/art.1790080407. [DOI] [PubMed] [Google Scholar]
- 22.Odell PM, Anderson KM, D’Agostino RB. Maximum likelihood estimation for interval-censored data using a Weibull-based accelerated failure time model. Biometrics. 1992;48(3):951–9. [PubMed] [Google Scholar]
- 23.Griffin J. Statistical Software Components. 2005. INTCENS: Stata module to perform interval-censored survival analysis. [Google Scholar]
- 24.Kannel WB, Sorlie P. Some health benefits of physical activity. The Framingham Study. Archives of internal medicine. 1979;139(8):857–61. [PubMed] [Google Scholar]
- 25.Buckland-Wright JC, Macfarlane DG, Lynch JA, Jasani MK, Bradshaw CR. Joint space width measures cartilage thickness in osteoarthritis of the knee: high resolution plain film and double contrast macroradiographic investigation. Annals of the rheumatic diseases. 1995;54(4):263–8. doi: 10.1136/ard.54.4.263. [DOI] [PMC free article] [PubMed] [Google Scholar]
- 26.Law CG, Brookmeyer R. Effects of mid-point imputation on the analysis of doubly censored data. Statistics in medicine. 1992;11(12):1569–78. doi: 10.1002/sim.4780111204. [DOI] [PubMed] [Google Scholar]
- 27.Klein J, Moeschberger M. Survival Analysis: Techniques of Censored and Truncated Data. 2. New York: NY Springer-Verlag; 2003. [Google Scholar]
- 28.Bijnen FC, Feskens EJ, Caspersen CJ, Mosterd WL, Kromhout D. Age, period, and cohort effects on physical activity among elderly men during 10 years of follow-up: the Zutphen Elderly Study. The journals of gerontology Series A, Biological sciences and medical sciences. 1998;53(3):M235–41. doi: 10.1093/gerona/53a.3.m235. [DOI] [PubMed] [Google Scholar]
- 29.Centers for Disease C and Prevention. Adult participation in aerobic and muscle-strengthening physical activities - United States, 2011. MMWR Morbidity and mortality weekly report. 2013;62(17):326–30. [PMC free article] [PubMed] [Google Scholar]
- 30.Crutzen R, Goritz AS. Does social desirability compromise self-reports of physical activity in web-based research? The international journal of behavioral nutrition and physical activity. 2011;8:31. doi: 10.1186/1479-5868-8-31. [DOI] [PMC free article] [PubMed] [Google Scholar]