Abstract
We characterize what the optimal exchange properties are for CEST contrast agents on 3T clinical scanners using CW saturation transfer, and demonstrate that the exchangeable protons in phenols can be tuned to reach these criteria through proper ring substitution. Systematic modification allows the chemical shift of the exchangeable protons to be positioned between 4.8 ppm to 12 ppm from water and enables adjustment of the proton exchange rate to maximize CEST contrast at these shifts. In particular, 44 hydrogen-bonded phenols are investigated for their potential as CEST MRI contrast agents and the stereoelectronic effects on their CEST properties summarized. Furthermore, we identify a pair of compounds, 2,5-dihydroxyterephthalic acid (42) and 4,6-dihydroxyisophthalic acid (43), which produce the highest sensitivity through incorporating two exchangeable protons per ring.
Keywords: CEST, IM-SHY, molecular imaging, MRI, contrast agents
Introduction
Due to its exquisite soft tissue contrast and high spatial resolution, magnetic resonance imaging (MRI) is a pre-eminent clinical diagnostic tool. In over one third of clinical MRI scans, exogenous contrast agents such as gadolinium complexes are administered to improve sensitivity [1]. Those compounds work by enhancing the water relaxation (T1) in tissue, with ongoing efforts in the design of analogs that enhance relaxivity at high fields [2]. Relaxation-based agents, including gadolinium complexes, manganese [3] and iron oxides [4], were the status quo for exogenous MRI contrast until Ward and Balaban suggested as an alternative using exchangeable solute protons in diamagnetic compounds to produce MRI contrast [5]. Soon after, van Zijl developed diamagnetic polymers and Sherry and Aime developed paramagnetic agents, respectively, which could also generate contrast based on proton exchange with water.[6]. Importantly, unlike relaxation agents, such contrast can be “turned on” by selectively irradiating the labile protons using a radiofrequency pulse corresponding to the chemical shift of the exchangeable proton in the system under study. Other significant advantages of the method, termed chemical exchange saturation transfer (CEST), are that the signal of the solute molecules, which are in relatively low concentration, can be enhanced by several orders of magnitude [7] and that the contrast produced is sensitive to environmental parameters such as temperature, pH, membrane fluidity and cation concentration [8]. Several common natural compounds have been reported to produce significant CEST contrast including glucose, glycogen, myo-inositol, glutamate, creatine, l-arginine, glycosaminoglycans, nucleic acids and peptides [9]. Further, to date, several human studies with administration of exogenous diamagnetic CEST agents [10] have been reported, with more under way.
A key requirement for CEST MRI experiments is to selectively irradiate solute protons and avoid perturbing the bulk water signal. Consequently, the chemical shift frequency of the labile solute protons must be distinct from the bulk water resonance to enable their detection through saturation transfer. On the NMR chemical shift time scale, that implies the exchangeable solute protons need to be in the slow-intermediate exchange regime. i.e., the rate of exchange (kex) is preferably be less than the difference in frequency between the exchangeable solute protons and the water protons (Δω):
| (1) |
The importance in balancing chemical shift and kex of the labile protons has been discussed extensively in several reviews [7a-c]. To define properly which kex and chemical shifts are desirable for exogenous CEST contrast agents, we numerically solved the Bloch-McConnell equations [11] for a two-pool system for a long continuous wave saturation pulse over a range of solute proton kex and chemical shifts with the results displayed at ω1 = 2 μT, 4 μT in Figure 1. The simulations represent imaging conditions currently feasible on 3 T clinical scanners, and show the great advantage of increasing the chemical shift beyond 4 ppm with respect to the water proton resonance, with diminishing gains occuring by ~ 12 ppm, provided that a 4 μT saturation pulse is utilized. The optimum kex is about 1,050 s-1 for that saturation field strength. A 55% improvement could be realized should it be feasible to increase the labile proton chemical shift to 20 ppm and apply long 8 μT saturation pulses on clinical scanners, but this is currently not feasible using a clincally relevant body coil. Diamagnetic CEST (diaCEST) contrast agents such as glucose, creatine and other common metabolites are very attractive biomarkers. However, their exchangeable protons fall within 3.6 ppm from bulk water, which as shown in Fig. 1 results in reduced sensitivity at 3 T through saturation transfer. Further shifted labile protons (up to ~ 6 ppm) have been reported in barbituric acid [5], iopamidol analogues [12] and thymidine analogues [13], and represent improvements, but as shown by these simulations are still not ideal.
Figure 1. Simulated CEST contrast at 3T as a function of labile proton chemical shift and exchange rate.
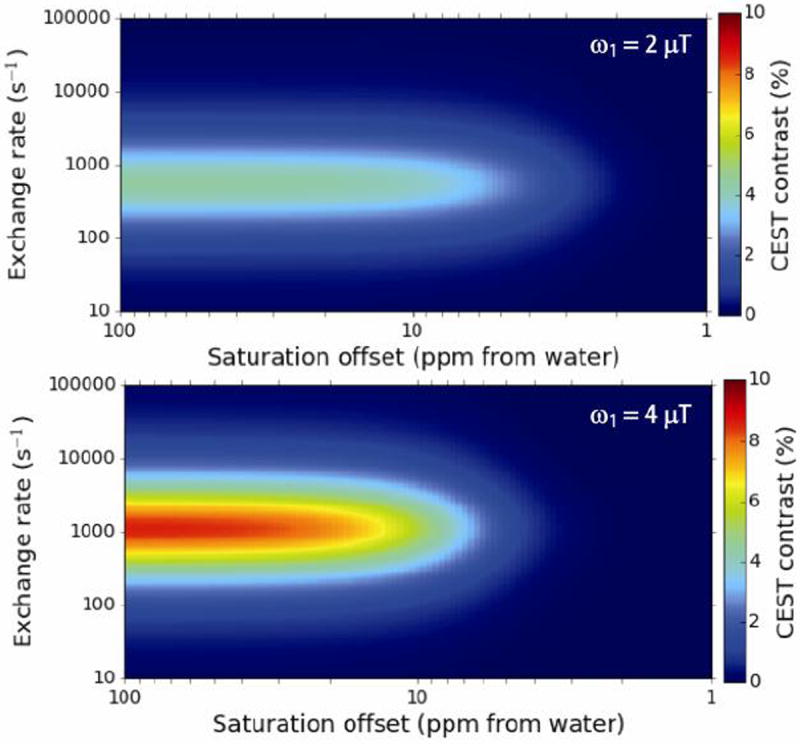
Conditions: tsat = 3 s, XCA = 10 mM, T1w = 3 s, T2w = 0.1 s, T1s = 3 s T2s = 0.1 s, ω1 = 2 μT (upper panel) ω1 = 4 μT (lower panel).
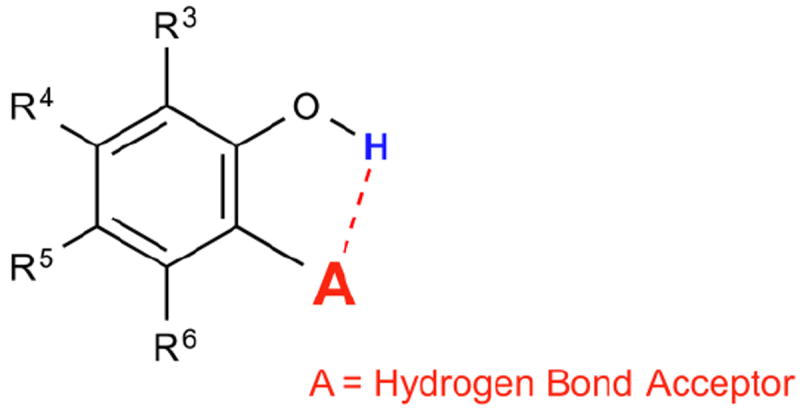
We are interested in developing large chemical shift diaCEST contrast agents in order to enable CEST imaging on clinical scanners. We reported previously that the intra-molecular hydrogen bond in salicylic acid (1) helped to shift its phenol CEST signal to 9.3 ppm [14]. Prolonged retention of the exchangeable phenolic proton through intra-molecular hydrogen bonding resulted in an kex of 600 s-1 at neutral pH. At pH values between 6.5 and 7.4, salicylic acid gave the ideal kex (2,400 – 400 s-1) for imaging at low saturation power. Its far down field chemical shift and optimum kex at neutral pH is a combination effect from hydrogen bonding strength, phenolic proton pKa, aromatic deshielding and water solvation of the exchangeable protons. In order to understand the role of these factors, we systematically investigate how chemical structure can affect the CEST properties of hydrogen bonded, phenol-based Intra-Molecular bond-Shifted HYdrogens (IM-SHY) diaCEST agents. Forty-four related compounds, which adhere to the general scaffold shown in Scheme 1, are characterized with the factors that enable optimization for CEST for this series are also summarized.
Scheme 1. General scaffold for phenol based IM-SHY CEST agents.
Results and Discussion
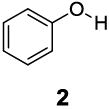
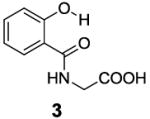
Based on the CEST properties of salicylic acid 1, we became interested in developing a coherent strategy to refine the basic phenol scaffold to maximize the sensitivity of this class of CEST contrast agents. As the intra-molecular hydrogen bond is a key feature, we were particularly interested in investigating the influence of the hydrogen bond acceptor on the phenol protons. To measure the kex we performed QUESP [11]measurements at 17.6 T, the highest field scanner at our institution, where the slow-to-intermediate exchange condition holds for the most compounds. Eight different intra-molecular hydrogen bond acceptors were characterized for water soluble phenols in Table 1. Compound 1 showed a kex of 410 s-1, which is slightly different from our earlier reported number at neutral pH. The kex on phenol (2) proved too fast to allow detection through saturation transfer (Table 1), and was estimated to be > 40,000 s-1 at 5.0 ppm. Changing 1 to its glycine conjugate, salicyluric acid (3), gave no contrast at 9.3 ppm, presumably because kex is too fast (Table 1). The amide proton also did not give significant contrast due to its slow exchange. o-Nitrophenol (4) and 8-hydroxylquinoline N-oxide (5), which were reported to form strong intra-molecular hydrogen bonds,[15] failed to produce significant contrast (Table 1) as well. Water soluble salicylaldehyde and its derivatives were also investigated. 3-Formyl-4-hydroxybenzoic acid (6) and salicylaldoxime (7) exchanged too fast to provide contrast. Interestingly, imine groups could attenuate the kex of phenol to a detectable level. N,N’-bis(4-carboxysalicylidene)-1,2-diaminoethane (8) resonated at 7.8 ppm, although the kex was still quite fast at 16,000 s-1. Salen ligands such as 8 are commonly used as metal chelators and are widely applied in catalysis [16]. Their IM-SHY signals could potentially be applied for cation sensing, because the phenol protons would be exchanged upon formation of a metal complex. Tetrazole (9), which is commonly used as an isostere for the carboxylate function, was also studied, but failed to provide any contrast due to excessively rapid exchange. The results suggest that the success of salicylic acid is due to the balance of the intra-molecular hydrogen bond strength and solvation by water. The carboxylate anion in salicylic acid at neutral pH helped to shift the IM-SHY proton further downfield relative to phenol (and water) while maintaining a kex appropriate for detection, while other acceptors were either too strong or weak for providing significant contrast.
Table 1. Effect of hydrogen bond acceptor on the CEST property of phenol based IM-SHYs.
| Compound | Signal (ppm) | Contrast(%) | kex (s-1) |
|---|---|---|---|

|
9.3 | 6.8 | 410±20 |
|
~5.0 | < 0.4 | NA |
|
None | 0 | NA |
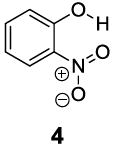
|
None | 0 | NA |
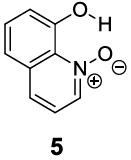
|
9.5 | 0.7 | 29±10 |
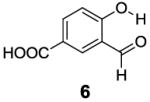
|
None | 0 | NA |
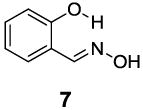
|
None | 0 | NA |

|
7.8 | 1.7 | 16,000±4000 |
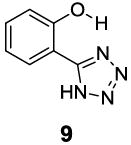
|
None | 0 | NA |
Conditions: CEST data were obtained at 10 mM concentration, tsat = 3 sec, ω1 = 3.6 μT and 37 °C. Note: As discussed in an earlier section, the kex of phenol based protons drops dramatically with an increase in pH (from 6-8). The direct comparison of kex also needs to take this into account. All pH values in this paper were titrated to 7.3 - 7.4 for consistency.
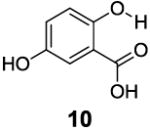
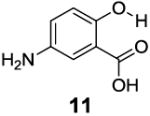
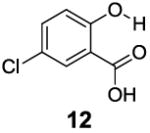
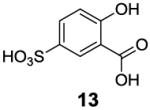
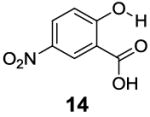
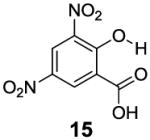
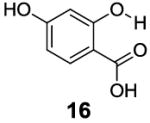
After accumulating the data in Table 1, we further studied the stereo-electronic effects of aromatic ring substitution on salicylic acid. We started with an investigation of substitution at the 4- and 5-positions(Table 2). Most inductive electron donating (hydroxyl-, amino-) and withdrawing (chloro-, carboxyl-, sulfonyl- and nitro-) groups did not dramatically change the contrast at those positions (Table 2, compounds 10-14 and 16-18). The electronic effects on the IM-SHY phenol proton were clearly reflected on the chemical shift of the peak CEST signal. 2,5-Dihydroxybenzoic acid (10) and 5-aminosalicylic acid (11) with electron donating groups para to the position of the IM-SHY proton showed peak signals at 8.5 ppm, compared with the 9.3 ppm in salicylic acid (1), which also resulted in higher pKa values. (Table 2) Electron withdrawing groups in the para-position (Table 2) and meta inductive substitutions (Table 2, compounds 16-18) shifted the IM-SHY signal slightly downfield, which also resulted in lower pKa values. 3,5-Dinitrosalicylic acid (15) failed to give any contrast, because it exists predominantly in its deprotonated form at neutral pH. In contrast to the clear trend in chemical shift, the kex of IM-SHY protons were quite similar to salicylic acid at neutral pH, which indicated the carboxylate anion helped to buffer the moderate pKa changes (Table 2, compounds 10-13 and 16-18). In the case of 5-nitrosalicylic acid (14) and 2-hydroxy-4-nitrobenzoic acid (19), the phenol proton exchanged faster at 6,000 s-1 and 1,440 s-1 respectively, which indicated their pKa’s are quite close to the limit and the O-H bond is quite weak at neutral pH (Table 2). Assuming Δω ~ 11 ππμ, for Bo = 3 T this translates to kex < 1,400 s-1. The chemical shift observed for 5-nitrosalicylic acid (14) was 10.3 ppm and it was close to the maximum that could be achieved by tuning only the pKa of R2-OH.
Table 2. Electronic effect of 4- and 5- substituted 2-hydroxybenzoic acids.
| Compound | Signal (ppm) | Contrast(%) | kex (s-1) |
|---|---|---|---|
|
8.5 | 7.7 | 410±30 |
|
8.5 | 7.0 | 370±20 |
|
9.0 | 6.2 | 260±40 |
|
9.5 | 5.7 | 320±30 |
|
10.3 | 3.1 | 6000±1000 |
|
None | 0 | NA |
|
9.5 | 7.2 | 450±30 |
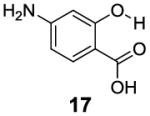
|
9.5 | 6.6 | 360±30 |
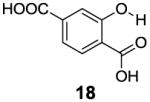
|
9.3 | 6.7 | 420±20 |
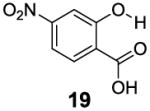
|
9.5 | 6.7 | 1440±70 |
Conditions: CEST data were obtained at 10 mM concentration, pH 7.3 - 7.4, tsat = 3 sec, ω1 = 3.6 μT and 37 °C.
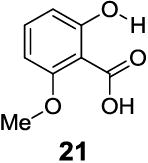
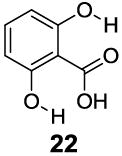
With improved understanding of the pure electronic effects on the IM-SHY signal, we investigated more complicated 3- and 6-substituted 2-hydroxybenzoic acids, which produce ortho effects on the core hydroxyl and carboxylate substituents. As shown in Table 3, substitution at the 6-position results in a more nuanced behavior. Any subtle stereo bulky modification can produce a dramatic change in the hydrogen bonding between the carboxylate and IM-SHY proton. Although 2-hydroxy-1-naphthoic acid (20) (Table 3) and 6-methoxysalicylic acid (21) (Table 3) still gave IM-SHY contrast at 9.5 ppm and 9.0 ppm, the kex were around 11-12 times faster compared with salicylic acid, making them less useful for low field MR applications. Interestingly, 2,6-dihydroxybenzoic acid (22) (Table 3) with two O-H hydrogen-bonded to the carboxylate anion, exchanged with water at the slow rate of 30 s-1. That result seems to suggest the importance of the solvation of the carboxylate on buffering the IM-SHY kex. Overall, these results indicate that the kex can be dramatically altered by substituting at the 6-position without altering the chemical shift.
Table 3. Stereo-electronic effect of 6-substituted 2-hydroxybenzoic acids.
| Compound | Signal (ppm) | Contrast(%) | kex (s-1) |
|---|---|---|---|
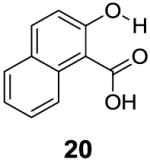
|
9.5 | 3.4 | 4800±700 |
|
9.0 | 3.2 | 4900±600 |
|
9.3 | 0.4 | 30±10 |
Conditions: CEST data were obtained at 10 mM concentration, pH 7.3 - 7.4, tsat = 3 sec, ω1 = 3.6 μT and 37 °C.
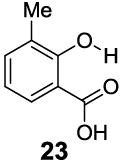
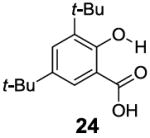
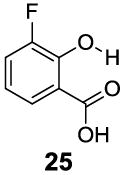
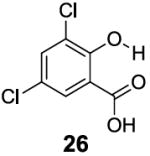
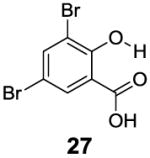
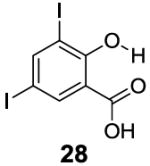
In contrast to the 6-position, 2-hydroxybenzoic acids with 3-position substituents can give higher chemical shift than salicylic acid(1) with tunable kex. 3-Methylsalicylic acid (23) (Table 4) showed peak contrast at 9.5 ppm at a slightly slower kex of 240 s-1, compared to 410 s-1 for 1. Increasing the size of the substituent at the 3-position likely would prevent access to water needed for solvation, and the phenol proton in 3,5-di-tert-butylsalicylic acid (24) (Table 4) exchanged with water slowly at 9.3 ppm (21 s-1). 3-Halo substitution affected the IM-SHY signal through a combination of steric and electronic de-shielding effects. The electronic de-shielding trend was shown clearly changing from fluoro to chloro, bromo and iodo, with an increase in the size of the polarizable electron cloud. The chemical shifts were observed at 9.5, 10.3, 10.5 and 10.8 ppm respectively. (Table 4, compounds 25-28) The combination of steric and electronic de-shielding effects was reflected in the drop in kex from 980, to 550 and 290 s-1. 3,5-Dibromosalicylic acid (27) proved to be the optimum with both a large chemical shift and suitable kex for low field power MR imaging.
Table 4.
Stereo-electronic effect of 3-substituted 2-hydroxybenzoic acids
| Compound | Signal (ppm) | Contrast(%) | kex (s-1) |
|---|---|---|---|
|
9.5 | 6.2 | 240±20 |
|
9.3 | 1.5a | 21±5 |
|
9.5 | 7.4 | 800±200 |
|
10.3 | 6.7 | 980±90 |
|
10.5 | 9.1 | 550±40 |
|
10.8 | 5.3 | 290±20 |
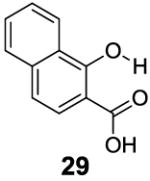
|
10.5 | 3.4 | 220±20 |
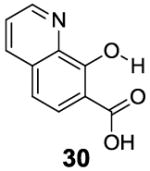
|
10.3 | 6.4 | 1400±300 |
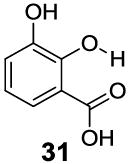
|
9.0 | 5.3 | 2200±200 |
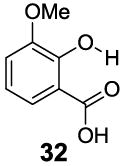
|
9.3 | 6.5 | 440±50 |
|
9.0 | 6.3 | 400±20 |
|
10.5 | 7.7 | 520±30 |
|
9.5 | 3.9 | 7100±400 |
|
12.0 | 5.4 | 1400±300 |
Conditions: CEST data were obtained at 10 mM concentration, pH 7.3 - 7.4, tsat = 3 sec, ω1 = 3.6 μT and 37 °C.
20 mM was used because of the low contrast.
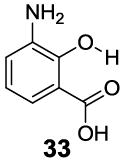
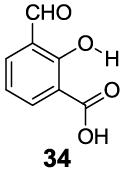
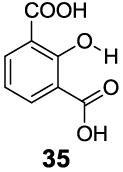
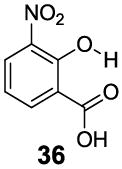
3-Aryl substituted salicylic acids were also studied. 1-Hydroxy-2-naphthoic acid (29) did posses a larger chemical shift at 10.5 ppm, but the kex dropped to 220 s-1, from introduction of extra steric factors (Table 4). In 8-hydroxy-7-quinolinecarboxylic acid (30), the carboxylate anion was less effective in attenuating the kex of the phenolic proton and the kex was 1,400 s-1 at a chemical shift of 10.3 ppm. A reasonable explanation might be that the presence of hydrogen bonding of the quinoline nitrogen to water, inducing a faster proton kex (Table 4), although solvation could also play a role. That is similar to behavior seen for amide protons near lysine or arginine sidechains in small peptides [9h]. A similar effect was also observed in 2,3-dihydroxybenzoic acid (31), which resonated at 9.0 ppm with an kex of 2,200 s-1 (Table 4). In contrast, its close analogue, 3-methoxysalicylic acid (32), demonstrated the expected IM-SHY signal at 9.3 ppm and 440 s-1 (Table 4). However, in 3-aminosalicylic acid (33), that acceleration effect was not observed with the kex 400 s-1 (Table 4). The effect of electron withdrawing groups was also studied. 3-Formylsalicylic acid (34) generated CEST signal at 10.5 ppm with a kex of 520 s-1, but 2-hydroxyisophthalic acid (35) had a higher kex at 7,100 s-1, decreasing available signal (Table 4). The largest de-shielding effect was achieved on 3-nitrosalicylic acid (36), with the OH resonating at 12.0 ppm, the farthest we have measured for any diaCEST probe, with a moderate kex of 1,400 s-1 (Table 4).
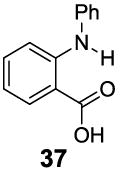
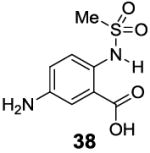
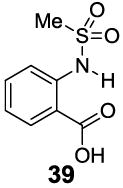
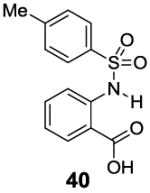
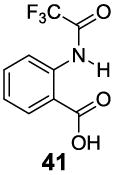
A remaining issue to consider is the role of the phenolic O-H group in 2-hydroxybenzoic acid. We have identified a series of N-H groups as alternatives, including: arylamino (4.8 ppm for compound 37), sulfonamido (6.3-7.8 ppm for compounds 38-40) and trifluoroacetamido (9.3 ppm for compound 41) groups [17] (Table 5). They behaved in a tunable and pH independent manner as described previously, complementary to the 2-hydroxybenzoic acids discussed here.
Table 5. Anthranillic acid derivatives as IM-SHY diaCEST probes.
| Compound | Signal (ppm) | Contrast(%) | kex (s-1) |
|---|---|---|---|
|
4.8 | 7.4 | 700±40 |
|
6.3 | 8.4 | 540±30 |
|
7.3 | 7.7 | 470±30 |
|
7.8 | 6.8 | 420±30 |
|
9.3 | 3.5 | 180±20 |
Conditions: CEST data were obtained at 10 mM concentration, pH 7.3 - 7.4, tsat = 3 sec, ω1 = 3.6 μT and 37 °C.
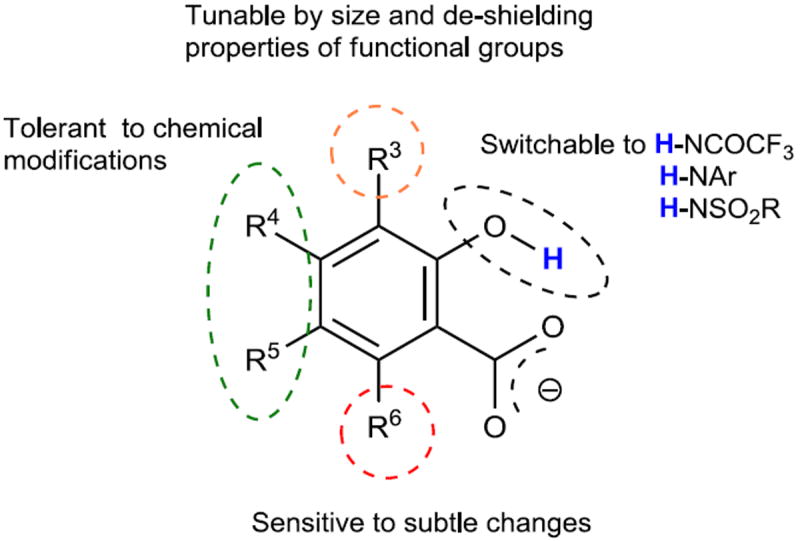
Our current understanding of the CEST properties of the 2-hydroxybenzoic acid scaffold are summarized in Scheme 2. A) The carboxylate anion is critical to buffer the proton kex of the ortho phenol. It provides the hydrogen bonding and appropriate water solvation environment around the exchangeable proton. B) Substitutions at the 4- and 5- positions on 2-hydroxybenzoic acid slightly affect the chemical shift through electronic effects. Those normally do not change the kex significantly, with the exception of the 5-nitro and 4-nitro groups. They present the best positions at which to conjugate targeting agents and other functions while maintaining CEST signal. C) Modification of the 6-position is not suggested. Maintenance of a R-6 proton is required to provide the correct kex for low field CEST imaging. D) The 3-position is less predictable. Bulky modification at R-3 can reduce the kex but fast exchangeable proton substitutions, such as O-H and pyridinium can also be introduced to increase kex and also extra de-shielding can be introduced through modification of the R-3 position with bromo, iodo, aryl, carbonyl and nitro groups. It is the ideal position to design smart, switchable IM-SHY probes. E). The R-2-OH group could be switched to several N-H groups.
Scheme 2. Stereo-electronic effect on the CEST properties of IM-SHY agents.
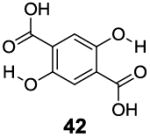
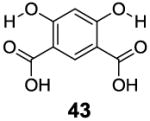
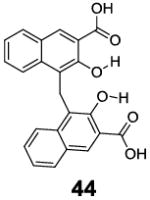
With the basic properties of IM-SHY 2-hydroxybenzoic acid probes discussed above, we decided to investigate if we could improve the detection limit further through increasing the number of IM-SHY cores. To avoid the ortho substitution close to the primary IM-SHY core, 2,5-dihydroxyterephthalic acid (42) and 4,6-dihydroxyisophthalic acid (43) were tested (Table 6). Both of those compounds performed extremely well as high sensitivity diaCEST probes. 2,5-Dihydroxyterephthalic acid (42) IM-SHY protons resonated at 8.3 ppm with kex of 980 s-1, making it a higher sensitivity probe when high saturation fields (4 μT) are employed. 4,6-Dihydroxyisophthalic acid IM-SHY protons resonated at 9.8 ppm and exchanged with water at 460 s-1, making this compound suitable for use at lower magnetic field strengths (2 μT). They can generate 17.1 % and 13.0 % contrast respectively, at 10 mM concentration using 3.6 μT, the best of any diaCEST agents evaluated. Pamoic acid (44), a FDA proved drug additive [18], was also tested. But the IM-SHY protons exchanged too slowly (130 s-1), producing only 5.7 % contrast at 10 mM, because of the bulky ortho substitution to the phenolic O-H.
Table 6. Substituted 2-hydroxybenzoic acids with increased IM-SHY signal density.
| Compound | Signal (ppm) | Contrast(% at 3.6 μT) | kex (s-1) |
|---|---|---|---|
|
8.3 | 17.1 | 980±40 |
|
9.8 | 13.0 | 460±30 |
|
9.5 | 5.7 | 130±10 |
Conditions: CEST data were obtained at 10 mM concentration, pH 7.3 - 7.4, tsat = 3 sec, ω1 = 3.6 μT and 37 °C.
We decided to test the detection limit of the agent generating the highest contrast, 2,5-dihydroxyterephthalic acid (42), at 3T to determine whether it could be applied easily to scanning at clinical field strengths. Below 10 mM, the contrast was linearly dependent on concentration, as shown in Figure 2. At 2.1 μT, 0.5 mM of 42 still produced 0.6 % contrast at 8.5 ppm, as shown in Figure 2. The deviation between simulation and experiment for the 10 mM concentration found at ~1 ppm are most likely due to imperfect B0 correction. Because of its higher kex at T=37 °C, the detection limit could be pushed down to 0.2 mM with around 0.5 % contrast when using 8 μT (See supporting information). This detection threshold is dependent on the experimental conditions of the scanner and application.
Figure 2. Concentration dependence and detection limit of 2,5-dihydroxyterephthalic acid (42) at 3 T.
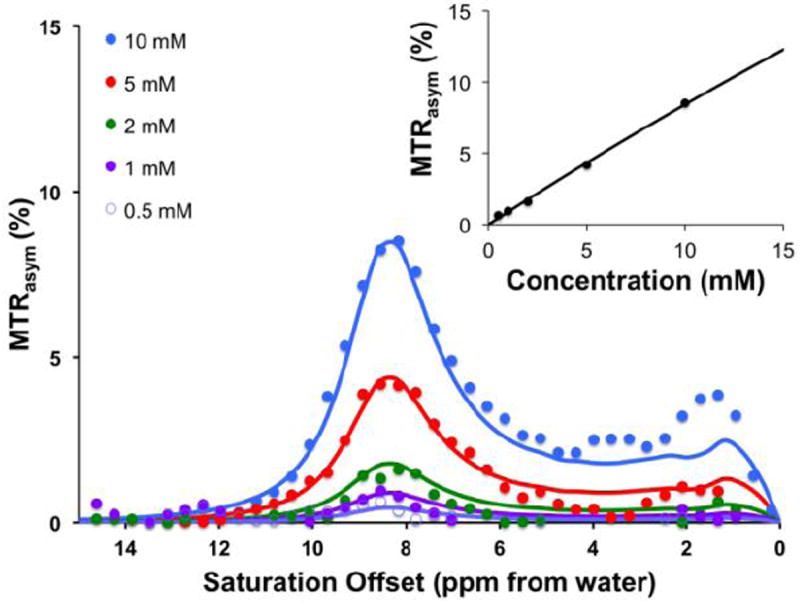
Conditions: CEST data were obtained at 10 mM, 5mM, 2mM, 1 mM, 0.5 mM concentrations, pH 7.3 - 7.4, tsat = 3 sec, ω1 = 2.1 μT and T= 32°C. For the innner panel, the CEST contrast at 8.5 ppm was plotted. Experimental data are shown as closed circles, while the lines represent Bloch simulations.
Hydrogen bonded phenols exist widely as natural products and also as therapeutics. For example, aspirin is the most commonly used nonsteroidal anti-inflammatory drug (NSAID), which works as a prodrug of salicylic acid. Doxorubicin and mitoxantrone are used commonly as anti-tumor drugs. Tetracycline is one of the oldest antibiotics. Enterobacin exists as the strongest iron binding compound in bacteria. The toxicity for a number of those compounds has been determined, and they are generally not toxic at doses suitable for diaCEST imaging. For example, 4-amino salicylic acid has a median LD50 of 4,250 mg/kg. 2,4-Dihydroxy benzoic acid, salicylic acid, flufenamic acid also have relatively high LD50 values at 800 mg/kg, 500 mg/kg and 150 mg/kg, respectively. As described above, we define criteria that enable phenols to produce substantial CEST contrast at 3 T, which involve a balance between chemical shift and water kex. As shown in Figure 3, compounds were identified that produce strong contrast from 4.8 ppm to 12 ppm from water based on modifications at the R3, R4, R5, R6 positions in addition to modification of the OH hydrogen bonding partner.
Figure 3. High performance IM-SHY agents with different exchangeable proton frequencies.
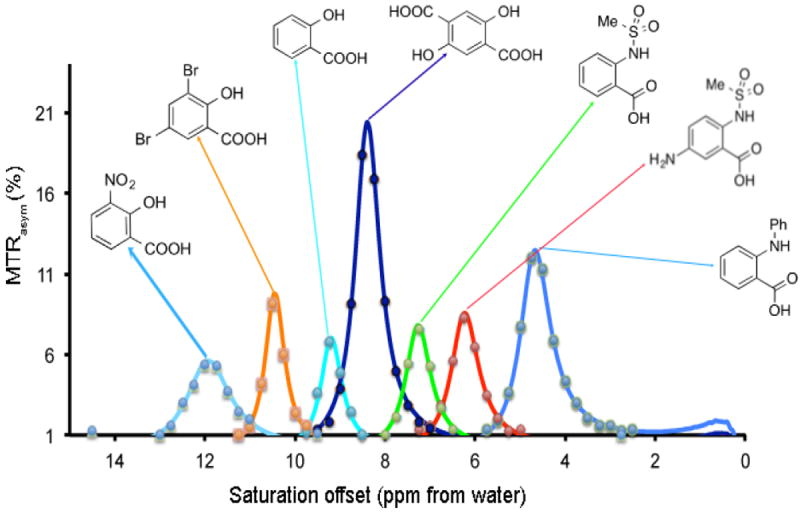
Conditions: CEST data were obtained at 17.6 T using 10 mM concentrations, pH 7.3 - 7.4, tsat = 3 sec, ω1 = 3.6 μT and T= 37 °C. Experimental data are shown as closed circles, while the lines represent Bloch simulations.
Lanthanide, Iron, Cobalt and Nickel complexes can also feature exchangeable protons with large chemical shifts from water (on the order of 30-700 ppm) and suitable kex [7a, 19]. The large chemical shift difference with water for those paramagnetic CEST (paraCEST) agents enables faster exchange while adhering to the slow-intermediate exchange condition mentioned in Eq. 1 (e.g. axial water ligands exchanging with bulk water). Despite the advantages of the larger allowed kex, the contrast produced by all CEST agents will be limited using when utilizing a 4 μT continuous wave saturation field. Larger contrast could therefore be realized using transmission coils capable of keeping the Specific Absorption Rate (SAR) produced by long > 8 μT pulses to within heating limits.
While we have concentrated on the performance of the IM-SHY scaffold using continuous wave saturation transfer preparation, the measurements included do not represent the performance of these compounds using pulsed exchange transfer methods such as two frequency irradiation [20], CERT [21], Frequency labeled EXchange transfer (FLEX)[22] or Variable Delay Multiple Pulse (VDMP) transfer [23]as these sequences are still under development at 3T. The use of a limited series of short selective high-power pulses has advantages for detecting rapidly exchanging compounds [7d] as recently demonstrated using FLEX on a paraCEST agent with a water kex of 19,000 Hz. That will be the subject of future studies. It is expected that the set of compounds described here will perform well using these new schemes.
Conclusion
In conclusion, a general scaffold for producing strong CEST contrast is described based on analysis of 44 analogs of 2-hydroxybenzoic acid. Steroelectronic effects of substitutions on the aromatic ring on CEST properties are summarized, with the phenol IM-SHY agents producing strong contrast from 4.8 ppm to 12 ppm. Compounds can be tuned with respect both to their pKa values and proton kex, the key determinants of CEST signal by enabling control of chemical shift and degree of water saturation, which impact on overall sensitivity. These probes were designed with multi-frequency CEST imaging in mind, with frequencies spanning a range that should allow discrimination between multiple agents within an image. As small molecules, we identify 42 and 43 as the highest sensitivity contrast agents through incorporating two IM-SHY protons with suitable kex and could be detected down to 200 μM for 42 at clinically useful field strengths.
Experimental Section
Phantom Preparation
Salicylic acid, phenol, 2-nitrophenol, 8-hydroxylquinoline N-oxide, 5-formy-salicylaldehyde, 2,5-dihydroxybenzoic, 5-amino-salicylic acid, 5-chlorosalicylic acid, 5-nitrosalicylic acid, 2,4-dihydroxybenzoic acid, 4-aminosalicylic acid, 3,5-dinitrosalicylic acid, 4-hydroxyisophthalic acid, 2-hydroxy-1-naphthoic acid, 2-hydroxy-6-methoxybenzoic acid, 2,6-dihydroxybenzoic acid, 3-methylsalicylic acid, 2,4-di-tert-butyl-6-hydroxybenzoic acid, 2,4-dichloro-6-hydroxybenzoic acid, 2,4-dibromo-6-hydroxybenzoic acid, 2-hydroxy-4,6-diiodobenzoic acid, 1-hydroxy-2-naphthoic acid, 8-hydroxyquinoline-7-carboxylic acid, 2,3-dihydroxybenzoic acid, 2-hydroxy-3-methoxybenzoic acid, 3-amino-2-hydroxybenzoic acid and 3-formyl-2-hydroxybenzoic acid were purchased from Sigma Aldrich (St. Louis, MO). 2-hydroxy-5-sulfobenzoic acid, 3-fluorosalicylic acid, 2,5-dihydroxyterephthalic acid and Pamoic acid were purchased from TCI America(Portland, OR). Salicylaldoxime, 2-(1H-tetrazol-5-yl) phenol and 3-methoxysalicylic acid were purchased from Alfa Aesar (Ward Hill, MA). Salicyluric acid was purchased from SynQuest Labs Inc. (Alachua FL). 4-Nitrosalicylic acid was purchased from Chem-Impex Inc.(Wood Dale, IL). 3-nitrosalicylic acid was purchased from Combi-Blocks Inc.(San Diego, CA). 2-Hydroxyisophthalic acid was purchased from Sinova Inc. (Bethesda, MD). 4,6-dihydroxyisophthalic acid was purchased from J&W Pharmlab LLC(Levittown, PA).
Samples were dissolved in 0.01 M phosphate-buffered saline (PBS) at concentrations from 0.1 mM to 10 mM, and titrated using high concentration HCl/NaOH to obtain physiologically relevant pH values ~7.4. The solutions were placed into 1 mm glass capillaries and assembled in a holder for CEST MR imaging.
Data acquisition
Phantom CEST experiments were performed on a Bruker Avance III 17.6 T vertical bore MR scanner using a 20 mm SAW type microimaging transmit/receive coil. The samples were kept at 37 °C during imaging. CEST images were acquired using a RARE (RARE factor = 32) sequence with a continuous wave (CW) saturation pulse length of 6 s and saturation field strengths of 1.0, 3.6, and 8.0 μT. The CEST Z-spectra were acquired by incrementing the saturation frequency every 0.25 ppm from -15.0 to 15.0 ppm. TR = 15 s, TE = 8 ms, matrix size = 64 × 32, slice thickness = 3 mm.
For compound 42, CEST experiments were also performed on a 3.0 T Philips Medical Systems human MRI scanner using a parallel transmist body coil for RF transmission and a 32-channel head coil for reception. The CEST images were acquired using a Turbo Spin echo sequence with a CW saturation pulse length of 3 s. The CEST Z-spectra were acquired by incrementing the saturation frequency every 0.38 ppm from -15.0 to 15.0 ppm. TR = 12 s, TE = 6.4 ms, matrix size = 64 × 58, slice thickness = 10 mm.
Post-processing
CEST contrast was quantified using MTRasym [24]
Prior to performing MTRasym, the effects from B0 variations were corrected for using the WASSR [25]method.
Acknowledgments
Funding was provided by NIH R01 EB012590, R01 EB015031, R01 EB015032, U54CA151838, S10RR025118, K25CA148901.
Dedicated to John A. Katzenellenbogen on the occasion of his 70th birthday.
References
- 1.Caravan P, Ellison JJ, McMurry TJ, Lauffer RB. Chemical Reviews. 1999;99:2293–2352. doi: 10.1021/cr980440x. [DOI] [PubMed] [Google Scholar]
- 2.a) Caravan P, Farrar CT, Frullano L, Uppal R. Contrast Media & Molecular Imaging. 2009;4:89–100. doi: 10.1002/cmmi.267. [DOI] [PMC free article] [PubMed] [Google Scholar]; b) Livramento JB, Helm L, Sour A, O’Neil C, Merbach AE, Toth E. Dalton Transactions. 2008:1195–1202. doi: 10.1039/b717390c. [DOI] [PubMed] [Google Scholar]
- 3.Pautler RG, Silva AC, Koretsky AP. Magnetic Resonance in Medicine. 1998;40:740–748. doi: 10.1002/mrm.1910400515. [DOI] [PubMed] [Google Scholar]
- 4.a) Laurent S, Forge D, Port M, Roch A, Robic C, Elst LV, Muller RN. Chemical Reviews. 2008;108:2064–2110. doi: 10.1021/cr068445e. [DOI] [PubMed] [Google Scholar]; b) Harisinghani MG, Barentsz J, Hahn PF, Deserno WM, Tabatabaei S, van de Kaa CH, de la Rosette J, Weissleder R. New England Journal of Medicine. 2003;348:2491–U2495. doi: 10.1056/NEJMoa022749. [DOI] [PubMed] [Google Scholar]
- 5.Ward KM, Aletras AH, Balaban RS. Journal of Magnetic Resonance. 2000;143:79–87. doi: 10.1006/jmre.1999.1956. [DOI] [PubMed] [Google Scholar]
- 6.a) Zhang S, Winter P, Wu K, Sherry AD. Journal of the American Chemical Society. 2001;123:1517–1518. doi: 10.1021/ja005820q. [DOI] [PubMed] [Google Scholar]; b) Aime S, Delli Castelli D, Terreno E. Angewandte Chemie. 2002;114:4510–4512. doi: 10.1002/1521-3773(20021115)41:22<4334::AID-ANIE4334>3.0.CO;2-1. [DOI] [PubMed] [Google Scholar]; c) Goffeney N, Bulte JW, Duyn J, Bryant LH, Jr, van Zijl PC. Journal of the American Chemical Society. 2001;123:8628–8629. doi: 10.1021/ja0158455. [DOI] [PubMed] [Google Scholar]
- 7.a) Hancu I, Dixon WT, Woods M, Vinogradov E, Sherry AD, Lenkinski RE. Acta Radiologica. 2010;51:910–923. doi: 10.3109/02841851.2010.502126. [DOI] [PMC free article] [PubMed] [Google Scholar]; b) Liu GS, Song XL, Chan KWY, McMahon MT. Nmr in Biomedicine. 2013;26:810–828. doi: 10.1002/nbm.2899. [DOI] [PMC free article] [PubMed] [Google Scholar]; c) Castelli DD, Terreno E, Longo D, Aime S. Nmr in Biomedicine. 2013;26:839–849. doi: 10.1002/nbm.2974. [DOI] [PubMed] [Google Scholar]; d) van Zijl PCM, Yadav NN. Magnetic Resonance in Medicine. 2011;65:927–948. doi: 10.1002/mrm.22761. [DOI] [PMC free article] [PubMed] [Google Scholar]
- 8.a) Schroeder L, Meldrum T, Smith M, Lowery TJ, Wemmer DE, Pines A. Physical Review Letters. 2008;100 doi: 10.1103/PhysRevLett.100.257603. [DOI] [PubMed] [Google Scholar]; b) Ward KM, Balaban RS. Magnetic resonance in medicine : official journal of the Society of Magnetic Resonance in Medicine / Society of Magnetic Resonance in Medicine. 2000;44:799–802. doi: 10.1002/1522-2594(200011)44:5<799::aid-mrm18>3.0.co;2-s. [DOI] [PubMed] [Google Scholar]; c) Schnurr M, Witte C, Schroder L. Physical Chemistry Chemical Physics. 2013;15:14178–14181. doi: 10.1039/c3cp51227d. [DOI] [PubMed] [Google Scholar]; d) Trokowski R, Ren JM, Kalman FK, Sherry AD. Angewandte Chemie-International Edition. 2005;44:6920–6923. doi: 10.1002/anie.200502173. [DOI] [PubMed] [Google Scholar]
- 9.a) Gilad AA, McMahon MT, Walczak P, Winnard PT, Jr, Raman V, van Laarhoven HW, Skoglund CM, Bulte JW, van Zijl PC. Nature Biotechnology. 2007;25:217–219. doi: 10.1038/nbt1277. [DOI] [PubMed] [Google Scholar]; b) Chan KW, Liu G, Song X, Kim H, Yu T, Arifin DR, Gilad AA, Hanes J, Walczak P, van Zijl PC, Bulte JW, McMahon MT. Nature materials. 2013;12:268–275. doi: 10.1038/nmat3525. [DOI] [PMC free article] [PubMed] [Google Scholar]; c) Chan KW, McMahon MT, Kato Y, Liu G, Bulte JW, Bhujwalla ZM, Artemov D, van Zijl PC. Magnetic resonance in medicine : official journal of the Society of Magnetic Resonance in Medicine / Society of Magnetic Resonance in Medicine. 2012;68:1764–1773. doi: 10.1002/mrm.24520. [DOI] [PMC free article] [PubMed] [Google Scholar]; d) Ling W, Regatte RR, Navon G, Jerschow A. Proceedings of the National Academy of Sciences of the United States of America. 2008;105:2266–2270. doi: 10.1073/pnas.0707666105. [DOI] [PMC free article] [PubMed] [Google Scholar]; e) Cai K, Haris M, Singh A, Kogan F, Greenberg JH, Hariharan H, Detre JA, Reddy R. Nature Medicine. 2012;18:302–306. doi: 10.1038/nm.2615. [DOI] [PMC free article] [PubMed] [Google Scholar]; f) Haris M, Cai K, Singh A, Hariharan H, Reddy R. NeuroImage. 2011;54:2079–2085. doi: 10.1016/j.neuroimage.2010.10.017. [DOI] [PMC free article] [PubMed] [Google Scholar]; g) Kogan F, Haris M, Singh A, Cai K, Debrosse C, Nanga RP, Hariharan H, Reddy R. Magnetic resonance in medicine : official journal of the Society of Magnetic Resonance in Medicine / Society of Magnetic Resonance in Medicine. 2013 [Google Scholar]; h) McMahon MT, Gilad AA, DeLiso MA, Cromer Berman SM, Bulte JWM, van Zijl PCM. Magnetic Resonance in Medicine. 2008;60:803–812. doi: 10.1002/mrm.21683. [DOI] [PMC free article] [PubMed] [Google Scholar]; i) Zhou J, Lal B, Wilson DA, Laterra J, van Zijl PC. Magnetic resonance in medicine : official journal of the Society of Magnetic Resonance in Medicine / Society of Magnetic Resonance in Medicine. 2003;50:1120–1126. doi: 10.1002/mrm.10651. [DOI] [PubMed] [Google Scholar]; j) Walker-Samuel S, Ramasawmy R, Torrealdea F, Rega M, Rajkumar V, Johnson SP, Richardson S, Goncalves M, Parkes HG, Arstad E, Thomas DL, Pedley RB, Lythgoe MF, Golay X. Nature Medicine. 2013 doi: 10.1038/nm.3252. [DOI] [PMC free article] [PubMed] [Google Scholar]; k) Liu GS, Liang YJ, Bar-Shir A, Chan KWY, Galpoththawela CS, Bernard SM, Tse T, Yadav NN, Walczak P, McMahon MT, Bulte JWM, van Zijl PCM, Gilad AA. Journal of the American Chemical Society. 2011;133:16326–16329. doi: 10.1021/ja204701x. [DOI] [PMC free article] [PubMed] [Google Scholar]
- 10.a) Mueller-Lutz A, Khalil N, Lanzman RS, Oeltzschner G, Pentang G, Jellus V, Schmitt B, Antoch G, Wittsack H-J. Proc Intl Soc Mag Reson Med. Salt Lake City UT: 2013. p. 4220. [Google Scholar]; b) Keupp J, Dimitrov I, Langereis S, Togao O, Takahashi M, Sherry AD. Proc Intl Soc Mag Reson Med. Montreal, Quebec, Canada: 2011. p. 828. [Google Scholar]
- 11.McMahon MT, Gilad AA, Zhou J, Sun PZ, Bulte JWM, van Zijl PCM. Magnetic Resonance in Medicine. 2006;55:836–847. doi: 10.1002/mrm.20818. [DOI] [PMC free article] [PubMed] [Google Scholar]
- 12.a) Aime S, Calabi L, Biondi L, De Miranda M, Ghelli S, Paleari L, Rebaudengo C, Terreno E. Magnetic Resonance in Medicine. 2005;53:830–834. doi: 10.1002/mrm.20441. [DOI] [PubMed] [Google Scholar]; b) Chen LQ, Howison CM, Jeffery JJ, Robey IF, Kuo PH, Pagel MD. Magnetic Resonance in Medicine. 2013:n/a–n/a. doi: 10.1002/mrm.25053. [DOI] [PMC free article] [PubMed] [Google Scholar]
- 13.Bar-Shir A, Liu GS, Liang YJ, Yadav NN, McMahon MT, Walczak P, Nimmagadda S, Pomper MG, Tallman KA, Greenberg MM, van Zijl PCM, Bulte JWM, Gilad AA. Journal of the American Chemical Society. 2013;135:1617–1624. doi: 10.1021/ja312353e. [DOI] [PMC free article] [PubMed] [Google Scholar]
- 14.Yang X, Song XL, Li YG, Liu GS, Banerjee SR, Pomper MG, McMahon MT. Angewandte Chemie-International Edition. 2013;52:8116–8119. doi: 10.1002/anie.201302764. [DOI] [PMC free article] [PubMed] [Google Scholar]
- 15.a) Brzezinski B, Zundel G. Journal of Magnetic Resonance (1969) 1982;48:361–366. [Google Scholar]; b) Abraham RJ, Mobli M. Magnetic Resonance in Chemistry. 2007;45:865–877. doi: 10.1002/mrc.2060. [DOI] [PubMed] [Google Scholar]
- 16.a) Cozzi PG. Chemical Society Reviews. 2004;33:410–421. doi: 10.1039/b307853c. [DOI] [PubMed] [Google Scholar]; b) Tokunaga M, Larrow JF, Kakiuchi F, Jacobsen EN. Science. 1997;277:936–938. doi: 10.1126/science.277.5328.936. [DOI] [PubMed] [Google Scholar]
- 17.Song X, Yang X, Ray Banerjee S, Pomper MG, McMahon MT. Contrast Media & Molecular Imaging. 2014 doi: 10.1002/cmmi.1597. [DOI] [PMC free article] [PubMed] [Google Scholar]
- 18.Saesmaa T, Tötterman AMT. Journal of Pharmaceutical and Biomedical Analysis. 1990;8:61–65. doi: 10.1016/0731-7085(90)80007-c. [DOI] [PubMed] [Google Scholar]
- 19.a) Terreno E, Castelli DD, Aime S. Contrast Media and Molecular Imaging. 2010;5:78–98. doi: 10.1002/cmmi.369. [DOI] [PubMed] [Google Scholar]; b) Yoo B, Pagel MD. Journal of the American Chemical Society. 2006;128:14032–14033. doi: 10.1021/ja063874f. [DOI] [PubMed] [Google Scholar]; c) Dorazio SJ, Tsitovich PB, Siters KE, Spernyak JA, Morrow JR. Journal of the American Chemical Society. 2011;133:14154–14156. doi: 10.1021/ja204297z. [DOI] [PMC free article] [PubMed] [Google Scholar]; d) Olatunde AO, Dorazio SJ, Spernyak JA, Morrow JR. Journal of the American Chemical Society. 2012;134:18503–18505. doi: 10.1021/ja307909x. [DOI] [PubMed] [Google Scholar]; e) Dorazio SJ, Olatunde AO, Spernyak JA, Morrow JR. Chemical Communications. 2013;49:10025–10027. doi: 10.1039/c3cc45000g. [DOI] [PMC free article] [PubMed] [Google Scholar]
- 20.Lee JS, Regatte RR, Jerschow A. Journal of Magnetic Resonance. 2012;215:56–63. doi: 10.1016/j.jmr.2011.12.012. [DOI] [PMC free article] [PubMed] [Google Scholar]
- 21.Zu ZL, Janve VA, Li K, Does MD, Gore JC, Gochberg DF. Magnetic Resonance in Medicine. 2012;68:711–719. doi: 10.1002/mrm.23276. [DOI] [PMC free article] [PubMed] [Google Scholar]
- 22.a) Yadav NN, Jones CK, Xu JD, Bar-Shir A, Gilad AA, McMahon MT, van Zijl PCM. Magnetic Resonance in Medicine. 2012;68:1048–1055. doi: 10.1002/mrm.24420. [DOI] [PMC free article] [PubMed] [Google Scholar]; b) Friedman JI, McMahon MT, Stivers JT, Van Zijl PCM. Journal of the American Chemical Society. 2010;132:1813. doi: 10.1021/ja909001q. [DOI] [PMC free article] [PubMed] [Google Scholar]
- 23.Xu J, Yadav NN, Bar-Shir A, Jones CK, Chan KWY, Zhang J, Walczak P, McMahon MT, van Zijl PCM. Magnetic Resonance in Medicine. 2013:n/a–n/a. doi: 10.1002/mrm.24850. [DOI] [PMC free article] [PubMed] [Google Scholar]
- 24.Guivel-Scharen V, Sinnwell T, Wolff SD, Balaban RS. Journal of Magnetic Resonance. 1998;133:36–45. doi: 10.1006/jmre.1998.1440. [DOI] [PubMed] [Google Scholar]
- 25.Kim M, Gillen J, Landman BA, Zhou J, van Zijl PC. Magnetic resonance in medicine : official journal of the Society of Magnetic Resonance in Medicine / Society of Magnetic Resonance in Medicine. 2009;61:1441–1450. doi: 10.1002/mrm.21873. [DOI] [PMC free article] [PubMed] [Google Scholar]


