Abstract
The availability of draft sequences for both the mouse and human genomes makes it possible, for the first time, to annotate whole mammalian genomes using comparative methods. TWINSCAN is a gene-prediction system that combines the methods of single-genome predictors like GENSCAN with information derived from genome comparison, thereby improving accuracy. Because TWINSCAN uses genomic sequence only, it is less biased toward highly and/or ubiquitously expressed genes than GENEWISE, GENOMESCAN, and other methods based on evidence derived from transcripts. We show that TWINSCAN improves gene prediction in human using intermediate products from various stages of the sequencing and analysis of the mouse genome, from low-redundancy, whole-genome shotgun reads to the draft assembly and the synteny map. TWINSCAN improves on the prior state of the art even when alignments from only 1X coverage of the mouse genome are available. Gene prediction accuracy improves steadily from 1X through 3X, more slowly from 3X to 4X, and relatively little thereafter. The assembly and the synteny map greatly speed the computations, however. Our human annotation using the mouse assembly is conservative, predicting only 25,622 genes, and appears to be one of the best de novo annotations of the human genome to date.
One important motivation for sequencing the mouse genome was to aid in the discovery of human genes. Before the sequencing of the mouse genome, analysis of cDNAs showed that orthologous mouse and human coding exons are typically conserved at 75%–95% nucleotide identity, with an average of 85% (Makalowski et al. 1996; Ansari-Lari et al. 1998; Makalowski and Boguski 1998). This is much higher than the average level of nucleotide conservation in noncoding regions. Intensive study of specific genomic regions showed that inspection of percent identity plots (PIPS) in combination with GENSCAN predictions (Burge and Karlin 1997), cDNA alignments, and other database searches were useful tools for expert genome annotation (Ansari-Lari et al. 1998; Schwartz et al. 2000). A relatively simple algorithm based on finding open reading frames with >50% identity was able to locate a missing exon in a low-expression gene (Jang et al. 1999), contributing to a sense of great optimism that mouse–human conservation would reveal both coding and regulatory regions (Bouck et al. 2000). Enthusiasm for this approach was motivated, in part, by the observation that genomic conservation of coding regions is likely to be evident even for genes that are expressed at low levels or under very specific conditions and hence cannot easily be identified by ESTs or cDNAs. (Jang et al. 1999).
These and other regional studies also noted the presence of variable but non-negligible levels of conservation in noncoding regions, typically covering about 50%–100% as much genomic sequence as the coding regions (Koop and Hood 1994; Koop et al. 1996; Oeltjen et al. 1997). Notably, long, highly conserved noncoding regions were found. For example, Ansari-Lari et al. (1998) found that 34 out of 174 gap-free aligned regions of at least 100 bp did not overlap an exon of any type, whether coding or noncoding. These findings are confirmed and extended by the analysis of the draft mouse genome sequence, which suggests that the amount of sequence under purifying selection is more than three times the amount of coding sequence (Mouse Genome Sequencing Consortium 2002). Nonetheless, the presence of conserved noncoding sequence did not greatly inhibit expert annotation in the context of all available evidence. As more mouse genome sequence became available, however, it became clear that the conserved noncoding sequence posed a great challenge for using mouse–human conservation in genome-wide automated gene prediction. A number of innovative and elegant algorithms were developed (Bafna and Huson 2000; Batzoglou et al. 2000), but it proved difficult to exceed the accuracy of GENSCAN (Burge and Karlin 1997)—one of the best single-genome gene predictors for mammalian genomes—on a genomic scale. This may be, in part, because the signal from mouse–human conservation in coding regions is obscured by noise from conservation in noncoding regions.
One of the first gene predictors to substantially exceed the performance of GENSCAN on a genomic scale by using mouse–human comparison was TWINSCAN (Korf et al. 2001). One key to this success was building on the Genscan model. TWINSCAN preserves GENSCAN's entire probability model for predicting genes using a single genome, with enhancements for exploiting mouse–human alignments. TWINSCAN's decisions about the most likely gene structures are influenced by these alignments, but this influence is generally smaller than that of intrinsic patterns in the sequence to be annotated. Other programs that were successful in exploiting mouse–human alignment to improve gene prediction also tended to invest a great deal of effort in modeling intrinsic patterns in the target genome. For example, SGP2 (Parra et al. 2003) is built on top of gene-id (Guigó et al. 1992; Parra et al. 2000), a well-known, single-genome predictor.
TWINSCAN begins with local alignments between a target genome and a database of sequences from an informant genome. These alignments are converted into a representation called conservation sequence, which assigns one of several symbols to each nucleotide of the target genome. The version of TWINSCAN described in this paper (TWINSCAN 1.1) uses three different symbols. Each nucleotide of the target genome is paired with one of these symbols if the highest-scoring local alignment overlapping that nucleotide contains a match, another symbol if the highest-scoring alignment contains a gap or mismatch, and a third symbol if there is no overlapping alignment.
TWINSCAN, SGP2, and SLAM (Pachter et al. 2002) were all used in the analysis of the draft sequence of the mouse genome (Mouse Genome Sequencing Consortium 2002). Like TWINSCAN, SGP2 uses the best local alignment at each nucleotide of the target genome. TWINSCAN uses nucleotide alignments (BLASTN, http://blast.wustl.edu) and has specific models for how alignments modify the scores of coding regions, UTRs, splice sites, and translation initiation and termination signals. SGP2, in contrast, uses translated alignments (TBLASTX, http://blast.wustl.edu) to modify the scores of potential coding regions only. SLAM is based on a generalized pair Hidden Markov Model (HMM) that simultaneously aligns the two genomes and predicts gene structures using a joint probability model. The TWINSCAN results reported here use a new parameter set that substantially improves accuracy as compared with the parameters used in the mouse genome analysis (Guigó et al. 2002; Mouse Genome Sequencing Consortium 2002).
Korf et al. (2001) demonstrated the effectiveness of TWINSCAN for annotating finished mouse sequence by aligning it to draft and finished human BAC clones. The draft sequence of the mouse genome, however, was produced by a whole-genome shotgun strategy, so the human genome cannot be annotated by aligning clone-based mouse sequences. In this paper, we report on the applicability of TWINSCAN to annotating a large target genome (human) using intermediate products from various stages of the sequencing and analysis of an informant genome (mouse) by a whole-genome shotgun strategy. In particular, we assess the utility of whole-genome shotgun reads at various levels of redundancy and compare this with the utility of the draft genome assembly as well as the map of conserved syntenies.
RESULTS
To evaluate the performance of TWINSCAN, we compared its predictions on the human genome with an alignment of the RefSeq mRNAs (Pruitt and Maglott 2001; Kent et al. 2002). RefSeq alignments with obvious errors were removed leaving 14,060 transcripts at 12,516 nonoverlapping genomic loci (see Methods). Predicted genes were counted as correct if they exactly matched the coding region of one RefSeq transcript at a given locus, and predicted exons were counted as correct if they exactly matched a RefSeq coding exon. Sensitivity (number predicted correctly over total number annotated by RefSeq) and specificity (number predicted correctly over total number predicted) were calculated for exact prediction of genes, exons, and coding nucleotides. Sensitivity as compared with RefSeq can be considered a reasonable estimate of sensitivity for all genes, to the extent that RefSeq genes are a representative sample of all genes. Specificity as compared with RefSeq, however, will count all correct predictions for which there is no RefSeq transcript as errors. Because the RefSeq set contains transcripts for less than half of all human genes, based on current estimates, specificity is systematically underestimated. With this caveat, however, RefSeq specificity can still be used to compare different prediction sets (this measure is sometimes called relative enrichment of the prediction set, but we will use the term specificity).
Effects of Mouse Shotgun Read Redundancy, Assembly, and Synteny Analysis
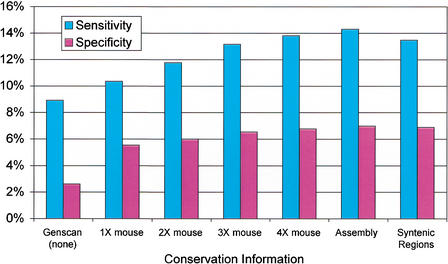
The results show that TWINSCAN performs relatively well on the human genome using alignments of low-redundancy, whole-genome shotgun reads from mouse (Table 1, Fig. 1). Even alignments of an estimated 1X coverage of mouse (see Methods) produced better results than GENSCAN, a comparable gene prediction system that does not exploit genomic conservation. As the number of mouse reads in the alignment database increases, TWINSCAN's performance also increases. The improvement is steady up to 3X coverage, but slows thereafter. Alignments of the final assembly of the draft mouse genome, based on ∼7X coverage (Mouse Genome Sequencing Consortium 2002), yielded only slightly greater accuracy than the 4X alignments. Restricting alignments to regions of conserved synteny did not improve accuracy.
Table 1.
Accuracy With Respect to RefSeq as a Function of Mouse Genome Sequence Used
| GENSCAN (none) | 1× mouse | 2× mouse | 3× mouse | 4× mouse | Assembly | Syntenic regions | |
| Exact gene sensitivity | 8.91 | 10.34 | 11.76 | 13.16 | 13.81 | 14.31 | 13.47 |
| Exact gene specificity | 2.62 | 5.55 | 6.02 | 6.54 | 6.78 | 6.99 | 6.89 |
| Exact exon sensitivity | 68.48 | 64.99 | 68.50 | 69.54 | 70.27 | 71.21 | 70.80 |
| Exact exon specificity | 24.45 | 38.72 | 38.57 | 40.33 | 40.57 | 40.61 | 39.97 |
| Nucleotide sensitivity | 86.29 | 79.85 | 81.91 | 81.92 | 82.30 | 82.82 | 83.39 |
| Nucleotide specificity | 29.57 | 42.35 | 42.31 | 43.88 | 44.09 | 44.14 | 42.98 |
Figure 1.
Exact gene accuracy with respect to aligned RefSeq transcripts, as a function of mouse genome sequence aligned.
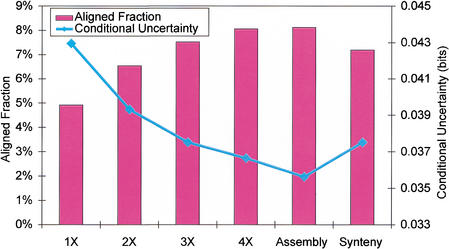
TWINSCAN's results directly mirror the characteristics of the alignments themselves. Specifically, the fraction of the human genome covered by mouse alignments rose steadily up to 3X, more slowly from 3X to 4X, and very little from 4X to the assembly (Fig. 2), as expected (Lander and Waterman 1988). The coverage of the genome declined slightly when alignments were restricted to regions of conserved synteny, also as expected. More telling is the conditional uncertainty of the RefSeq annotation, given the alignment (see Methods), an information-theoretic measure reflecting how reliably patterns in the conservation sequence indicate coding regions. Conditional information of zero would mean that the coding status of each nucleotide could be computed exactly from the conservation symbol aligned to it. The marginal information content of the RefSeq annotation (i.e., when no conservation sequence is given) is 0.053 bits per nucleotide, reflecting the fact that only 0.62% of the nucleotides are annotated as coding. Therefore, one could correctly determine the coding status of most nucleotides by simply guessing that all are noncoding. As shotgun coverage increases, the conditional uncertainty (given the conservation sequence) declines rapidly up to 3X and more slowly from 3X to the draft assembly (Fig. 2). Conditional uncertainty rises when alignments are constrained to regions of conserved synteny. These observations demonstrate that the effects of mouse genome coverage, assembly, and synteny map on TWINSCAN's performance do not result from complex interactions particular to TWINSCAN, but rather from characteristics of the alignments themselves.
Figure 2.
Characteristics of alignments of various mouse sequences to the human genome. Bars indicate the percentage of the human genome covered using our alignment procedure. Diamonds indicate the conditional uncertainty of the annotation given the alignments. Lower conditional uncertainty corresponds to more informative alignments.
Although moving from 4X shotgun coverage to assembled sequence and then to syntenic sequence has limited effects on accuracy, it dramatically speeds the computation. Aligning each 1X mouse-reads database (with repetitive and low-complexity sequence removed) to the human genome with BLASTN requires ∼1,700 CPU hours on a cluster of current high-end commodity processors (2 Ghz x 86 processors with 1GB RAM per processor; see Methods for BLAST parameters). Moving from 4X whole-genome shotgun reads to the draft assembly reduces alignment time from 6,868 CPU hours to 2,068 CPU hours. Aligning only blocks of conserved synteny reduces alignment time to only 35 CPU hours.
Annotation of the Human Genome Using the Assembled Draft Sequence of the Mouse Genome
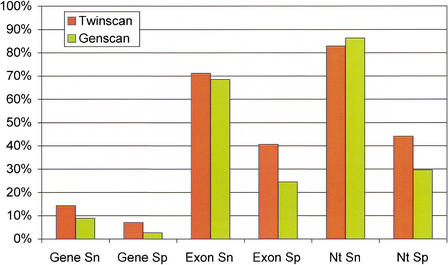
TWINSCAN's human annotation using the assembled sequence of the mouse genome represents a notable improvement in de novo annotation of the human genome. In particular, TWINSCAN is both more sensitive and more specific than GENSCAN for predicting exact coding regions of exons and RefSeq mRNAs (Fig. 3). GENSCAN is slightly more sensitive for detecting coding nucleotides in RefSeq annotation, but this comes at the cost of predicting ∼50% more coding nucleotides than TWINSCAN. For nucleotides and exons, the primary benefit of using TWINSCAN is greater specificity. TWINSCAN predicts one aligned RefSeq perfectly at 1,791 loci, including every coding nucleotide and splice site as well as the start and stop sites. TWINSCAN predicts all splice junctions in coding sequence correctly at 2,126 loci (17.0%) and both the start and stop codons correctly at 3,111 loci (24.9%).
Figure 3.
Accuracy of GENSCAN and TWINSCAN by the exact gene, exact exon, and coding nucleotide measures. TWINSCAN predictions use alignments from the draft mouse assembly.
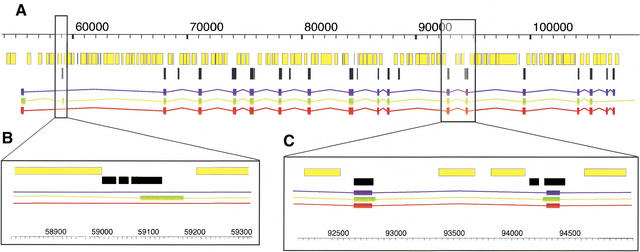
Close examination of individual genes provides additional insight into how TWINSCAN improves exact gene prediction. For example, TWINSCAN predicts the transcript shown in Figure 4 perfectly, whereas GENSCAN calls an extra exon, misses two exons, miscalls a number of splice sites, and continues the prediction beyond the end of the coding region. TWINSCAN does not insert the extra exon that GENSCAN does, in part because the mouse alignment (black) stops in the middle of this predicted exon (Fig. 4B). Similarly, two of GENSCAN's miscalled splice sites are not covered by mouse alignments, whereas TWINSCAN correctly predicts splice sites that are covered by mouse alignments (Fig. 4C). Figure 4 also highlights the fact that TWINSCAN does not predict coding exons in every aligned region, nor does every TWINSCAN coding exon overlap an aligned region.
Figure 4.
A detailed view of a TWINSCAN prediction (red), a GENSCAN prediction (green), and an aligned RefSeq transcript (blue). Masked repetitive and low-complexity regions (yellow) and mouse alignments (black) are indicated. (A) Complete gene prediction at the KIAA1630 gene (NM_018706) from Homo sapiens 10p14. Note that the presence of conservation is neither a necessary (e.g., the first exon), nor a sufficient (e.g., the first alignment block condition for TWINSCAN to predict an exon. (B) A magnified region around the second exon predicted by GENSCAN. TWINSCAN correctly omits this exon because the conserved region ends within it. (C) A magnified region around the 11th and 12th RefSeq exons. TWINSCAN correctly predicts both splice sites because they are within the aligned regions. These images were produced with AceDB (http://www.acedb.org/).
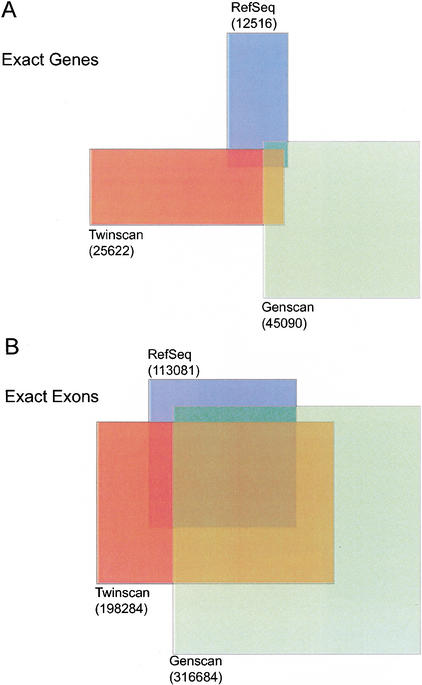
TWINSCAN produces a conservative annotation of the human genome that contains 25,622 genes comprising 198,284 exons and 34,290,737 coding nucleotides (1.15% coding). This gene number is consistent with the low range of recent estimates for total mammalian gene count (Mouse Genome Sequencing Consortium 2002) and remarkably close to the latest ExoFish (Roest Crollius et al. 2000) estimate of 25,925 human genes (Roest Crollius, pers. comm.). In comparison, the Ensembl gene build (Hubbard et al. 2002), an annotation system requiring evidence of transcription in some organism for every exon, predicts 22,980 human genes comprising 182,922 unique exons (Release 8.30a.1, http://www.ensembl.org/Homo_sapiens/). NCBI's less conservative annotation starts with 52,842 genes predicted by GenomeScan (Yeh et al. 2001) and culls these to 34,539 using additional evidence (http://www.ncbi.nlm.nih.gov/genome/guide/human/HsStats.html). Except for TWINSCAN, all gene counts described above include ∼200–300 genes on the Y chromosome. The number of genes and exons in the TWINSCAN, GENSCAN, and RefSeq annotations (excluding chromosome Y) and the proportions that match exactly can be visualized as a Venn diagram (Fig. 5). Note that many of the genes and exons that do not match exactly are highly similar.
Figure 5.
Relationships among the genes and exons annotated by TWINSCAN, GENSCAN, and aligned RefSeq transcripts. (A) Number of genes annotated by RefSeq, TWINSCAN, and GENSCAN, and number of exact matches among them. RefSeq and TWINSCAN contain 1,791 identical genes, RefSeq and GENSCAN contain 1,115, TWINSCAN and GENSCAN contain 2,809, and the intersection of all three sets contains 670. (B) Number of unique coding exons annotated by RefSeq, TWINSCAN, and GENSCAN, and number of exact matches among them. RefSeq and TWINSCAN contain 80,530 identical exons, RefSeq and GENSCAN contain 77,442, TWINSCAN and GENSCAN contain 134,507, and the intersection of all three sets contains 67,320.
TWINSCAN annotation can be explored further on the UCSC genome browser (http://genome.ucsc.edu/cgi-bin/hgGateway?db=hg12) and TWINSCAN can be run over the Web at http://genes.cs.wustl.edu.
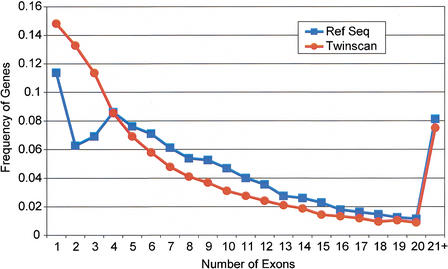
Going beyond accuracy measures, the characteristics of the genes TWINSCAN predicts are a reasonable match to those of the aligned RefSeqs. Not only is the mean number of exons per predicted gene (7.74) in the same range as the RefSeqs (9.07), but the distributions are also reasonably well matched (Fig. 6). Perhaps surprisingly, the distribution for the aligned RefSeqs dips markedly at two and three coding exons before rising again at four. Aside from this dip, the two distributions are similar, with the mode at one exon and a steady decline as the number of exons increases. Beyond six exons, the curves tend to converge, except that TWINSCAN predicts fewer transcripts with an extremely large number of exons. This may be attributable to the fact that TWINSCAN was run on 1-Mb segments of the genome, which will have a greater tendency to split genes with very long genomic extent.
Figure 6.
Comparison of the distribution of coding exons per transcript in the TWINSCAN predictions and RefSeq annotations. The last data point includes all transcripts containing >20 coding exons.
Variation in TWINSCAN Performance With GC Percentage
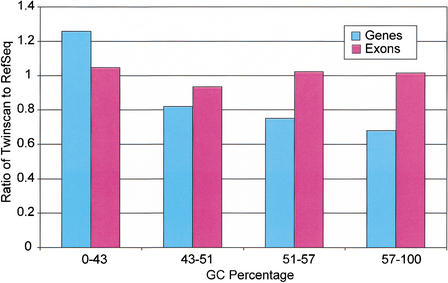
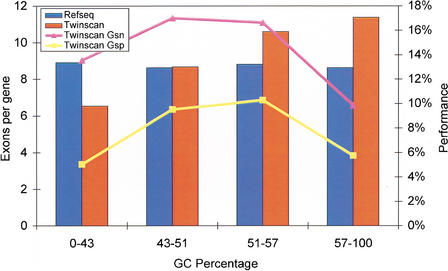
TWINSCAN uses different parameter sets depending on the GC percentage of the N-masked input sequence. The four divisions are 0%–43%, 43%–51%, 51%–57%, and 57%–100%. Most 1-Mb segments of the human genome fall into the two lowest divisions (73.4% and 21.4%, respectively). The fraction of TWINSCAN-predicted exons at each GC level is a good match to the fraction of RefSeq exons at that level (ratios vary from 0.94 to 1.05; Fig. 7). TWINSCAN, however, tends to predict genes with too few exons in the lowest division, and genes with too many exons in the highest division. This results in worse performance on exact gene prediction in these two divisions, with the greatest impact on whole-genome performance coming from the lowest division (Fig. 8).
Figure 7.
Fraction of TWINSCAN exons (genes) in each GC bin divided by the fraction of RefSeq exons (genes) in the same bin. Bars above 1.0 represent over-prediction and those below 1.0 represent under-prediction. TWINSCAN tends to predict genes with fewer exons in areas of lower GC content.
Figure 8.
Effect of GC bin on exact gene prediction. Bars indicate the number of exons per gene in the TWINSCAN predictions and the RefSeq annotations in each GC bin. Points indicate TWINSCAN's sensitivity and specificity for exact gene prediction in each GC bin. Exact gene accuracy is higher when TWINSCAN's predictions have 9–10 exons per gene.
DISCUSSION
We have presented the first detailed, published description of an annotation of the entire human genome using alignments from the draft sequence of the mouse genome. Our analysis shows that the mouse genome can be used to improve de novo gene-structure prediction on the human genome. The state of the art in exact human gene prediction remains poor in absolute terms, reflecting the inherent difficulty of the problem. The small fraction of RefSeqs that are predicted perfectly may also reflect the limited representation of human transcripts in RefSeq and occasional errors in the RefSeqs themselves and/or their alignment (J. Kent, pers. comm.) that escaped our automated screen (see Methods). Nonetheless, TWINSCAN represents a tremendous relative improvement in exact gene prediction. The progress it represents is real, reproducible under various conditions, and significant in biological applications (Korf et al. 2001; Guigó et al. 2002; Toyoda et al. 2002). Experimental verification by RT-PCR and direct product sequencing has shown that comparative gene prediction methods, including TWINSCAN, can identify genes not found by Ensembl (a transcript-based automated annotation method). Furthermore, these genes tend to have relatively tissue-restricted expression patterns (Guigó et al. 2002), validating the concept of genome comparison as a method to identify genes that are under-represented in cDNA libraries.
One of the great strengths of the TWINSCAN approach is its ability to improve gene-structure prediction using alignments of low-redundancy whole-genome shotgun reads. This is possible because TWINSCAN uses local alignments and makes no assumption that aligned regions are orthologous or that they have conserved exonic structure. We found that unassembled 4X mouse shotgun reads are almost as useful for TWINSCAN as the full draft assembly. TWINSCAN's ability to exploit low-redundancy shotgun reads reflects the fact that BLASTN (as we have run it) aligns truly related (though not necessarily orthologous) sequences quite specifically. Although the long, contiguous sequences of the mouse assembly can, in theory, be aligned to their true human orthologs more reliably than individual reads, this provides limited practical benefit for TWINSCAN.
Contrary to our expectations, aligning regions of conserved synteny in the same way that we aligned the entire genomes gave slightly less accurate predictions. We believe this is due, in part, to the fact that TWINSCAN can assign negative scores to gene features that have only low-quality alignments from outside the regions of conserved synteny, helping to avoid false positive predictions. Therefore, the elimination of low-quality alignments from outside regions of conserved synteny can, apparently, hurt performance. Additionally, TWINSCAN assigns positive scores to gene features that have high-quality alignments from paralogous genes outside regions of conserved synteny. This sometimes helps identify real genes that would otherwise have been missed. These observations apply, however, only to alignments performed with the same database preparation and parameter set that we found most practical for whole-genome alignment. If we omit masking of low-complexity sequence in the syntenic mouse region, we obtain accuracy similar to that obtained from the entire mouse assembly. Therefore, aligning syntenic regions using more sensitive procedures than we can apply to whole genomes is likely to yield some accuracy improvement.
Direct comparison of systems for annotating the whole human genome is not a simple matter. Complications arise from the lack of an independent gold standard for evaluation, regular changes to the sequence, active development of the annotation systems, sensitivity of results to details of repeat masking and segmenting the sequence, and the huge computational resources required for running many systems. To evaluate TWINSCAN, we compared its predictions with genome annotations derived from RefSeq, a manually curated collection of mRNA sequences provided by NCBI. Using RefSeq as a standard, however, requires that the mRNA sequences be computationally unspliced and mapped back to the genome. This process is subject to error because of the substantial portion of the human genome that is currently unfinished, the inherent uncertainty of unsplicing, and occasional errors in RefSeq. Nonetheless, we believe that aligned RefSeqs are the best currently available standard for evaluation of whole-genome annotation systems. We were able to compare the performance of TWINSCAN to that of GENSCAN because (1) neither program uses RefSeq as an input; (2) GENSCAN is run in a well-thought-out way on every new release of the human genome; and (3) GENSCAN is no longer under development.
Other systems we would have liked to compare TWINSCAN with either have not been run on recent versions of the human genome or use known transcripts as an input. For example, we are not aware of any whole-genome annotations using either CEM (Bafna and Huson 2000) or Rosetta (Batzoglou et al. 2000). At the time of submission, SLAM (Pachter et al. 2002) and SGP2 (Parra et al. 2003) have only been run on earlier, more fragmentary drafts of the human genome. Systems such as GenomeScan (Yeh et al. 2001), the starting point for the NCBI annotation, and GeneWise (Birney and Durbin 2000), the starting point for the Ensembl gene build (Hubbard et al. 2002), use known transcripts as an input. The performance of these systems on known genes cannot be extrapolated to their performance on novel genes—known genes should be easier than novel genes for these systems, because known genes are provided as input.
We did a three-way comparison of TWINSCAN, Ensembl, and RefSeq to describe our predictions further, with no implications for relative accuracy outside the RefSeq set. We expected that Ensembl would get nearly all RefSeq exons exactly right. In our evaluation, Ensembl predicted 82% of coding exons in our aligned RefSeq set exactly, whereas TWINSCAN (with no prior knowledge of RefSeq) got 71% exactly right. This surprising observation may arise from the uncertainties in RefSeq alignment mentioned above. When the match criterion is relaxed to 80% mutual overlap, Ensembl overlaps 95% of RefSeq exons, whereas TWINSCAN overlaps 77%. Excluding all exons that overlap RefSeq, TWINSCAN overlaps 65% of Ensembl exons, whereas Ensembl overlaps 43% of TWINSCAN exons. Therefore, the two annotations are in good agreement, but both predict exons not predicted by the other.
For annotation consumers, we recommend looking at a series of annotation sets. Despite the uncertainties involved, the aligned RefSeqs represent the most conservative and reliable whole-genome annotation available. However, they include only about half of all human genes, based on current estimates. Ensembl provides a more comprehensive, although still conservative annotation, with a gene count equivalent to about four-fifths of the estimated total. TWINSCAN is more comprehensive still, insofar as its gene count is in the range of the estimated total, and its sensitivity (extrapolated from RefSeq) is fairly high. Beyond TWINSCAN, informal analyses suggest that SGP2 may be slightly more sensitive and less specific. Finally, with a gene count in excess of current estimates, the NCBI annotation may be still more sensitive and less specific. Based on the analysis presented here, we do not see any reason for most consumers to consult GENSCAN or other single-genome, de novo methods for mammalian gene prediction.
In this study, we found that significant gains in the accuracy of human gene prediction can be obtained using low- to moderate-redundancy whole-genome shotgun sequence from the mouse. Our experience with other organisms suggests that low-redundancy sequence is even more useful when the genomes are more closely related than human and mouse. For example, in preliminary experiments TWINSCAN has shown substantial performance benefits for gene prediction in Arabidopsis thaliana using less than 1X shotgun coverage of Brassica oleracea (estimated divergence 20 Mya) and in Cryptococcus neoformans strain JEC21 using about 1.5X coverage of strain H99. These observations may be influenced by several other variables, including absolute and relative genome size, but we believe that evolutionary distance is the most significant variable. Therefore, a possible cost-effective route to further improvement in human gene-structure prediction would be to obtain ∼3–4X coverage of a more closely related organism, such as the gibbon.
The longer contiguous sequences that can be obtained from deeper coverage and assembly are likely to be valuable for identification of conserved intron–exon structure. TWINSCAN does not make explicit use of conserved intron–exon structure, in part because it uses purely local alignments. Nonetheless, we have shown in other work that this structure does have value for discriminating between gene predictions that are experimentally verifiable and those that are not (Guigó et al. 2002). Other gene prediction algorithms have integrated the signal from conserved intron–exon structure directly, rather than using it as a post-processing step (e.g., Meyer and Durbin 2002; Pachter et al. 2002). Successfully combining the strengths of these programs with the robustness and high-throughput capability of TWINSCAN may lead to a breakthrough in mammalian gene prediction.
METHODS
Sequences
All predictions were made on NCBI Build 30 (June 2002 data freeze) of the human genome sequence (http://genome.ucsc.edu/goldenPath/28jun2002/chromosomes/chr*.fa.gz). Chromosome Y was excluded from TWINSCAN annotation because the draft sequence of the mouse genome does not include chromosome Y. The sequences were divided into nonoverlapping 1-Mb segments for both the BLAST and TWINSCAN portions of the analysis. Mouse genomic sequences were used as the informant database. We downloaded the February 1, 2002, data freeze of the mouse trace database from http://ftp.ncbi.nih.gov/pub/TraceDB/mus_musculus/ClipReads/FINAL/SEQ/Mm.WGS*.fa.dr.mfa.gz and constructed 1X BLAST databases as described below. The downloaded reads had been RepeatMasked, but not quality clipped. We downloaded the MGSC v3 assembly of the mouse genome from http://genome.ucsc.edu/goldenPath/mmFeb2002/chromosomes/chr*.fa.gz.
Fold Coverage Calculations
The mouse genome assembly is based on ∼7X coverage of the mouse genome, culled from an original set of 40 million reads. Our estimates of fold coverage are calculated to be comparable with the description of the assembly as using 7X. We divided the 40 million reads used in the assembly into seven groups of approximately equal size. The reads are provided by the NCBI in 102 chronological files containing 400,000 reads each. We divided these files randomly into seven groups. Four groups contained 15 files (6,000,000 reads) and three groups contained 14 files (5,600,000 reads). These groups are each equivalent to ∼1X of quality-clipped reads.
Synteny Map
We used the 500K-cutoff synteny map produced by Michael Kamal at the Whitehead Genome Research Institute. The map itself and the procedure by which it was produced are described at http://www-genome.wi.mit.edu/mouse/synteny/index.html. A BLAST database was constructed for each mouse region mapped to a contiguous region of human, as described below. The databases therefore varied in size, as did the effective resolution at which alignments were constrained to syntenic regions. Human regions not mapped to any mouse region were considered to be unaligned.
BLAST
Downloaded sequences contained lowercase masking produced by RepeatMasker (Smit and Green, http://ftp.genome.Washington.edu/RM/RepeatMasker.html). We converted lowercase letters to N, N-masked remaining low-complexity sequence using nseg (Wootton and Federhen 1996) with default parameters, and removed all strings of 15 or more consecutive Ns to speed processing. The resulting 1X BLAST databases and the assembly BLAST database were closely matched in size. All BLAST jobs were run using WUBLAST 2.0, 15-Apr-2002, running under x86 Linux. The analysis reported here uses the following BLAST parameters: M = 1, N = −1, Q = 5, R = 1, Z = 3,000,000,000, Y = 3,000,000,000, B = 10,000, V = 100, W = 10, X = 30, S = 30, S2 = 30, and gapS2 = 30. The seg and dust filter options were used.
Sequence Annotation
We used the aligned RefSeq mRNA set downloaded from the UCSC browser site (http://genome.ucsc.edu/goldenPath/28jun2002/database/refGene.txt.gz) as the basis on which to compare our predictions. The downloaded RefSeq set contained 16,561 transcripts. Of these, 339 that could not be located on a specific chromosome and 60 with no coding exons were removed. An additional 2,102 transcripts were removed for one of the following reasons: Transcript aligned to Y chromosome, coding region was identical to that of another transcript included in the annotation, length was not evenly divisible by three, transcript did not translate on NCBI build 30, initial codon was not ATG, and/or stop codon was not TAA, TGA, or TAG. The remaining 14,060 transcripts from 12,516 loci were used as the reference set. The GENSCAN predictions described here were downloaded from the UCSC browser (http://genome.ucsc.edu/goldenPath/28jun2002/database/genscan.txt.gz).
Conditional Uncertainty Calculation
Let C be a random variable representing the status of a given nucleotide in the genome as coding (c) or noncoding (n). Let A be a random variable representing the conservation status of the nucleotide as aligned to an identical nucleotide in the highest-scoring overlapping alignment (m), aligned to gap or a mismatch (g), or unaligned (u). Then the conditional uncertainty of the annotation, given the conservation sequence, is calculated as:
 |
(Ash 1965). We used maximum likelihood estimates of these probabilities based on the RefSeq annotation of the human genome and conservation sequence generated from mouse alignments. Conditional uncertainty given the aligned conservation symbol and the previous five symbols, corresponding to the 5th-order Markov chain used in TWINSCAN, gives lower absolute numbers but the same trends as the 0th-order calculation reported above.
TWINSCAN
We used TWINSCAN version 1.1, together with target genome parameters we identify as human–08-16-02. This parameter set is significantly different than the one used in our analyses published previously (Korf et al. 2001; Guigó et al. 2002; Mouse Genome Sequencing Consortium 2002).
Nonprofit institutions may obtain TWINSCAN executables and source code from the authors at no cost. Contact twinscan@cse.wustl.edu for more information or visit http://genes.cs.wustl.edu. For-profit institutions may obtain TWINSCAN through Washington University's Center for Technology Management.
Comparison of Annotation Sets
The annotation sets produced by TWINSCAN, GENSCAN, and the aligned RefSeqs were compared using the Eval software package (Keibler, unpubl.; http://genes.cs.wustl.edu/eval/). Gene-level sensitivity is the fraction of genes in which at least one transcript was correctly predicted. For exon-level and nucleotide statistics, we have not double counted those exons and nucleotides that appear in more than one transcript.
WEB SITE REFERENCES
http://www.acedb.org/; ACEDB.
http://blast.wustl.edu; Gish, W., WU BLAST Archives.
http://ftp.genome.Washington.edu/RM/RepeatMasker.html; Smit, A.F.A. and Green, P., RepeatMasker.
http://genes.cs.wustl.edu; TWINSCAN.
http://genes.cs.wustl.edu/eval/; Eval software package for comparison of annotations.
http://genome.ucsc.edu/goldenPath/28jun2002/chromosomes/chr*.fa.gz; NCBI30 Human Sequence (8–1–02).
http://genome.ucsc.edu/goldenPath/mmFeb2002/chromosomes/chr*.fa.gz; MGSCv3 Assembled Mouse Sequence (4–24–02).
http://genome.ucsc.edu/goldenPath/28jun2002/database/refGene.txt.gz; RefSeqs (9–13–02).
http://genome.ucsc.edu/goldenPath/28jun2002/database/genscan.txt.gz; GENSCAN annotation (8-20-02).
http://ftp.ncbi.nih.gov/pub/TraceDB/mus_musculus/ClipReads/FINAL/SEQ/Mm.WGS*.fa.dr.mfa.gz; Mouse Trace Files (Feb. 1, 2002 freeze).
http://www.ensembl.org/Homo_sapiens/; Ensembl human annotation (Release 8.30a.1).
http://www.genome.wi.mit.edu/mouse/synteny/index.html; Mouse–human synteny map.
http://www.ncbi.nlm.nih.gov/genome/guide/human/HsStats.html; Humane Genome: Current Statistics—Build 30.
http://genome.ucsc.edu/cgi-bin/hgGateway?db=hg12; UCSC Genome Browser, Human Build 30.
Acknowledgments
We are grateful to the Mouse Genome Sequencing Consortium for sequencing the mouse genome and making it publicly available; and to the Mouse Genome Analysis group, especially Ewan Birney, Roderic Guigó, Manolis Dermitzakis, Jim Kent, and Webb Miller, for helpful discussions. We thank Mark Bober for maintaining our compute cluster; Deanna Church for making the mouse reads available on short notice; Michael Kamal and the Whitehead Institute for providing the global synteny map; and Min Wang for the conditional uncertainty calculations. P.F. is supported by a Whitaker Foundation Graduate Fellowship and I.K. is supported by a grant from the National Human Genome Research Institute (K22 HG-0064-01). The remainder of this work was supported by grants HG02278-01A2 from the National Human Genome Research Institute and DBI-0091270 from the National Science Foundation to M.R.B.
The publication costs of this article were defrayed in part by payment of page charges. This article must therefore be hereby marked “advertisement” in accordance with 18 USC section 1734 solely to indicate this fact.
E-MAIL brent@cse.wustl.edu; FAX (314) 935-7302.
Article and publication are at http://www.genome.org/cgi/doi/10.1101/gr.830003.
REFERENCES
- 1.Ansari-Lari M.A., Oeltjen, J.C., Schwartz, S., Zhang, Z., Muzny, D.M., Lu, J., Gorrell, J.H., Chinault, A.C., Belmont, J.W., Miller, W., et al. 1998. Comparative sequence analysis of a gene-rich cluster at human chromosome 12p13 and its syntenic region in mouse chromosome 6. Genome Res. 8: 29-40. [PubMed] [Google Scholar]
- 2.Ash R., 1965. Information theory. Wiley, New York.
- 3.Bafna V. and Huson, D.H. 2000. The conserved exon method for gene finding. Proc. Int. Conf. Intell. Syst. Mol. Biol. 8: 3-12. [PubMed] [Google Scholar]
- 4.Batzoglou S., Pachter, L., Mesirov, J.P., Berger, B., and Lander, E.S. 2000. Human and mouse gene structure: Comparative analysis and application to exon prediction. Genome Res. 10: 950-958. [DOI] [PMC free article] [PubMed] [Google Scholar]
- 5.Birney E. and Durbin, R. 2000. Using GeneWise in the Drosophila annotation experiment. Genome Res. 10: 547-548. [DOI] [PMC free article] [PubMed] [Google Scholar]
- 6.Bouck J.B., Metzker, M.L., and Gibbs, R.A. 2000. Shotgun sample sequence comparisons between mouse and human genomes. Nat. Genet. 25: 31-33. [DOI] [PubMed] [Google Scholar]
- 7.Burge C. and Karlin, S. 1997. Prediction of complete gene structures in human genomic DNA. J. Mol. Biol. 268: 78-94. [DOI] [PubMed] [Google Scholar]
- 8.Guigó R., Knudsen, S., Drake, N., and Smith, T. 1992. Prediction of gene structure. J. Mol. Biol. 226: 141-157. [DOI] [PubMed] [Google Scholar]
- 9.Guigó, R., Dermitzakis, E.T., Agarwal, P., Ponting, C., Parra, G., Reymond, A., Abril, J.F., Keibler, E., Lyle, R., Ucla, C., et al. 2003. Comparison of mouse and human genomes followed by experimental verification yields an estimated 1,019 additional genes. Proc. Natl. Acad. Sci. (in press). [DOI] [PMC free article] [PubMed]
- 10.Hubbard T., Barker, D., Birney, E., Cameron, G., Chen, Y., Clark, L., Cox, T., Cuff, J., Curwen, V., Down, T., et al. 2002. The Ensembl genome database project. Nucleic Acids Res. 30: 38-41. [DOI] [PMC free article] [PubMed] [Google Scholar]
- 11.Jang W., Hua, A., Spilson, S.V., Miller, W., Roe, B.A., and Meisler, M.H. 1999. Comparative sequence of human and mouse BAC clones from the mnd2 region of chromosome 2p13. Genome Res. 9: 53-61. [PMC free article] [PubMed] [Google Scholar]
- 12.Kent W.J., Sugnet, C.W., Furey, T.S., Roskin, K.M., Pringle, T.H., Zahler, A.M., and Haussler, D. 2002. The human genome browser at UCSC. Genome Res. 12: 996-1006. [DOI] [PMC free article] [PubMed] [Google Scholar]
- 13.Koop B.F. and Hood, L. 1994. Striking sequence similarity over almost 100 kilobases of human and mouse T-cell receptor DNA. Nat. Genet. 7: 48-53. [DOI] [PubMed] [Google Scholar]
- 14.Koop B.F., Richards, J.E., Durfee, T.D., Bansberg, J., Wells, J., Gilliam, A.C., Chen, A., Clausell, H.L., Tucker, P.W., and Blattner, F.R. 1996. Analysis and comparison of the mouse and human immunoglobulin heavy chain JH-Cμ-Cδ locus. Mol. Phylogenet. Evol. 5: 33-49. [DOI] [PubMed] [Google Scholar]
- 15.Korf I., Flicek, P., Duan, D., and Brent, M.R. 2001. Integrating genomic homology into gene structure prediction. Bioinformatics 17 (Suppl 1): S140-S148. [DOI] [PubMed] [Google Scholar]
- 16.Lander E.S. and Waterman, M.S. 1988. Genomic mapping by fingerprinting random clones: A mathematical analysis. Genomics 2: 231-239. [DOI] [PubMed] [Google Scholar]
- 17.Makalowski W. and Boguski, M.S. 1998. Evolutionary parameters of the transcribed mammalian genome: An analysis of 2,820 orthologous rodent and human sequences. Proc. Natl. Acad. Sci. 95: 9407-9412. [DOI] [PMC free article] [PubMed] [Google Scholar]
- 18.Makalowski W., Zhang, J., and Boguski, M.S. 1996. Comparative analysis of 1196 orthologous mouse and human full-length mRNA and protein sequences. Genome Res. 6: 846-857. [DOI] [PubMed] [Google Scholar]
- 19.Meyer I.M. and Durbin, R. 2002. Comparative ab initio prediction of gene structures using pair HMMs. Bioinformatics 18: 1309-1318. [DOI] [PubMed] [Google Scholar]
- 20.Mouse Genome Sequencing Consortium 2002. Initial sequencing and comparative analysis of the mouse genome. Nature 420: 520-562. [DOI] [PubMed] [Google Scholar]
- 21.Oeltjen J.C., Malley, T.M., Muzny, D.M., Miller, W., Gibbs, R.A., and Belmont, J.W. 1997. Large-scale comparative sequence analysis of the human and murine Bruton's tyrosine kinase loci reveals conserved regulatory domains. Genome Res. 7: 315-329. [DOI] [PubMed] [Google Scholar]
- 22.Pachter L., Alexandersson, M., and Cawley, S. 2002. Applications of generalized pair hidden markov models to alignment and gene finding problems. J. Comput. Biol. 9: 389-399. [DOI] [PubMed] [Google Scholar]
- 23.Parra G., Blanco, E., and Guigo, R. 2000. GeneID in Drosophila. Genome Res. 10: 511-515. [DOI] [PMC free article] [PubMed] [Google Scholar]
- 24.Parra, G., Agarwal, P., Abril, J.F., Wiehe, T., Fickett, J.W., and Guigó, R. 2003. Comparative gene prediction in human and mouse. Genome Res. (this issue). [DOI] [PMC free article] [PubMed]
- 25.Pruitt K.D. and Maglott, D.R. 2001. RefSeq and LocusLink: NCBI gene-centered resources. Nucleic Acids Res. 29: 137-140. [DOI] [PMC free article] [PubMed] [Google Scholar]
- 26.Roest Crollius H., Jaillon, O., Bernot, A., Dasilva, C., Bouneau, L., Fischer, C., Fizames, C., Wincker, P., Brottier, P., Quetier, F., et al. 2000. Estimate of human gene number provided by genome-wide analysis using Tetraodon nigroviridis DNA sequence. Nat. Genet. 25: 235-238. [DOI] [PubMed] [Google Scholar]
- 27.Schwartz S., Zhang, Z., Frazer, K.A., Smit, A., Riemer, C., Bouck, J., Gibbs, R., Hardison, R., and Miller, W. 2000. PipMaker—a web server for aligning two genomic DNA sequences. Genome Res. 10: 577-586. [DOI] [PMC free article] [PubMed] [Google Scholar]
- 28.Toyoda A., Noguchi, H., Taylor, T.D., Ito, T., Pletcher, M.T., Sakaki, Y., Reeves, R.H., and Hattori, M. 2002. Comparative genomic sequence analysis of the human chromosome 21 down syndrome critical region. Genome Res. 12: 1323-1332. [DOI] [PMC free article] [PubMed] [Google Scholar]
- 29.Wootton J.C. and Federhen, S. 1996. Analysis of compositionally biased regions in sequence databases. Methods Enzymol. 266: 554-571. [DOI] [PubMed] [Google Scholar]
- 30.Yeh R.F., Lim, L.P., and Burge, C.B. 2001. Computational inference of homologous gene structures in the human genome. Genome Res. 11: 803-816. [DOI] [PMC free article] [PubMed] [Google Scholar]


