Supplemental Digital Content is Available in the Text.
Inoculation elicits a clearly defined cortical electroencephalography response in preverbal infants that increases in amplitude between 1 to 2 and 12 months of age.
Keywords: Procedural pain, Immunization, Infants, EEG, Event-related potential, Cortical, Postnatal development, MBPS
Abstract
Inoculation is one of the first and most common experiences of procedural pain in infancy. However, little is known about how needle puncture pain is processed by the central nervous system in children. In this study, we describe for the first time the event-related activity in the infant brain during routine inoculation using electroencephalography. Fifteen healthy term-born infants aged 1 to 2 months (n = 12) or 12 months (n = 5) were studied in an outpatient clinic. Pain behavior was scored using the Modified Behavioral Pain Scale. A distinct inoculation event–related vertex potential, consisting of 2 late negative-positive complexes, was observable in single trials after needle contact with the skin. The amplitude of both negative-positive components was significantly greater in the 12-month group. Both inoculation event–related potential amplitude and behavioral pain scores increased with age but the 2 measures were not correlated with each other. These components are the first recordings of brain activity in response to real-life needle pain in infants up to a year old. They provide new evidence of postnatal nociceptive processing and, combined with more traditional behavioral pain scores, offer a potentially more sensitive measure for testing the efficacy of analgesic protocols in this age group.
1. Introduction
Inoculations are the most common source of procedural pain in infants and children.25 In recent years, development of clinical pain assessment tools for preverbal infants such as the Modified Behavioral Pain Scale (MBPS)39 has enabled a large body of research into improved methods of vaccine administration18 and pain relief strategies.6,22,34,38 Such pain scales rely on somatic and autonomic reflexes and behavioral measures such as body movements, changes in heart rate, and in facial expression; although these measures suggest that immunization injections can cause significant levels of distress for children, they are only indirect indicators of the pain perceived. Perception of pain arises in the brain and involves sensory–discriminative and affective–motivational processing in the cortex,24,41 therefore a brain-led approach to assess procedural pain in preverbal infants could be a viable way forward.13
In line with this principle, our understanding of cortical pain processing in neonates has been advanced by direct measurement of brain activity in preterm and full-term infants through the use of near-infrared spectroscopy2,20,27,28 and scalp electroencephalography (EEG).8,29–31 Such studies have shown that neonates are already capable of discriminating between noxious and innocuous stimuli by term age.8,31 However, it is still not clear how cortical somatosensory and nociceptive processing matures in the early postnatal period.
Previous EEG studies have identified a specific pattern of cortical activity after noxious heel lance in human neonates.8,30,31 Here, we have recorded time-locked EEG during a routine inoculation in infants during the first year of life and characterized, for the first time, the infant EEG response to inoculation. This approach could provide insight into cortical pain processing of a wider range of real-life painful procedures in young infants and also provide a useful objective measure of procedural pain for testing analgesic protocols.
2. Methods
2.1. Participants
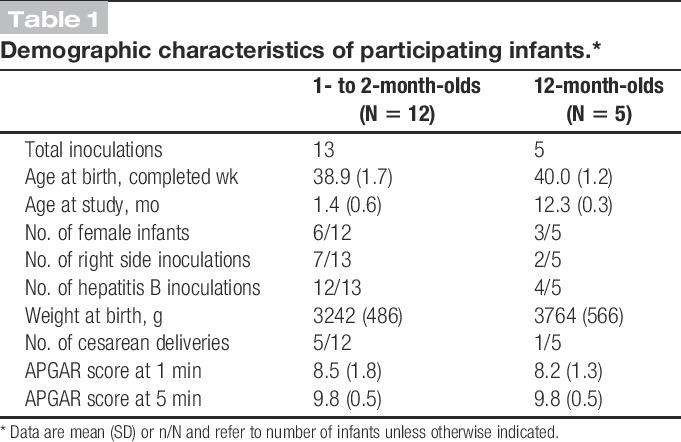
Fifteen healthy term-born infants were studied at 1 to 2 months (n = 12) or at 12 months (n = 5) of age. Two infants were studied at both ages, and 1 infant was studied at both 1 and 2 months. In addition, 1 infant was also studied at 6.5 months and 2 infants received 2 inoculations on the same test occasion; the inoculation at 6.5 months and the second inoculations were not included in the final sample but are presented individually. Infants were recruited from outpatient clinics at the Elizabeth Garrett Anderson Wing, University College London Hospital. Infants were not eligible for inclusion in the study if they were asphyxiated at birth or were receiving medication at the time of study.
Infant demographics and clinical details were obtained from medical records (Table 1). All infants were singletons and were assessed by a doctor or nurse as clinically well at the time of study.
Table 1.
Demographic characteristics of participating infants.*
Ethical approval for this study was given by the University College London Hospital ethics committee. Informed written parental consent was obtained before each study. The study conformed to the standards set by the Declaration of Helsinki.
2.2. Noxious stimulus
The noxious stimulus was a needle puncture as part of a clinically required routine inoculation administered intramuscularly into the thigh by a nurse or doctor. No inoculations were given solely for the purpose of the study. Most infants received a hepatitis B inoculation, which is given at birth and again at 1, 2, and 12 months. The remaining infants received routine inoculations, including DTaP/IPV/Hib, MenC, pneumococcal conjugate vaccine (PCV), and measles–mumps–rubella vaccine (MMR). Age ranges studied reflect inoculation schedules in the United Kingdom (Table 1). In all cases, infants received 0.5 mL fluid and a 25-gauge needle was used. For all inoculations, standard clinical practice guidelines32 and hospital practice were followed: all infants were either held by their parent or sitting upright in their parent's lap, and were distracted as required. In addition, parents were encouraged to feed their child during the procedure; except for two 1- to 2-month-olds, all infants were fed either during or just before inoculation. Following hospital practice, no local anesthetic was used. For infants receiving 2 vaccinations on the same occasion, the vaccine considered to be most painful was given last, according to published guidelines17,32; all intramuscular inoculations were given rapidly without aspiration.
Inoculation is a complex stimulus involving several stages: initial skin contact by the needle, increasing needle pressure on the skin until it is punctured, fluid injection, and needle withdrawal. Here, we have focused on skin contact because this is the first event from which the whole inoculation process follows, and because it is less variable across different vaccines and fluid volumes. To enable time-locking of the first skin contact with the ongoing EEG, inoculation was filmed with a high-speed camera (Optronis GmbH, Kehl, Germany; frame rate = 200 frames per second), which was synchronized with the EEG recording. The frame in which the needle first contacted the skin was identified post acquisition by 2 independent observers, and the corresponding EEG segment was then analyzed (Fig. 1). First, contact was defined as the time at which the skin was first visibly indented by the needle; this contact could be reliably identified by both observers. To characterize the duration of the inoculation event, the times at which (1) the needle broke the skin, (2) fluid injection began, and (3) the needle exited the skin were also identified. Skin break was defined as the frame subsequent to maximal skin indentation by the needle; fluid injection was defined as the frame at which the plunger first began to move.
Figure 1.
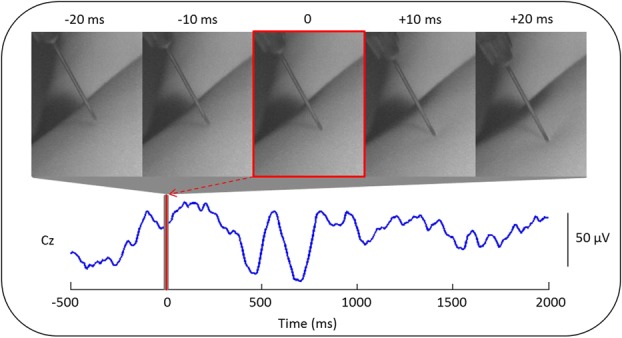
Method for time-locking the inoculation event to the electroencephalography (EEG) recording. Electroencephalographic activity recorded at electrode position Cz in a 2-month-old infant is shown. The exact time at which the needle first contacted the skin of the infant's left thigh (time 0, red line) was obtained using a high-speed camera (200 frames per seconds) that was synchronized with the EEG recording. The 5-millisecond frames pictured above the EEG trace correspond to the first contact (0 milliseconds) and to 10 and 20 milliseconds before and after (gray region around 0).
On average, the inoculation lasted 4924 ± 1256 milliseconds from the time of the first contact to the time the needle was withdrawn from the skin. The skin was broken by the needle approximately 418 ± 162 milliseconds, and fluid injection began 2379 ± 1306 milliseconds, after the first contact.
2.3. Pain behavior scoring
Pain behavior was assessed using the Modified Behavioral Pain Scale (MBPS),39 which is a validated35 and extensively used method of assessing inoculation pain.5,17,18,22,34,38 The MBPS is based on 3 parameters (facial expression, cry, and movements), and scores range from 0 (no pain) to 10 (maximal pain). Infants were video recorded during the inoculation procedure using a standard handheld camcorder, and baseline and inoculation periods were identified offline for pain behavior scoring as the 15 seconds before and the 15 seconds after the first needle contact with the skin. Baseline and inoculation scores reflected the maximum response observed during the respective 15-second periods. Videos were scored by 2 independent observers and their interrater reliability was assessed by calculating the intraclass correlation coefficient, using a 2-way mixed model based on absolute agreement. This model takes into account the systematic differences between observers. This produced correlation coefficients of 0.81 and 0.89 for the baseline and inoculation periods, respectively, suggesting a high interrater reliability of MBPS scores. Differences between observers were small, and scores were averaged to produce a single set of ratings.
2.4. EEG recording
Recording electrodes (disposable Ag/AgCl cup electrodes) were positioned according to the modified international 10/20 electrode placement system at Fp1, Fp2, Fz, F3, F4, Cz, C3, C4, CPz, CP3, CP4, T3, T4, T5, T6, O1, O2, and POz. As recordings were performed on volunteers, it was not always possible to apply the full set of electrodes. The minimum number of electrodes used was 6, although in the majority of infants, at least 11 electrodes were used, and the Cz electrode was used in all recordings. Reference and ground electrodes were placed at FCz and on the forehead, respectively. Electrode-skin impedance was kept to a minimum by rubbing the skin with an EEG prepping gel (NuPrep gel; DO Weaver and Co, Aurora, CO), and contact with the electrodes was optimized by applying conductive EEG paste (Ten20; DO Weaver and Co, Aurora, CO or Elefix; Nihon Kohden, Chessington, United Kingdom). Electrodes were held in place using an elastic net (Surgifix; FRA Production S.p.A., Cisterna d'Asti, Italy), and electrode leads were tied together to minimize electrical interference. Electroencephalographic activity, from DC to 70 Hz, was recorded using the Neuroscan (Scan 4.3) SynAmps2 EEG/EP recording system (Compumedics Neuroscan, Charlotte, NC). A 50-Hz notch filter was used in all but 1 occasion, and signals were digitized with a sampling rate of 2 kHz and a resolution of 24 bit.
All EEG recordings were assessed as normal by a trained neurophysiologist (A.L.) with respect to symmetry, synchronicity, absence of epileptiform activity, and background rhythms appropriate for age. The infants' sleep state was also classified as either “awake” or “asleep” using EEG and video recordings. All infants were awake except one 2-month-old infant; 3 infants in the 1- to 2-month-old group could not be classified.
2.5. Event-related potential analysis
Electroencephalography traces were analyzed using EEGLAB7 and custom-written MATLAB (The MathWorks, Inc, Natick, MA) scripts. Traces were bandpass filtered between 1 and 30 Hz (using a second-order bidirectional Butterworth filter), initially segmented into 2.7 second epochs starting from 0.6 seconds before the first needle contact, and baseline-corrected using a prestimulus interval of −0.5 to 0 seconds. Channels containing movement artifact (defined as activity exceeding ±100 μV) or high-frequency muscle activity were removed. In a single channel of 1 trial, alpha activity was detected and filtered out using a second-order bidirectional Butterworth stop-band filter between 7.5 and 12.5 Hz.
2.5.1. Within-group analysis
Previous research has found modality-specific significant differences in evoked activity at Cz and CPz only,31 therefore in this study, the analysis focused on Cz. Electroencephalography segments were analyzed separately for the 2 age groups (1- to 2-month-olds vs 12-month-olds). In both groups, it was possible to identify 2 waveforms maximal at Cz from the group averages and from most individual trials. For each waveform, traces were aligned to correct for latency jitter4,44 using Woody-filtering with an alignment window centered on the given waveform. This approach resulted in 2 (aligned) group averages per age group, which were used in subsequent analyses. Because inoculation is a protracted and complex stimulus, we allowed for a maximum jitter correction of ± 150 milliseconds. Following Woody-filtering, traces were re-epoched between −0.5 and 2.0 seconds and baseline-corrected between −0.5 and 0 seconds.
To determine whether the waveforms were significantly different from baseline, z tests were performed at each time point within a region of interest centered on each waveform. We used the false discovery rate3 to correct for multiple comparisons and assumed 30 independent tests per second because data were lowpass filtered at 30 Hz. Scalp topography maps were created from the aligned group averages to display the scalp distribution of the negative (N) and positive (P) peaks of each waveform. For each N and P peak, the average amplitude (across trials) at Cz and at each of the other channels at the time of the given peak was plotted as a heat map. Channels that were excluded because of contamination by artifacts or not recorded were interpolated.
2.5.2. Between-group analysis
To determine whether cortical EEG responses differed with age, the peak-to-peak amplitude (of the N and P peaks, which were manually identified in the individual traces by comparison with the group averages) of each waveform was compared across groups using independent samples t tests. In addition, the aligned EEG traces of the 1- to 2- and 12-month-old infants were compared, separately for each of the 2 waveforms, to detect which parts of the waveform were significantly different between the 2 groups. To enable comparison of the magnitude of the waveforms, the EEG traces of the 1- to 2-month-olds were aligned with respect to those of the 12-month-olds (without affecting within-group alignment) using Woody-filtering with a maximum jitter of ±100 milliseconds. Independent samples t tests were then performed at each time point, within a region of interest centered on each waveform, to test whether the distribution of amplitudes of each group at the given time point were significantly different. Corrections for multiple comparisons were performed as described in Section 2.4.1.
2.6. Statistical analysis
Data were assessed for normality and homogeneity of variance. Where assumptions for a parametric test were not met, a nonparametric test was used and the median and interquartile range (quartile 1-quartile 3) were reported. For all tests, the threshold for significance was set at α = 0.05, except where adjusted for multiple comparisons.
3. Results
Inoculation elicited a clear event-related potential, consisting of 2 waveforms recorded at Cz. These potentials were observable in single trials after first contact of the needle with the skin (Fig. 2). The waveforms were present in both age groups (1-2 months and 12 months) and were reproducible across infants, particularly in the older group.
Figure 2.
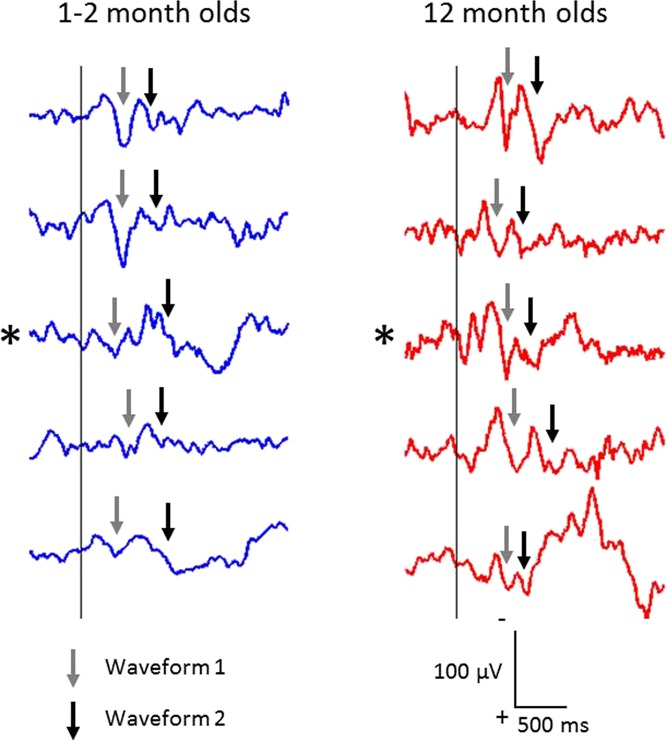
Single-trial electroencephalography responses to inoculation, recorded from Cz, after the first contact with the inoculation needle (at time 0; vertical line) in the 12-month-olds (right) and, for comparison, 5 of the clearest responses in the 1- to 2-month group (left). Note the striking reproducibility in the older group. Traces marked with an asterisk belong to a single infant that was studied longitudinally at both ages. Traces are shown without alignment to either the first or second waveforms. Arrows point to the first (gray arrows) and second (black arrows) waveforms that were identified in individual trials after alignment (see Figures 3 and 4 for aligned group average responses).
3.1. Characterization of the EEG response to inoculation in 1- to 2-month-olds
In the 1- to 2-month group, inoculation evoked an event-related potential (iERP), which consisted of a clear late N1P1 complex followed by a less clear N2P2 complex. Traces were aligned (and tested for significance) between 50 and 500 milliseconds for the first waveform and between 550 and 900 milliseconds for the second waveform. Both waveforms were significantly different from baseline. The mean latencies of the N and P peaks of the first waveform were 234 ± 49 and 395 ± 17 milliseconds, and the amplitudes were −11 ± 12 and 21 ± 16 μV, respectively. The mean latencies of the N and P peaks of the second waveform were 642 ± 34 and 792 ± 26 milliseconds and −18 ± 9 and 10 ± 11 μV, respectively (Table 2). Scalp topography maps showed that for both waveforms, the N and P peaks were maximal at the vertex (Fig. 3).
Table 2.
Peak latency and amplitude and peak-to-peak amplitude of the iERP.*
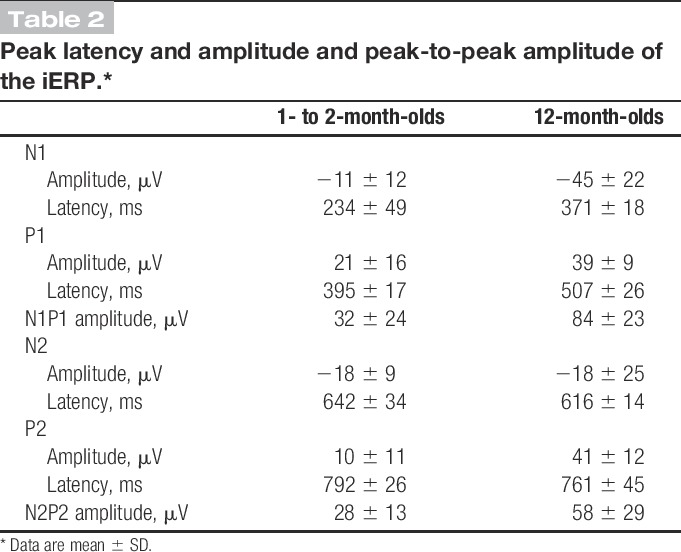
Figure 3.
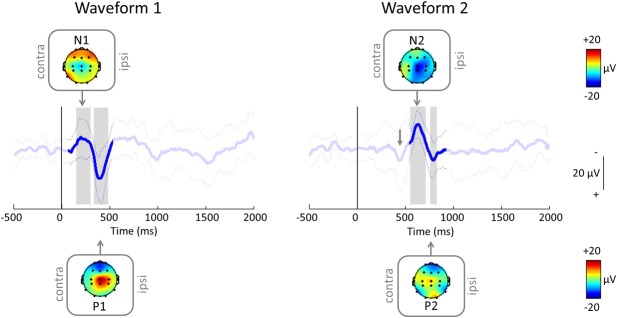
Average (±SD) inoculation event–related potential (iERP) after the first needle contact (at time = 0 milliseconds; vertical line) in 1- to 2-month-olds (n = 13 inoculations from 12 infants; see Methods and Table 1) when aligned between 50 and 500 milliseconds (left) and 550 and 900 milliseconds (right), with topography maps at the negative (N) and positive (P) peaks. Note that the group average responses are from the same group of infants but look different because the individual trials have been aligned differently. After aligning for the second waveform (right), the first waveform (gray arrow) is still visible, although less clearly.
3.2. iERPs can also be recorded in older infants
Inoculation also evoked a clear iERP in the 12-month group, consisting of 2 clear late negative-positive (NP) complexes that were similar to those evoked in the 1- to 2-month group (Fig. 4). Both waveforms were strikingly reproducible across infants and could be clearly identified in every single trial (Fig. 2). Traces were aligned between 200 to 600 milliseconds and 400 to 1100 milliseconds for the first and second waveforms, respectively. As before, both waveforms were significantly different from baseline (tested between 200 and 600 milliseconds for the first waveform and between 550 and 1100 milliseconds for the second). The mean N1 and P1 peaks were 371 ± 18 and 507 ± 26 milliseconds in latency and −45 ± 22 and 39 ± 9 μV in amplitude, respectively. For the second waveform, the mean N and P peaks were 616 ± 14 and 761 ± 45 milliseconds in latency and −18 ± 25 and 41 ± 12 μV in amplitude, respectively (Table 2). Scalp topography maps revealed that similar to the 1- to 2-month group, the P peaks of both waveforms were generally localized to the vertex. The N peaks were not as localized to the vertex as in the 1- to 2-month-olds; this is likely to be due to the small sample size and the exclusion of some channels from most trials (Fig. 4).
Figure 4.
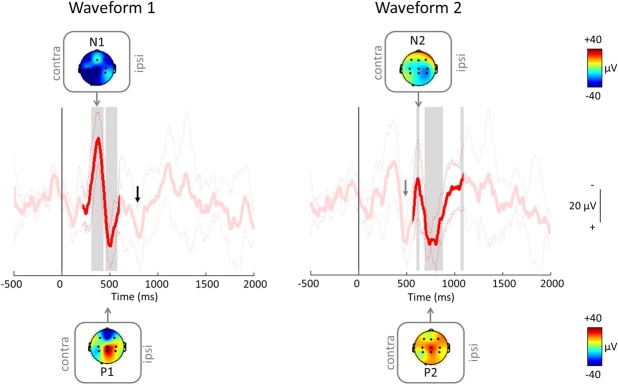
Average (±SD) iERP in 12-month-olds (n = 5) when aligned between 200 and 600 milliseconds (left) and 400 to 1100 milliseconds (right), with topography maps at N and P. Note that similar to the 1- to 2-month-olds, the first waveform (gray arrow) is still visible after alignment to the second waveform (right); in addition, the second waveform (black arrow) is also visible after alignment to the first waveform (left). iERP, inoculation event–related potential.
3.3. The iERP is reproducible in individual infants
The iERP could be clearly observed in single trials (Fig. 2). In addition, in 2 infants where 2 inoculations were scheduled on the same test occasion, both waveforms were reproducible across the 2 inoculations (Fig. 5).
Figure 5.
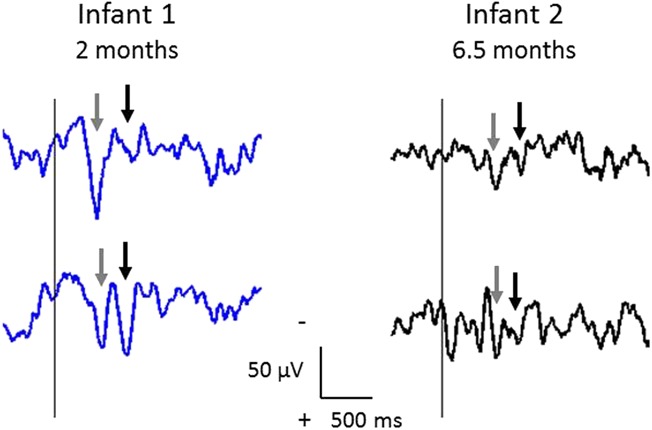
Single-trial iERPs in 2 infants having consecutive inoculations on the same test occasion. Infant 1 had 2 inoculations at 2 months (blue traces), and infant 2 had 2 inoculations at 6.5 months (black traces); the first inoculation is plotted first (upper trace). In both infants, the 2 waveforms (gray and black arrows as in Figure 2) are very reproducible. Traces are shown without alignment.
3.4. The iERP is larger at 12 vs 1 to 2 months of age
Although the iERP could be observed in single trials in both groups, it was clearer and more reproducible across infants in the 12-month group, and both waveforms were larger in this group (Fig. 2). Independent samples t tests comparing the peak-to-peak amplitude of each waveform across groups confirmed that the 12-month-olds had significantly larger peak-to-peak amplitudes than the 1- to 2-month-olds for both the first (mean amplitude: 84 ± 23 vs 32 ± 24 μV; t(16) = 4.20, P = 0.001) and second (58 ± 29 vs 28 ± 13 μV; t(16) = 3.08, P = 0.007) waveforms (Fig. 6).
Figure 6.
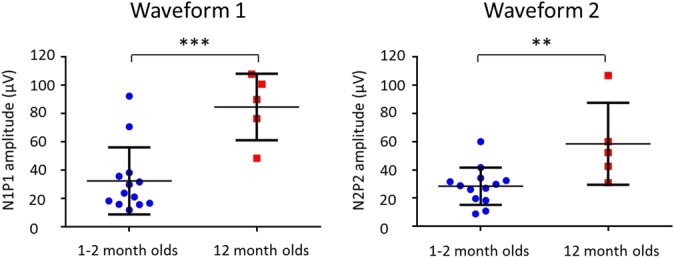
Column scatterplots showing the peak-to-peak amplitudes of the first (left) and second (right) waveforms for 1- to 2-month-olds (blue; n = 13) and 12-month-olds (red; n = 5). For both waveforms, 1- to 2-month-olds had lower peak-to-peak amplitudes than 12-month-olds. The mean (solid horizontal line) and SD (whiskers extending from the mean) are indicated. **P < 0.01; ***P < 0.005.
To further explore the increase in amplitude with age, the EEG traces were compared directly to determine which parts of the waveforms differed between the 2 groups. Independent samples t tests at each time point within 150 to 600 milliseconds for the first waveform and 550 to 1100 milliseconds for the second waveform showed that N1 and P2 were significantly larger at 12 months of age (Fig. 7).
Figure 7.
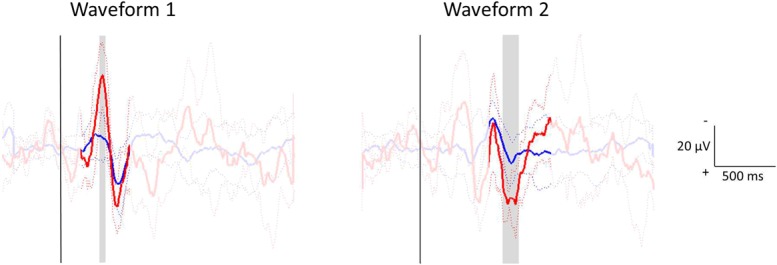
Statistical comparison of the electroencephalography traces of 1- to 2-month-olds (blue) and 12-month-olds (red) for the first (left) and second (right) waveforms. For each waveform, traces were aligned between groups (without affecting within-group alignment). Independent samples t tests assessed whether the distribution of amplitudes at each time point in a region of interest centered on the waveform (150-600 milliseconds for the first waveform; 550-1100 milliseconds for the second waveform) differed between the 2 groups. The aligned group averages (±SD) are shown, with statistically significant differences highlighted in gray.
3.5. Increase in amplitude of the iERP with age can be seen longitudinally in individual infants
The increase in amplitude and clarity of the iERP can also be observed in individual infants studied on multiple occasions. Two infants were studied at both 1 to 2 months and 12 months of age, and one 12-month-old infant was also studied at 6.5 months. In all 3 infants, the EEG response appeared clearer and larger by 12 months of age, particularly for the first waveform (Fig. 2, asterisks; Fig. S1, available online as Supplemental Digital Content at http://links.lww.com/PAIN/A4).
3.6. Comparing cortical EEG responses to inoculation with pain behavior
Both groups of infants exhibited little pain behavior before inoculation (median [Q1-Q3] MBPS scores = 2.0 [2.0-2.0] for 1- to 2-month-olds and 2.0 [1.0-2.0] for 12-month-olds) and responded strongly during the inoculation period (8.0 [7.5-8.0] and 9.0 [9.0-9.0], respectively). In line with the iERP amplitudes, the MBPS scores during the inoculation were significantly larger in the older infants (Wilcoxon–Mann–Whitney test; mean rank 15.0 vs 7.4 in 12-month vs 1-to 2-month-olds, respectively; Z = 2.93, P = 0.002; Fig. 8). However, examination of the relationship between cortical EEG responses and pain behavior revealed no correlation between the peak-to-peak amplitudes of either the first or second waveforms and the inoculation MBPS scores in 1- to 2-month-olds (Spearman rank order correlation coefficient; waveform 1: ρ = −0.15, P = 0.62 and waveform 2: ρ = −0.20, P = 0.52; n = 13). This relationship could not be explored in the 12-month-olds because all infants had identical scores (Fig. 8).
Figure 8.
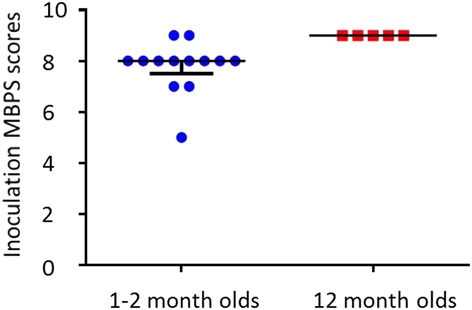
Column scatterplots showing the inoculation Modified Behavioral Pain Scale (MBPS) scores of 1- to 2-month-olds and 12-month-olds. Note the narrow range of scores in both groups. The median (solid horizontal line) and interquartile range (whiskers extending from the median) are indicated.
4. Discussion
Our data show that inoculation elicits clear event-related potentials (iERPs) after first needle contact in infants aged 1 to 2 and 12 months and that the iERPs increase in clarity and amplitude by 12 months.
In both groups, the iERP consisted of 2 biphasic negative-positive waveforms maximal at the vertex. The iERP could be identified in single trials and was reproducible both across infants and within infants that were given successive inoculations, confirming its reliability.
4.1. Interpretation of iERPs
Inoculation is a protracted, complex stimulus, consisting of an initial phase in which the needle contacts the skin and increasing pressure is applied until the skin is broken, followed by needle penetration deeper into the muscle, fluid injection, and needle withdrawal. Because fluid injection occurred at a mean of ∼2.4 seconds after the first needle contact, it is likely that the first waveform, if not also the second, is related mainly to needle contact and needle pressure.
Two studies have explored related stimuli in adult participants.4,14 In the first, a small-diameter Plexiglass probe was used to apply different levels of mechanical force to the finger nail bed.4 When the pressure applied was perceived as painful, a potential was elicited at Cz consisting of 2 waveforms that were strikingly similar to the iERP in terms of polarity and scalp distribution. In the second study, needle-like pressure was applied using a small-diameter flat-tip mechanical stimulator (the PinPrick). This approach evoked a single biphasic NP complex that was maximal at Cz.14 Although the pinprick-evoked potential consisted of only 1 waveform, this was also similar in terms of topography and polarity to the waveforms elicited after inoculation. Latencies of the waveforms reported in adults4,14 were shorter than those reported here; this tendency could be explained by slower conduction velocities and longer synaptic delays in the immature nervous system.19,40 It should also be noted that both adult studies report the average waveform from 20 to 40 repeated stimuli per site, which greatly reduces variability. Here, we are studying a real-life, one-off painful event in a clinical setting, and yet we are able to detect a clear response.
In the first adult study, the second waveform was elicited only when the pressure applied was reported as painful,4 whereas in preverbal children, this information is not available; the use of calibrated needle-like stimulators (the PinPrick) with a range of forces may provide us with more information. In addition, although needle pressure and needle puncture are noxious, fluid injection is also considered painful and future work could focus on this part of the procedure to provide a clearer picture of the overall cortical response to inoculation.
4.2. Comparison with heel lance in neonates
We have previously characterized the EEG response to a noxious heel lance in neonates.8,31 Although this is an instantaneous skin-breaking event, unlike the inoculation, the iERP was similar in morphology, polarity, and topography to the potential elicited by heel lance in term-age neonates.31 In the neonates, heel lance also elicited 2 waveforms, of which only the second was nociceptive specific.31
Both waveforms had longer latencies after inoculation (1- to 2-month-olds: N234-P395 and N642-P792; 12-month-olds: N371-P507 and N616-P761) as compared with heel lance (N150-P260 and N420-P560).31 This may be due in part to the greater variability of the inoculation as a stimulus but is more likely to represent the delay between the first needle contact and the time at which needle pressure becomes noxious.
4.3. Postnatal development
Comparison of the peak-to-peak amplitudes with age showed that both waveforms were significantly larger in the 12-month-olds. Physiologically, this phenomenon could be explained by the presence of a larger population of neurons, or by a larger proportion of the neural population being recruited, in older infants. Alternatively, it could be explained by better synchronization of firing activity of the neurons being recruited, resulting in better signal-to-noise ratio.
The larger magnitude of the iERPs in the older infants may also be due to increased exposure to tissue damaging stimuli in the older group, which typically had at least 1 to 2 more inoculations than the younger infants, without considering all the other common injuries that infants experience in daily life. We have previously shown that prematurity, and the resulting early exposure to noxious procedures, is associated with larger amplitude nociceptive EEG responses to noxious heel lance.30 This finding is also consistent with studies suggesting that exposure to painful procedures in early infancy results in prolonged changes in pain sensitivity.12,23,26,37,42
When comparing EEG traces directly, we found that the increase in amplitude of the iERP was restricted to the N1 and P2 peaks. Several studies exploring somatosensory vertex potentials in adults have also found amplitude changes that are specific to either the N or P peak. In 2 studies in which mechanical stimulation was applied, the amplitude of the P peak increased after noxious lance vs innocuous sham stimulation9 and after painful vs nonpainful mechanical force application.4 In contrast, Iannetti et al.14 reported an increase in amplitude after mechanical pinprick stimulation that was restricted to the N peak of the pinprick-evoked potential during capsaicin-induced hyperalgesia in adults, and also found that the N peak of laser-evoked potentials recorded in adult participants correlates better than the P peak with perceived intensity of the noxious laser stimulation.15 It is not clear at present whether the amplitude changes observed in the iERP are also related to nociception. Further research is needed to better characterize the different components of the iERP, and longitudinal study of a larger group at several ages will also provide more insight into the development of nociceptive processing in infants.
Although the iERP was larger and clearer in the older group, topography maps of the N peaks were less localized to Cz than in the younger group. One possibility is that in this group, the signal-to-noise ratio is larger and therefore the response is picked up from more electrodes; another possibility is that while EEG responses become more localized with age, there is a developmental period where they appear less localized. Finally, this phenomenon could also be due to the smaller sample size and the exclusion of some channels in most trials.
4.4. Pain behavior
In the absence of self-report, pain in preverbal infants is typically assessed using scales that rely on behavioral and autonomic responses. Here, we used the MBPS, which focuses on the facial expression, crying, and body movements. We found no relationship between the cortical EEG response and pain behavior in 1- to 2-month-olds, perhaps because MBPS scores were invariant in comparison with peak-to-peak amplitudes, with most infants scoring almost maximally (8/10) after inoculation (Figs. 6, 8).
Pain scales are a useful tool for research into interventions that reduce inoculation pain in young infants,6,17,18,22,34,38 and facial expression in particular is considered a reliable pain response10,11 that is important for communication with others to enable relief or escape.43 Nonetheless, the low spread of MBPS scores in our data suggests that the behavioral responses on which the MBPS is based are a relatively “blunt” measure of the subjective pain experience, perhaps because of their importance for communication with others to enable immediate action for pain relief or avoidance. Cortical EEG activity, however, shows that the noxious stimulus is being processed in the brain, with some individual variability, but is not necessarily a direct read-out of the amount of pain perceived. In any case, given that the perception of pain arises in the cortex, it is likely that a brain-oriented approach would provide useful information in conjunction with pain behavior that could be used to investigate the efficacy of pain-relieving interventions.
4.5. Clinical relevance
Inoculations are the most common cause of childhood procedural pain. By the age of 2, 14 to 20 injections are administered in the United States25 and 9 in the United Kingdom.16 Pain associated with frequent inoculations is a source of anxiety and distress for the child, but is also often a concern for the parent and clinician,25,33 and there is emerging evidence that fear of needles in both parents and children affects compliance with medical care.1,21,33,36,45 Improved pain management during routine inoculation is therefore an important goal.33 Our ability to record clear EEG responses to inoculation is a first step toward characterizing a cortical pain response that could be useful in assessing pain management strategies during inoculation.
4.6. Conclusion
Here, we have shown that inoculation evokes, from the time of the first needle contact, a clearly defined EEG response in infants up to at least 1 year of age. This finding may provide a quantitative measure of cortical pain activity that could be used to investigate the efficacy of pain-relieving interventions. The technique used to time-lock the inoculation procedure to the EEG recording extends the range of real-life painful events we can study and allows us to explore the long-term postnatal development of nociceptive processing in the infant brain.
Conflict of interest statement
The authors have no conflicts of interest to declare. This work was funded by the Wellcome Trust (090245/Z/09/Z) and was performed at the National Institute for Health Research/Wellcome University College London Hospital Clinical Research Facility.
Supplementary Material
Acknowledgements
The authors thank the families of the infants that participated in this research, Alan Worley for technical assistance with the synchronization of the high-speed camera and EEG recordings, Debbie Jackson and Bridget Catterall for their assistance with data collection, and Anna Carter and Luke La Hausse de la Louviere for assistance with MBPS scoring.
Author contributions: M. Verriotis: experimental design, data collection, data analysis, data interpretation, manuscript preparation; L. Fabrizi: experimental design, data analysis, data interpretation, critical comments on manuscript; A. Lee: data collection; S. Ledwidge: data collection; J. Meek: experimental design, data interpretation, critical comments on manuscript: M. Fitzgerald: experimental design, data interpretation, manuscript preparation. All authors have read and approved the article.
Appendix A. Supplemental Digital Content
Supplemental Digital Content associated with this article can be found online at http://links.lww.com/PAIN/A4.
Footnotes
Sponsorships or competing interests that may be relevant to content are disclosed at the end of this article.
Supplemental digital content is available for this article. Direct URL citations appear in the printed text and are provided in the HTML and PDF versions of this article on the journal’s Web site (www.painjournalonline.com).
References
- [1].Abbotts B, Osborn LM. Immunization status and reasons for immunization delay among children using public health immunization clinics. Am J Dis Child 1993;147:965–8. [DOI] [PubMed] [Google Scholar]
- [2].Bartocci M, Bergqvist LL, Lagercrantz H, Anand KJS. Pain activates cortical areas in the preterm newborn brain. PAIN 2006;122:109–17. [DOI] [PubMed] [Google Scholar]
- [3].Benjamini Y, Hochberg Y. Controlling the false discovery rate: a practical and powerful approach to multiple testing. J R Stat Soc Ser B Methodol 1995;57:289–300. [Google Scholar]
- [4].Bromm B, Scharein E. Principal component analysis of pain-related cerebral potentials to mechanical and electrical stimulation in man. Electroencephalogr Clin Neurophysiol 1982;53:94–103. [DOI] [PubMed] [Google Scholar]
- [5].Carbajal R, Biran V, Lenclen R, Epaud R, Cimerman P, Thibault P, Annequin D, Gold F, Fauroux B. EMLA cream and nitrous oxide to alleviate pain induced by palivizumab (Synagis) intramuscular injections in infants and young children. Pediatrics 2008;121:e1591–8. [DOI] [PubMed] [Google Scholar]
- [6].Chambers CT, Taddio A, Uman LS, McMurtry CM. Psychological interventions for reducing pain and distress during routine childhood immunizations: a systematic review. Clin Ther 2009;31(suppl 2):S77–103. [DOI] [PubMed] [Google Scholar]
- [7].Delorme A, Makeig S. EEGLAB: an open source toolbox for analysis of single-trial EEG dynamics including independent component analysis. J Neurosci Methods 2004;134:9–21. [DOI] [PubMed] [Google Scholar]
- [8].Fabrizi L, Slater R, Worley A, Meek J, Boyd S, Olhede S, Fitzgerald M. A shift in sensory processing that enables the developing human brain to discriminate touch from pain. Curr Biol 2011;21:1552–8. [DOI] [PMC free article] [PubMed] [Google Scholar]
- [9].Fabrizi L, Williams G, Lee A, Meek J, Slater R, Olhede S, Fitzgerald M. Cortical activity evoked by an acute painful tissue-damaging stimulus in healthy adult volunteers. J Neurophysiol 2013;109:2393–403. [DOI] [PMC free article] [PubMed] [Google Scholar]
- [10].Grunau RE, Oberlander T, Holsti L, Whitfield MF. Bedside application of the Neonatal Facial Coding System in pain assessment of premature infants. PAIN 1998;76:277–86. [DOI] [PubMed] [Google Scholar]
- [11].Grunau RVE, Craig KD. Pain expression in neonates: facial action and cry. PAIN 1987;28:395–410. [DOI] [PubMed] [Google Scholar]
- [12].Hermann C, Hohmeister J, Demirakça S, Zohsel K, Flor H. Long-term alteration of pain sensitivity in school-aged children with early pain experiences. PAIN 2006;125:278–85. [DOI] [PubMed] [Google Scholar]
- [13].Holsti L, Grunau RE, Shany E. Assessing pain in preterm infants in the neonatal intensive care unit: moving to a “brain-oriented” approach. Pain Manag 2011;1:171–9. [DOI] [PMC free article] [PubMed] [Google Scholar]
- [14].Iannetti GD, Baumgärtner U, Tracey I, Treede RD, Magerl W. Pinprick-evoked brain potentials: a novel tool to assess central sensitization of nociceptive pathways in humans. J Neurophysiol 2013;110:1107–16. [DOI] [PubMed] [Google Scholar]
- [15].Iannetti GD, Zambreanu L, Cruccu G, Tracey I. Operculoinsular cortex encodes pain intensity at the earliest stages of cortical processing as indicated by amplitude of laser-evoked potentials in humans. Neuroscience 2005;131:199–208. [DOI] [PubMed] [Google Scholar]
- [16].Immunization - GOV.UK. n.d. Available at: https://www.gov.uk/government/collections/immunisation. Accessed 17 Jun 2014.
- [17].Ipp M, Parkin PC, Lear N, Goldbach M, Taddio A. Order of vaccine injection and infant pain response. Arch Pediatr Adolesc Med 2009;163:469–72. [DOI] [PubMed] [Google Scholar]
- [18].Ipp M, Taddio A, Sam J, Gladbach M, Parkin PC. Vaccine-related pain: randomised controlled trial of two injection techniques. Arch Dis Child 2007;92:1105–08. [DOI] [PMC free article] [PubMed] [Google Scholar]
- [19].Levitt P. Structural and functional maturation of the developing primate brain. J Pediatr 2003;143:35–45. [DOI] [PubMed] [Google Scholar]
- [20].Limperopoulos C, Gauvreau KK, O'Leary H, Moore M, Bassan H, Eichenwald EC, Soul JS, Ringer SA, Salvo DND, du Plessis AJ. Cerebral hemodynamic changes during intensive care of preterm infants. Pediatrics 2008;122:e1006–13. [DOI] [PMC free article] [PubMed] [Google Scholar]
- [21].Mills E, Jadad AR, Ross C, Wilson K. Systematic review of qualitative studies exploring parental beliefs and attitudes toward childhood vaccination identifies common barriers to vaccination. J Clin Epidemiol 2005;58:1081–8. [DOI] [PubMed] [Google Scholar]
- [22].O'Brien L, Taddio A, Ipp M, Goldbach M, Koren G. Topical 4% amethocaine gel reduces the pain of subcutaneous measles-mumps-rubella vaccination. Pediatrics 2004;114:e720–4. [DOI] [PubMed] [Google Scholar]
- [23].Peters JWB, Schouw R, Anand KJS, van Dijk M, Duivenvoorden HJ, Tibboel D. Does neonatal surgery lead to increased pain sensitivity in later childhood? PAIN 2005;114:444–54. [DOI] [PubMed] [Google Scholar]
- [24].Price DD. Central neural mechanisms that interrelate sensory and affective dimensions of pain. Mol Interv 2002;2:392–403. [DOI] [PubMed] [Google Scholar]
- [25].Schechter NL, Zempsky WT, Cohen LL, McGrath PJ, McMurtry CM, Bright NS. Pain reduction during pediatric immunizations: evidence-based review and recommendations. Pediatrics 2007;119:e1184. [DOI] [PubMed] [Google Scholar]
- [26].Schmelzle-Lubiecki BM, Campbell KAA, Howard RH, Franck L, Fitzgerald M. Long-term consequences of early infant injury and trauma upon somatosensory processing. Eur J Pain 2007;11:799–809. [DOI] [PubMed] [Google Scholar]
- [27].Slater R, Cantarella A, Franck L, Meek J, Fitzgerald M. How well do clinical pain assessment tools reflect pain in infants? PLoS Med 2008;5:e129. [DOI] [PMC free article] [PubMed] [Google Scholar]
- [28].Slater R, Cantarella A, Gallella S, Worley A, Boyd S, Meek J, Fitzgerald M. Cortical pain responses in human infants. J Neurosci 2006;26:3662–6. [DOI] [PMC free article] [PubMed] [Google Scholar]
- [29].Slater R, Cornelissen L, Fabrizi L, Patten D, Yoxen J, Worley A, Boyd S, Meek J, Fitzgerald M. Oral sucrose as an analgesic drug for procedural pain in newborn infants: a randomised controlled trial. Lancet 2010;376:1225–32. [DOI] [PMC free article] [PubMed] [Google Scholar]
- [30].Slater R, Fabrizi L, Worley A, Meek J, Boyd S, Fitzgerald M. Premature infants display increased noxious-evoked neuronal activity in the brain compared to healthy age-matched term-born infants. NeuroImage 2010;52:583–9. [DOI] [PubMed] [Google Scholar]
- [31].Slater R, Worley A, Fabrizi L, Roberts S, Meek J, Boyd S, Fitzgerald M. Evoked potentials generated by noxious stimulation in the human infant brain. Eur J Pain 2010;14:321–6. [DOI] [PubMed] [Google Scholar]
- [32].Taddio A, Appleton M, Bortolussi R, Chambers C, Dubey V, Halperin S, Hanrahan A, Ipp M, Lockett D, MacDonald N, Midmer D, Mousmanis P, Palda V, Pielak K, Riddell RP, Rieder M, Scott J, Shah V. Reducing the pain of childhood vaccination: an evidence-based clinical practice guideline. Can Med Assoc J 2010;182:E843–55. [DOI] [PMC free article] [PubMed] [Google Scholar]
- [33].Taddio A, Chambers CT, Halperin SA, Ipp M, Lockett D, Rieder MJ, Shah V. Inadequate pain management during routine childhood immunizations: the nerve of it. Clin Ther 2009;31(suppl 2):S152–67. [DOI] [PubMed] [Google Scholar]
- [34].Taddio A, Ho T, Vyas C, Thivakaran S, Jamal A, Ilersich AF, Hogan ME, Shah V. A randomized controlled trial of clinician-led tactile stimulation to reduce pain during vaccination in infants. Clin Pediatr (Phila) 2014;53:639–44. [DOI] [PubMed] [Google Scholar]
- [35].Taddio A, Hogan ME, Moyer P, Girgis A, Gerges S, Wang L, Ipp M. Evaluation of the reliability, validity and practicality of 3 measures of acute pain in infants undergoing immunization injections. Vaccine 2011;29:1390–4. [DOI] [PubMed] [Google Scholar]
- [36].Taddio A, Ipp M, Thivakaran S, Jamal A, Parikh C, Smart S, Sovran J, Stephens D, Katz J. Survey of the prevalence of immunization non-compliance due to needle fears in children and adults. Vaccine 2012;30:4807–12. [DOI] [PubMed] [Google Scholar]
- [37].Taddio A, Katz J, Ilersich AL, Koren G. Effect of neonatal circumcision on pain response during subsequent routine vaccination. Lancet 1997;349:599–603. [DOI] [PubMed] [Google Scholar]
- [38].Taddio A, Nulman I, Goldbach M, Ipp M, Koren G. Use of lidocaine-prilocaine cream for vaccination pain in infants. J Pediatr 1994;124:643–8. [DOI] [PubMed] [Google Scholar]
- [39].Taddio A, Nulman I, Koren BS, Stevens B, Koren G. A revised measure of acute pain in infants. J Pain Symptom Manage 1995;10:456–63. [DOI] [PubMed] [Google Scholar]
- [40].Takahashi T. Postsynaptic receptor mechanisms underlying developmental speeding of synaptic transmission. Neurosci Res 2005;53:229–40. [DOI] [PubMed] [Google Scholar]
- [41].Treede R-D, Kenshalo DR, Gracely RH, Jones AKP. The cortical representation of pain. PAIN 1999;79:105–11. [DOI] [PubMed] [Google Scholar]
- [42].Walker SM, Franck LS, Fitzgerald M, Myles J, Stocks J, Marlow N. Long-term impact of neonatal intensive care and surgery on somatosensory perception in children born extremely preterm. PAIN 2009;141:79–87. [DOI] [PubMed] [Google Scholar]
- [43].Williams AC. Facial expression of pain, empathy, evolution, and social learning. Behav Brain Sci 2002;25:475–80. [DOI] [PubMed] [Google Scholar]
- [44].Woody CD. Characterization of an adaptive filter for the analysis of variable latency neuroelectric signals. Med Biol Eng 1967;5:539–54. [Google Scholar]
- [45].Wright S, Yelland M, Heathcote K, Ng S-K, Wright G. Fear of Needles - Nature and Prevalence in General Practice. Aust Fam Physician 2009;38:172–6. [PubMed] [Google Scholar]
Associated Data
This section collects any data citations, data availability statements, or supplementary materials included in this article.


