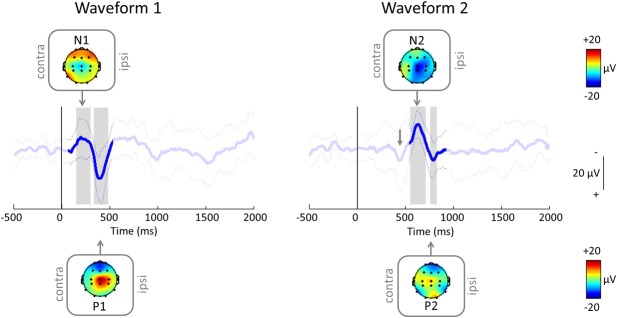
Figure 3.

Average (±SD) inoculation event–related potential (iERP) after the first needle contact (at time = 0 milliseconds; vertical line) in 1- to 2-month-olds (n = 13 inoculations from 12 infants; see Methods and Table 1) when aligned between 50 and 500 milliseconds (left) and 550 and 900 milliseconds (right), with topography maps at the negative (N) and positive (P) peaks. Note that the group average responses are from the same group of infants but look different because the individual trials have been aligned differently. After aligning for the second waveform (right), the first waveform (gray arrow) is still visible, although less clearly.
