

Abstract
Objective:
Serum uric acid (SUA) is associated with many cardiovascular risk factors such as hypertension (HTN) and metabolic syndrome (MetS). However, the association of SUA with atherosclerosis remains controversial. Our aim was to investigate the relationships of SUA with HTN, MetS and atherosclerosis in Chinese inpatients with type 2 diabetes.
Methods:
This cross-sectional study was performed with a sample of 2388 hospitalized Chinese patients with type 2 diabetes. Both carotid and lower limb atherosclerotic lesions were assessed for intima–media thickness, plaque and stenosis by Doppler ultrasound. Atherosclerotic plaque and stenosis were defined as the presence of either carotid or lower limb plaques and stenoses, respectively.
Results:
There were significant increases in the prevalence of both HTN and MetS across the SUA quartiles (HTN: 43.4, 49.6, 56.1 and 66.3% for the first, second, third and fourth quartiles, respectively, P < 0.001; MetS: 59.9, 68.8, 74.7 and 84.9% for the first, second, third and fourth quartiles, respectively, P < 0.001). A fully adjusted multiple logistic regression analysis revealed that SUA quartile was independently associated with the presence of HTN (P = 0.001) and MetS (P = 0.006). The prevalence of atherosclerotic plaque and stenosis was obviously higher in the patients with either HTN or MetS than in those without HTN or MetS. However, there was no significant association of SUA quartile with the presence of atherosclerotic lesions.
Conclusions:
SUA levels were closely associated with HTN and MetS, but not with atherosclerosis in type 2 diabetes. Our findings strongly suggest that, in select populations such as those with type 2 diabetes, the role of uric acid in atherosclerosis might be attributable to other cardiovascular risk factors, such as HTN and MetS.
Keywords: atherosclerosis, hypertension, hyperuricemia, metabolic syndrome, type 2 diabetes, uric acid
INTRODUCTION
The accumulated epidemiological and clinical evidence suggests that serum uric acid (SUA) levels are strongly associated with many cardiovascular risk factors, such as age, male sex, obesity, diabetes mellitus, insulin resistance, hypertension (HTN) and metabolic syndrome (MetS). Among these risk factors, the associations of SUA with HTN and MetS have been clearly observed in a number of studies in both general and type 2 diabetic populations [1–5]. For example, the Osaka Health Survey demonstrated that a 2.01-fold increase in the risk for HTN over 10 years is associated with hyperuricemia in Japanese men [1]. Moreover, increasing evidence has shown that SUA is significantly associated with MetS independently of other risk factors in type 2 diabetes [4,5]. Furthermore, both HTN and MetS are well established as important risk factors for atherosclerosis and cardiovascular disease (CVD) in healthy and unhealthy populations.
Hyperuricemia has also been reported to be a risk factor for atherosclerosis and CVD [6,7]. However, contrary to the definite associations of HTN and MetS with atherosclerosis and CVD, substantial uncertainties regarding the importance of SUA in the evaluations of the risks of atherosclerosis and CVD remain. Due to the relationship of SUA with other cardiovascular risk factors, including HTN and MetS, the observed associations of increased SUA levels with atherosclerosis and CVD might not be casual; rather, these associations might be the consequences of confounding effects [8]. For example, Iribarren et al.[9] demonstrated that the association between uric acid and carotid atherosclerosis did not remain significant when adjustments for concomitant risk factors for atherosclerosis were made. Moreover, an anti-oxidant role of uric acid has been suggested based on in-vivo experiments and is thought to be protective against atherogenesis, but uric acid can also be a pro-oxidant that could be harmful to arteries depending on the chemical microenvironment [10]. Furthermore, in people with type 2 diabetes, the roles of uric acid in atherosclerosis and CVD might be affected by other interactive risk factors that are related to atherosclerosis and CVD. Thus, the relationship between SUA and atherosclerosis might vary across different populations, such as those with type 2 diabetes.
Furthermore, although many previous studies have investigated the associations of SUA with HTN, MetS and atherosclerosis, few studies of Chinese patients with type 2 diabetes are currently available. Moreover, the data regarding the relationship between SUA and lower limb atherosclerotic lesions in type 2 diabetes are not well established.
Therefore, the main aims of this study were to comprehensively examine the relationships of SUA with HTN, MetS and atherosclerotic lesions in a hospital-based population with type 2 diabetes in terms of carotid intima-media thickness (CIMT), femoral IMT (FIMT), atherosclerotic plaque and stenosis.
METHODS
Patients and study design
The current study was cross-sectional and based partly on data from our previous studies [11–15]. In brief, between January 2007 and June 2009, 3598 inpatients with type 2 diabetes in our department were consecutively observed. The patients taking any drug that might interfere with uric acid metabolism, such as allopurinol, losartan and furosemide, were excluded regardless of the duration they had been taking the drug. The patients who did not undergo carotid and lower limb ultrasound examination and without complete clinical data were also excluded. In total, 2388 patients including 1327 men and 1061 women were included in the final analyses.
All patients underwent an interview and provided a history of HTN, cardio-cerebrovascular events (CCEs), the use of lipid-lowering drugs (LLDs) and antihypertensive agents (AHAs), alcohol consumption and smoking habits. CCEs, smoking status and alcohol use were defined according to our previous criteria [11–13,15]. The study was approved by the ethics committee of Shanghai Jiao Tong University Affiliated Sixth People's Hospital, and written informed consent was obtained from all patients.
Physical examination and laboratory measurements
The physical examinations and laboratory measurements used in the present study have been described previously in detail [11–15]. In brief, the physical examinations included measurements of weight, height, waist circumference, hip circumference and blood pressure. The BMI was calculated as the weight divided by the height squared. The waist-to-hip ratio (WHR) was calculated as the waist circumference divided by the hip circumference. The laboratory measurements included glycosylated hemoglobin A1C (HbA1c), fasting plasma glucose (FPG), 2-h postprandial plasma glucose (2h PPG), fasting C-peptide (FCP), 2-h postprandial C-peptide (2h PCP), total triglycerides, total cholesterol (TC), high-density lipoprotein cholesterol (HDL-C), low-density lipoprotein cholesterol (LDL-C), aspartate aminotransferase (ALT), creatinine, SUA, and C-reactive protein (CRP).
The 24-h urinary albumin excretion (UAE) was determined as the mean of the values obtained from three separate, early-morning urine samples during the period of hospitalization. The estimated glomerular filtration rate (eGFR) was calculated using the simplified Modification of Diet in Renal Disease (MDRD) formula: eGFR = 186.3 × (serum creatinine)−1.154 × (age)−0.203 × (0.742 if female).
Ultrasonography measurements
Both the carotid and lower limb arteries were subjected to Doppler ultrasound examinations that include measurements of IMT, atherosclerotic plaque and stenosis as described in previous studies in detail [11–15]. The definitions of CIMT, FIMT, carotid and lower limb atherosclerotic plaques and stenosis had also been described in detail in our previous studies [11–14,16]. In the present study, atherosclerotic plaque and stenosis were defined as the presence of either carotid or lower limb arterial atherosclerotic plaques and stenoses, respectively. The reproducibility of the measurements of carotid and lower limb atherosclerotic lesions had also been reported in our previous studies [12,14].
Definition of hyperuricemia and hypertension and metabolic syndrome
Hyperuricemia was defined as a SUA level at least 420 μmol/l for men and at least 360 μmol/l for women. According to our previous studies [11,12], HTN was defined by current treatment for HTN, a SBP at least 140 mmHg or a DBP at least 90 mmHg. According to the Seventh Joint National Committee (JNC-7) criteria [17], normal blood pressure was defined as a SBP below 120 mmHg and a DBP below 80 mmHg. Prehypertension was defined as a SBP between 120 and 139 mmHg, or a DBP between 80 and 89 mmHg. Stage 1 HTN was defined as a SBP between 140 and 159 mmHg or a DBP between 90 and 99 mmHg, and stage 2 HTN was defined as a SBP at least 160 mmHg or a DBP at least 100 mmHg. Because all of the patients had type 2 diabetes based on the updated National Cholesterol Education Program Adult Treatment Panel III criteria for Asian-Americans [18], MetS was defined as the presence of two or more of the following components: a waist circumference at least 90 cm in men and at least 80 cm in women; total triglycerides at least 1.7 mmol/l; HDL-C below 1.03 mmol/l in men and below 1.30 mmol/l in women; and the presence of HTN.
Statistical analyses
The study data were analyzed using SPSS 15.0 for Windows (Chicago, Illinois, USA). The data are expressed as mean ± SD percentages or medians (interquartile range 25–75%) in the cases of skewed distributions. For continuous and normally distributed variables, one-way analysis of variances (ANOVAs) with least significant difference (LSD) tests were used to compare the data between the four groups. For data that were not distributed normally, the Mann–Whitney U test and the Kruskal–Wallis H test were used. The chi-square test was used to compare the prevalence data. A univariate regression model was used to compare the means of the continuous variables and to examine the association of SUA quartiles with the CIMT and FIMT while adjusting for other factors. A binary logistic regression analysis was performed to examine the associations of the SUA quartiles with HTN, MetS, atherosclerotic plaque and stenosis. An ordinal logistic regression analysis was performed to investigate the associations of the SUA quartiles with the MetS components and stages of HTN. In both all patients and the patients without overt CVD, three models were constructed to assess the associations of the SUA quartiles with HTN and MetS by logistic regression: model 1 included adjustments for age, sex, duration of diabetes, smoking status and alcohol drinking; model 2 included additional adjustments for WHR, BMI (HTN) and for SBP, DBP, WHR and BMI (MetS); and model 3 included additional adjustments for laboratory results, including ALT, TC, total triglycerides, LDL-C, HDL-C, creatinine, eGFR, UAE, CRP, HbA1C, FCP, 2h PCP, FPG and 2h PPG (HTN), and ALT, TC, LDL-C, creatinine, eGFR, UAE, CRP, HbA1C, FCP, 2h PCP, FPG and 2h PPG (MetS). P values less than 0.05 were considered to be statistically significant.
RESULTS
Characteristics of the patients according to serum uric acid quartiles
The demographic and clinical characteristics of the patients grouped by SUA quartiles are illustrated in Table 1. There were no significant age differences between the SUA quartiles. The patients in the higher SUA quartiles were more likely to be men and smokers. After controlling for sex, the patients with diabetes in the higher SUA quartiles exhibited higher prevalences of HTN and CCEs, higher SBP, DBP, BMI, WHR, FCP, 2h PCP, total triglycerides, TC, ALT, creatinine, UAE and CRP, and lower FPG, HbA1C, HDL-C and eGFR.
TABLE 1.
Characteristics of the patients according to serum uric acid quartiles
| Variables | Q1 (n = 601) | Q2 (n = 599) | Q3 (n = 592) | Q4 (n = 596) | P value | *P value |
| SUA (μmol/l) | ≤256 | 257–310 | 311–373 | >373 | – | – |
| Age (years) | 59.3 ± 11.7 | 59.2 ± 11.6 | 59.5 ± 12.3 | 59.4 ± 12.9 | 0.984 | 0.302 |
| Male (n, %) | 241(40.1%) | 305 (50.9%) | 366 (61.8%) | 415 (69.6%) | <0.001 | <0.001 |
| *DD (months) | 84 (12–144) | 96 (30–144) | 72 (24–144) | 72 (24–132) | 0.134 | 0.289 |
| Smoking (n, %) | 134 (22.3%) | 176 (29.4%) | 174 (29.4%) | 199 (33.4%) | <0.001 | 0.070 |
| Alcohol (n, %) | 62 (10.3%) | 88 (14.7%) | 99 (16.7%) | 118 (19.8%) | <0.001 | 0.693 |
| Hypertension (n, %) | 261 (43.4%) | 297 (49.6%) | 332 (56.1%) | 395 (66.3%) | <0.001 | <0.001 |
| CCEs (n, %) | 62 (10.3%) | 87 (14.5%) | 84 (14.2%) | 101 (16.9%) | 0.011 | 0.005 |
| LLD (n, %) | 142 (23.6%) | 173 (28.9%) | 188 (31.8%) | 249 (41.8%) | <0.001 | <0.001 |
| AHAs (n, %) | 231 (38.4%) | 269 (44.9%) | 299 (50.5%) | 368 (61.7) | <0.001 | <0.001 |
| SBP (mmHg) | 131 ± 17 | 131 ± 17 | 133 ± 18 | 134 ± 17 | 0.001 | <0.001 |
| DBP (mmHg) | 79 ± 10 | 79 ± 9 | 81 ± 10 | 81 ± 10 | <0.001 | <0.001 |
| BMI (kg/m2) | 23.6 ± 3.5 | 24.4 ± 3.2 | 25.2 ± 3.3 | 26.3 ± 3.3 | <0.001 | <0.001 |
| WHR | 0.89 ± 0.07 | 0.91 ± 0.06 | 0.92 ± 0.06 | 0.93 ± 0.06 | <0.001 | <0.001 |
| *FPG (mmol/l) | 8.1 (6.3–10.4) | 7.9 (6.2–9.7) | 7.5 (6–9.4) | 7.5 (6.2–9.3) | 0.002 | 0.005 |
| *2h PPG (mmol/l) | 14.4 (10.6–17.5) | 13.4 (9.9–16.8) | 13.1 (9.9–16.3) | 13.3 (9.9–16.8) | 0.021 | 0.118 |
| HbA1C (%) | 9.8 ± 2.5 | 9.2 ± 2.4 | 8.9 ± 2.3 | 8.6 ± 2.2 | <0.001 | <0.001 |
| *FCP (ng/ml) | 1.28 (0.76–1.9) | 1.5 (0.85–2.3) | 1.79 (1.15–2.45) | 2.11 (1.41–3.08) | <0.001 | <0.001 |
| *2h PCP (ng/ml) | 2.69 (1.54–4.45) | 3.33 (1.83–5.06) | 4.07 (2.38–5.58) | 4.65 (2.95–5.77) | <0.001 | <0.001 |
| *TTG (mmol/l) | 1.2 (0.86–1.69) | 1.34 (0.95–1.95) | 1.46 (1.01–2.18) | 1.94 (1.31–2.77) | <0.001 | <0.001 |
| TC (mmol/l) | 4.69 ± 1.14 | 4.69 ± 1.18 | 4.72 ± 1.06 | 4.85 ± 1.19 | 0.050 | 0.001 |
| HDL-C (mmol/l) | 1.21 ± 0.32 | 1.15 ± 0.34 | 1.08 ± 0.26 | 1.03 ± 0.26 | <0.001 | <0.001 |
| LDL-C (mmol/l) | 3.11 ± 0.96 | 3.09 ± 1 | 3.12 ± 0.9 | 3.13 ± 0.97 | 0.886 | 0.457 |
| *ALT (U/l) | 17 (12–27) | 19 (13–28) | 20 (14–31) | 22 (15–35.8) | <0.001 | <0.001 |
| *Cr (μmol/l) | 57 (49–68) | 64 (54–75) | 70 (58–81) | 78 (65–95) | <0.001 | <0.001 |
| *UAE (mg/24 h) | 10.4 (6.4–22.6) | 9.8 (6.2–21.1) | 10.7 (6.4–27.4) | 16.2 (7.3–70.8) | <0.001 | <0.001 |
| *eGFR (ml/min per 1.73 m2) | 111 (94–133) | 103 (88–121) | 97 (83–113) | 89 (70–108) | <0.001 | <0.001 |
| *CRP (mg/l) | 0.95 (0.36–2.39) | 1.07 (0.45–2.48) | 1.15 (0.48–2.74) | 1.38 (0.63–3.49) | <0.001 | 0.061 |
Values are expressed as the mean ± SD, or median with interquartile range, or percentages. AHA, antihypertensive agent; ALT, aspartate aminotransferase; CCEs, cardio-cerebrovascular events; Cr, creatinine; CRP, C-reactive protein; DD, duration of diabetes; eGFR, estimated glomerular filtration; FCP, fasting C-peptide; FPG, fasting plasma glucose; HDL-C, high-density lipoprotein cholesterol; LDL-C, low-density lipoprotein cholesterol; LLD, lipid-lowering drug; PCP, postprandial C-peptide; PPG, postprandial plasma glucose; SUA, serum uric acid; TC, total cholesterol; TTG, total triglycerides; UAE, urinary albumin excretion; WHR, waist-to-hip ratio. *Non-normal distribution of continuous variables. P value: The P values were not adjusted for sex for the trend. *P value: The *P values were adjusted for sex for the trend.
Comparison of hypertension between the serum uric acid quartile groups
Figure 1 displays the comparison of HTN between the SUA quartile groups with type 2 diabetes after adjusting for age, sex, duration of diabetes, alcohol drinking and smoking. The prevalence of HTN significantly increased with the increasing SUA quartile in the type 2 diabetes patients (43.4, 49.6, 56.1 and 66.3% for the first, second, third and fourth quartiles, respectively; P < 0.001) (Fig. 1a). Moreover, the SUA levels were lower in the patients with normal blood pressures compared to the patients with prehypertension, stage 1 and stage 2 HTN (288 ± 81, 306 ± 85, 331 ± 90 and 337 ± 96 μmol/l for the patients with normal blood pressures, prehypertension, stage 1 and stage 2 HTN, respectively), but no significant difference was present after controlling for age, sex, duration of diabetes, alcohol drinking and smoking (P = 0.211) (Fig. 1b). Interestingly, there was a marked increase in the percentages of the patients with stage 2 HTN across the SUA quartiles and a significant decrease in the percentages of the patients with prehypertension across the SUA quartiles (P < 0.001) (Fig. 1c).
FIGURE 1.

(a) Comparison of the prevalence of HTN among the four SUA quartile groups after controlling for other confounding factors. (b) Comparison of SUA levels according to the stages of HTN after adjusting for other confounding factors. (c) Comparison of the prevalence of different stages of HTN among the four SUA quartile groups after controlling for other confounding factors.
Comparison of metabolic syndrome between the serum uric acid quartile groups
Figure 2 shows the comparison of MetS across the SUA quartile groups with type 2 diabetes after adjusting for age, sex, duration of diabetes, alcohol drinking and smoking. Similar to HTN, the SUA quartiles were significantly correlated with the prevalence of MetS (59.9, 68.8, 74.7 and 85.1% for the first, second, third and fourth quartiles, respectively; P < 0.001) in the patients with type 2 diabetes (Fig. 2a). Remarkably, the SUA levels increased gradually with increasing numbers of MetS components (276 ± 73, 293 ± 81, 312 ± 83, 334 ± 94, and 358 ± 94 μmol/l, respectively; P < 0.001) (Fig. 2b). Interestingly, the people with diabetes in the higher SUA quartiles were more likely to exhibit four or five MetS components and less likely to exhibit one, two or three MetS components (P < 0.001) (Fig. 2c).
FIGURE 2.
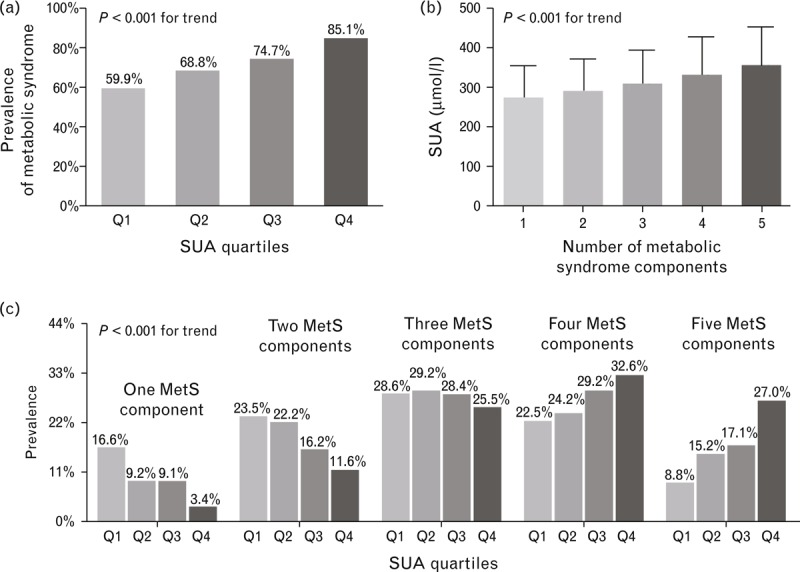
(a) Comparison of the prevalence of MetS between the four SUA quartile groups after controlling for other confounding factors. (b) Comparison of SUA levels according to the number of MetS components after controlling for other confounding factors. (c) Comparison of the prevalence of different numbers of MetS components between the four SUA quartile groups after adjusting for other confounding factors.
Comparison of the atherosclerotic lesions of the serum uric acid quartile groups
The comparison of the atherosclerotic lesions, including CIMT, FIMT, atherosclerotic plaque and stenosis, between the SUA quartile groups after adjusting for age, sex, duration of diabetes, alcohol drinking and smoking is shown in Fig. 3. There were no significant differences in the CIMT or FIMT values or the prevalence of atherosclerotic plaques and stenosis across the four groups (Fig. 3a–d).
FIGURE 3.

(a) Comparison of the CIMT values between the four SUA quartile groups after adjusting for other confounding factors. (b) Comparison of the FIMT values between the four SUA quartile groups after controlling for other confounding factors. (c) Comparison of the prevalence of atherosclerotic plaques between the four SUA quartile groups after adjusting for other confounding factors. (d) Comparison of the prevalence of atherosclerotic stenosis between the four SUA quartile groups after controlling for other confounding factors.
Associations of the serum uric acid quartiles with hypertension and metabolic syndrome
Table 2 presents the associations of the SUA quartiles with HTN and MetS in all patients with type 2 diabetes. After controlling for multiple confounding factors, SUA quartiles were independently associated with increased prevalences of HTN and MetS in the patients with type 2 diabetes. The odds ratios (ORs) for HTN increased with increasing SUA quartiles (P < 0.001 in models 1 and 2, and P = 0.001 in model 3). In the highest SUA quartile, the OR was 1.82 [95% confidence interval (CI) 1.35–2.47] for HTN after controlling for multiple confounding factors (model 3). Similarly, the ORs for MetS were also higher in the higher SUA quartiles (P < 0.001 in models 1 and 2, and P = 0.006 in model 3). In the highest SUA quartile, the OR was 1.99 (95% CI 1.30–3.03) for MetS (model 3).
TABLE 2.
Association of serum uric acid quartiles with hypertension and metabolic syndrome
| ORs (95% CI) | P values for trend | ||||
| Q1 | Q2 | Q3 | Q4 | ||
| Hypertension | |||||
| Model 1* | 1 | 1.35 (1.06–1.72) | 1.90 (1.49–2.43) | 3.13 (2.42–4.04) | <0.001 |
| Model 2* | 1 | 1.20 (0.93–1.55) | 1.56 (1.20–2.03) | 2.11 (1.60–2.78) | <0.001 |
| Model 3* | 1 | 1.12 (0.85–1.49) | 1.43 (1.07–1.9) | 1.82 (1.35–2.47) | 0.001 |
| Metabolic syndrome | |||||
| Model 1# | 1 | 1.70 (1.31–2.2) | 2.80 (2.13–3.69) | 6.30 (4.59–8.64) | <0.001 |
| Model 2# | 1 | 1.41 (1.03–1.94) | 1.80 (1.28–2.52) | 2.60 (1.79–3.77) | <0.001 |
| Model 3# | 1 | 1.31 (0.92–1.87) | 1.71 (1.17–2.51) | 1.99 (1.30–3.03) | 0.006 |
Model 1* adjusted for age, sex, duration of diabetes, smoking and alcohol drinking. Model 2* further adjusted for WHR and BMI. Model 3* further adjusted for ALT, TC, TTG, LDL-C, HDL-C, Cr, eGFR, UAE, CRP, HbA1c, FCP, 2h PCP, FPG, 2h PPG. Model 1# adjusted for age, sex, duration of diabetes, smoking and alcohol drinking. Model 2# further adjusted for SBP, DBP, WHR and BMI. Model 3# further adjusted for ALT, TC, LDL-C, Cr, eGFR, UAE, CRP, HbA1c, FCP, 2h PCP, FPG, 2h PPG. 2h PPG, 2-h postprandial plasma glucose; 2h PCP, 2-h postprandial C-peptide; ALT, aspartate aminotransferase; CI, confidence interval; Cr, creatinine; CRP, C-reactive protein; eGFR, estimated glomerular filtration rate; FCP, fasting C-peptide; FPG, fasting plasma glucose; HbA1c, glycosylated haemoglobin; HDL-C, high-density lipoprotein cholesterol; LDL-C, low-density lipoprotein cholesterol; OR, odds ratio; SUA, serum uric acid; TC, total cholesterol; TTG, total triglyceride; UAE, urinary albumin excretion; WHR, waist-to-hip ratio.
Similarly, in the patients without overt CVD, after controlling for multiple confounding factors, SUA quartiles were still independently associated with increased prevalences of HTN and MetS (Table S1). In the highest SUA quartile, the OR was 1.75 (95% CI 1.27–2.40) for HTN after controlling for multiple confounding factors (model 3). In the highest SUA quartile, the OR was 1.78 (95% CI 1.14–2.79) for MetS (model 3).
Comparisons of atherosclerotic lesions between the patients with and without HTN, metabolic syndrome and hyperuricemia
The comparisons of atherosclerotic lesions between the patients with and without HTN or MetS or hyperuricemia are demonstrated in Fig. 4. After adjusting for age, sex, duration of diabetes, alcohol drinking and smoking, the prevalence of atherosclerotic plaque and stenosis in the patients with HTN was significantly higher than that of the patients without HTN (P = 0.016 for plaque, and P < 0.001 for stenosis) (Fig. 4a). Similarly, the prevalence of atherosclerotic stenosis in the patients with MetS was also markedly higher than that of the patients without MetS (P = 0.024) (Fig. 4c). Neither the CIMT nor the FIMT values were markedly different between the patients with and without either HTN or MetS (Fig. 4b and d). However, there was no significant difference in atherosclerotic lesions between the patients with and without hyperuricemia (Fig. 4e and f).
FIGURE 4.

(a, b) Comparison of atherosclerotic lesions between the patients with and without HTN after adjusting for other confounding factors. (c, d) Comparison of atherosclerotic lesions between the patients with and without MetS after controlling for other confounding factors. (e, f) Comparison of atherosclerotic lesions between the patients with and without hyperuricemia (HU) after adjusting for other confounding factors.
DISCUSSION
In the past decades, multiple clinical and epidemiological studies have repeatedly demonstrated the clear and strong links between SUA, HTN and MetS. In contrast, the results regarding the associations of SUA with atherosclerosis and CVD from different studies have been conflicting. Therefore, the independence of the associations of hyperuricemia with atherosclerosis and CVD has remained controversial. For example, several investigators have reported that elevated SUA levels are independent predictors of atherosclerosis, CVD and mortality in different populations [7,19–21]. However, other researchers have failed to confirm such links in several epidemiological studies and argued that these associations are not causal, but epiphenomenal, and result from a coexistence with other cardiovascular risk factors, such as obesity, MetS and chronic kidney disease [22–25].
Therefore, we performed a hospital-based cross-sectional study of the associations of SUA with HTN, MetS and atherosclerotic lesions in type 2 diabetes. In the previous studies, we found that carotid atherosclerosis underestimates generalized atherosclerosis, and that combining carotid and lower limb ultrasound examinations can improve the detection of atherosclerotic lesions in patients with type 2 diabetes [11,14]. Therefore, in the present study, we not only used carotid atherosclerotic lesions but also examined lower limb atherosclerotic lesions as indicators of atherosclerosis.
We observed strong associations of SUA levels with the presence of HTN and MetS, but not with the presence of atherosclerotic lesions, in type 2 diabetes. These associations were independent of other atherosclerotic risk factors, such as age, BMI and eGFR. Even in the patients without overt CVD, the associations of SUA levels with the presence of HTN and MetS were still relatively independent. Our findings demonstrate the independent pathogenetic role of uric acid in HTN. Indeed, even in the multiple regression analysis, the SUA levels were closely correlated with the presence of HTN. Interestingly, we also found that there was a significant increase in the prevalence of stage 2 HTN, but a marked decrease in the prevalence of prehypertension across the SUA quartiles; these findings indicate that SUA levels might also be related to the severity of HTN. Many investigators have confirmed that SUA levels are independently associated with the presence of HTN [1,2,26]. A recent meta-analysis also showed that hyperuricemia predicts the development of HTN independent of classic HTN risk factors [27]. Our results accord with the findings of these studies. Furthermore, experimental studies have also supported the potential roles of uric acid in the pathogenesis of HTN [28]. Moreover, in both animal and human studies, researchers have demonstrated that allopurinol treatment can result in decreases in blood pressure [28–30]. The mechanism by which uric acid causes HTN might involve the inhibition of the release of endothelial nitric oxide and the activation of the vascular rennin–angiotensin system, which lead to renal vasoconstriction and elevated blood pressure [26].
Consistent with the previous studies [3–5,31], we also found a strong relationship between SUA levels and MetS, and we observed a substantially elevated risk of MetS in the higher SUA quartiles compared to the lower SUA quartiles. Additionally, we also found that SUA levels steadily increased with the number of MetS components (P < 0.001). Moreover, the patients in the higher SUA quartiles had greater numbers of MetS components than did the patients in the lower SUA quartiles. Although the precise mechanisms underlying the association between SUA and MetS remain still largely unknown, hyperuricemia may be partially responsible for inflammatory imbalances in adipose tissues that lead to low-grade inflammation and insulin resistance [32]. In contrast, reduced uric acid can decrease macrophage infiltration and improve inflammatory imbalances in the adipose tissues of obese mice and can also reduce insulin resistance. Consistent with this view, we also observed that CRP levels gradually increased with SUA quartiles in the present study (P = 0.061), which indicates that uric acid may modulate chronic inflammatory processes in type 2 diabetes. Given that low-grade inflammation and insulin resistance are two important risks factors for MetS, uric acid may play a key role in the pathogenesis of MetS that is partially mediated by an inflammatory pathway. Additionally, Nakagawa et al.[33] reported that uric acid might play a causal pathogenetic role in the cause of MetS that could possibly be mediated by the inhibition of endothelial function.
The absence of a relationship between SUA and atherosclerotic lesions in our study population should be addressed. Although many studies have suggested that hyperuricemia is an independent risk factor for atherosclerosis and CVD [5–7,34], some trials have reported that uric acid is not an independent risk factor for atherosclerosis and CVD [9,24,35]. For example, in the Atherosclerosis Risk in Communities (ARIC) study, the investigators showed that the association between SUA and CIMT was statistically significant in women and white men, but not in black men [9]. However, this association was no longer statistically significant after further adjustments for known risk factors for atherosclerotic disease [9]. Thus, these authors concluded that SUA itself may not be a risk factor for carotid atherosclerosis and that the association between SUA and CIMT is not truly independent [9]. In a recent study, SUA appeared to be significantly correlated with carotid IMT, but not with the prevalence of carotid plaques or aortic stiffness [26]. Similar to the above studies, we failed to observe an independent association between SUA and atherosclerotic lesions in type 2 diabetes in the present study. Furthermore, the meta-analyses of the association between uric acid and CVD remain controversial and include both positive and negative reports [36,37].
Another interesting finding of the present study is that only HTN and MetS, and not hyperuricemia, were positively associated with atherosclerotic lesions in type 2 diabetes. The people with diabetes with either HTN or MetS exhibited higher prevalences of atherosclerotic plaque and stenosis compared to those without either HTN or MetS. Interestingly, there was no significant difference in atherosclerotic lesions between the diabetes patients with and without hyperuricemia. Therefore, uric acid may play an indirect role in the pathogenesis of atherosclerosis and CVD via other cardiovascular risk factors, such as HTN and MetS.
The disparities in the associations between SUA and atherosclerosis reported by different studies, including our own, are conceivable and might be partly due to the following reasons. First, uric acid not only has several anti-oxidant properties, including the clearance of oxygen radicals and the chelation of metals, but also has pro-oxidant features, such as reducing of nitric oxide bioavailability and increasing reactive oxygen species production; the pro- or anti-oxidant features of uric acid depend on its chemical microenvironment [10]. Thus, uric acid can have different roles in atherosclerosis depending on the chemical microenvironment. Therefore, uric acid may be differentially associated with different atherosclerotic lesions and metabolic patterns in different populations. Additionally, the methodological and analytical differences and the different characteristics of study populations might have resulted in the discrepancies. For example, many studies only investigated carotid atherosclerosis, but we examined both the carotid and lower limb arteries with ultrasonography. Furthermore, in our study of hospitalized patients with type 2 diabetes, the patients presented in more severe conditions as indicated by the high prevalence of atherosclerotic plaque and stenosis. This difference might partially explain the absence of an association between SUA and atherosclerotic lesions, which became nonsignificant after adjusting only for age and sex. Therefore, it is possible that SUA is an independent risk factor for atherosclerosis only in selected populations, such as those without MetS [34].
There are several limitations of this study. Because the participants were Chinese patients with type 2 diabetes, the results may not be generalizable to other ethnic groups and other populations. Moreover, many cardiovascular risk factors, such as obesity and hyperlipemia, can accumulate in patients with type 2 diabetes and might affect the role of SUA in the incidence of atherosclerosis and CVD. Therefore, the present results might not be representative of the general population. The other limitation is that type 2 diabetes is an accumulation of metabolic disorders, such as obesity and dyslipidemia; thus, it is somewhat artificial to examine the MetS and components of the MetS. Finally, the cross-sectional nature of the study precluded analysis of the cause–effect relationships. The mechanisms underlying these associations remain to be explored. Prospective studies are needed to determine the relationships of SUA with HTN, MetS and atherosclerosis.
In conclusion, the findings of this study strongly suggest that uric acid has independent effects on the development of HTN and MetS, but is not an independent risk factor for atherosclerosis in Chinese hospitalized patients with type 2 diabetes. In contrast to hyperuricemia, both HTN and MetS are closely correlated with atherosclerotic lesions in type 2 diabetes. In selected populations, such as those with type 2 diabetes, the association between SUA and atherosclerosis might be attributable to other cardiovascular risk factors, such as HTN and MetS. Prospective studies are required to clarify the causal associations of SUA with HTN, MetS and atherosclerosis in type 2 diabetes.
ACKNOWLEDGEMENTS
We thank the other investigators, the staff and the participants of the present study for their valuable contributions.
The work was supported by grants from the National Natural Science Foundation of China (81170759), the National Natural Science Foundation of China for young scientists (30900703), and the Key Discipline of Public Health of Shanghai (Epidemiology) (12GWZX0104).
Conflicts of interest
There are no conflicts of interest.
Supplementary Material
Reviewers’ Summary Evaluations
Reviewer 1
The major strength of the paper is the size of the population and the nature of the primary objective, which attempts to correlate serum uric acid with atherosclerotic disease. The cross-sectional nature of the study design is the most obvious limitation as well as focusing on a specific population of patients, which greatly reduces the generalizability of the findings.
Reviewer 2
In this paper Lian-Xi Li and colleagues studied the association between uric acid levels and cardiovascular risk factors in a selected cohort of hospitalised patients with diabetes. The main strength of the paper is the detailed characterisation of vascular phenotypes in these patients. Therefore the authors can draw conclusions on the relationship between uric acid and atherosclerosis. The cross-sectional nature of the present work is, however, its main weakness, and direct effects of uric acid or enzymes involved in uric acid synthesis on atherosclerosis cannot be firmly excluded from these data.
Footnotes
Abbreviations: 2h PPG, 2-h postprandial plasma glucose, 2h PCP; 2-h postprandial C-peptide, AHA; antihypertensive agent, ALT; aspartate aminotransferase, CCEs; cardio-cerebrovascular events, CIMT; carotid intima–media thickness, CRP; C-reactive protein, CVD; cardiovascular disease, eGFR; estimated glomerular filtration rate, FCP; fasting C-peptide, FIMT; femoral intima–media thickness, FPG; fasting plasma glucose, HbA1c; glycosylated hemoglobin, HDL-C; high-density lipoprotein cholesterol, HTN; hypertension, JNC; Joint National Committee, LDL-C; low-density lipoprotein cholesterol, LLD; lipid-lowering drug, LSD; least significant difference, MDRD; Modification of Diet in Renal Disease, MetS; metabolic syndrome, SUA; serum uric acid, TC; total cholesterol, UAE; urinary albumin excretion, WHR; waist-to-hip ratio
REFERENCES
- 1.Taniguchi Y, Hayashi T, Tsumura K, Endo G, Fujii S, Okada K. Serum uric acid and the risk for hypertension and Type 2 diabetes in Japanese men: The Osaka Health Survey. J Hypertens 2001; 19:1209–1215. [DOI] [PubMed] [Google Scholar]
- 2.Mellen PB, Bleyer AJ, Erlinger TP, Evans GW, Nieto FJ, Wagenknecht LE, et al. Serum uric acid predicts incident hypertension in a biethnic cohort: the atherosclerosis risk in communities study. Hypertension 2006; 48:1037–1042. [DOI] [PubMed] [Google Scholar]
- 3.Yang T, Chu CH, Bai CH, You SL, Chou YC, Chou WY, et al. Uric acid level as a risk marker for metabolic syndrome: a Chinese cohort study. Atherosclerosis 2012; 220:525–531. [DOI] [PubMed] [Google Scholar]
- 4.Kim ES, Kwon HS, Ahn CW, Lim DJ, Shin JA, Lee SH, et al. Serum uric acid level is associated with metabolic syndrome and microalbuminuria in Korean patients with type 2 diabetes mellitus. J Diabetes Complications 2011; 25:309–313. [DOI] [PubMed] [Google Scholar]
- 5.Li Q, Yang Z, Lu B, Wen J, Ye Z, Chen L, et al. Serum uric acid level and its association with metabolic syndrome and carotid atherosclerosis in patients with type 2 diabetes. Cardiovasc Diabetol 2011; 10:72. [DOI] [PMC free article] [PubMed] [Google Scholar]
- 6.Brodov Y, Behar S, Boyko V, Chouraqui P. Effect of the metabolic syndrome and hyperuricemia on outcome in patients with coronary artery disease (from the Bezafibrate Infarction Prevention Study). Am J Cardiol 2010; 106:1717–1720. [DOI] [PubMed] [Google Scholar]
- 7.Ishizaka N, Ishizaka Y, Toda E, Nagai R, Yamakado M. Association between serum uric acid, metabolic syndrome, and carotid atherosclerosis in Japanese individuals. Arterioscler Thromb Vasc Biol 2005; 25:1038–1044. [DOI] [PubMed] [Google Scholar]
- 8.Rich MW. Uric acid: is it a risk factor for cardiovascular disease. Am J Cardiol 2000; 85:1018–1021. [DOI] [PubMed] [Google Scholar]
- 9.Iribarren C, Folsom AR, Eckfeldt JH, McGovern PG, Nieto FJ. Correlates of uric acid and its association with asymptomatic carotid atherosclerosis: the ARIC Study. Atherosclerosis Risk in Communities. Ann Epidemiol 1996; 6:331–340. [DOI] [PubMed] [Google Scholar]
- 10.So A, Thorens B. Uric acid transport and disease. J Clin Invest 2010; 120:1791–1799. [DOI] [PMC free article] [PubMed] [Google Scholar]
- 11.Li L, Yu H, Zhu J, Wu X, Liu F, Zhang F, et al. The combination of carotid and lower extremity ultrasonography increases the detection of atherosclerosis in type 2 diabetes patients. J Diabetes Complications 2012; 26:23–28. [DOI] [PubMed] [Google Scholar]
- 12.Li LX, Zhao CC, Ren Y, Tu YF, Lu JX, Wu X, et al. Prevalence and clinical characteristics of carotid atherosclerosis in newly diagnosed patients with ketosis-onset diabetes: a cross-sectional study. Cardiovasc Diabetol 2013; 12:18. [DOI] [PMC free article] [PubMed] [Google Scholar]
- 13.Li LX, Li MF, Lu JX, Jia LL, Zhang R, Zhao CC, et al. Retinal microvascular abnormalities are associated with early carotid atherosclerotic lesions in hospitalized Chinese patients with type 2 diabetes mellitus. J Diabetes Complications 2014; 28:378–385. [DOI] [PubMed] [Google Scholar]
- 14.Li LX, Wu X, Lu JX, Tu YF, Yu LB, Li MF, et al. Comparison of carotid and lower limb atherosclerotic lesions in both previously known and newly diagnosed type 2 diabetes mellitus. J Diabetes Investig 2014; doi: 10.1111/jdi.12204. [DOI] [PMC free article] [PubMed] [Google Scholar]
- 15.Li MF, Ren Y, Zhao CC, Zhang R, Li LX, Liu F, et al. Prevalence and clinical characteristics of lower limb atherosclerotic lesions in newly diagnosed patients with ketosis-onset diabetes: a cross-sectional study. Diabetol Metab Syndr 2014; 6:71. [DOI] [PMC free article] [PubMed] [Google Scholar]
- 16.Li MF, Tu YF, Li LX, Lu JX, Dong XH, Yu LB, et al. Low-grade albuminuria is associated with early but not late carotid atherosclerotic lesions in community-based patients with type 2 diabetes. Cardiovasc Diabetol 2013; 12:110. [DOI] [PMC free article] [PubMed] [Google Scholar]
- 17.Chobanian AV, Bakris GL, Black HR, Cushman WC, Green LA, Izzo JL, Jr, et al. Seventh report of the Joint National Committee on Prevention, Detection, Evaluation, and Treatment of High Blood Pressure. Hypertension 2003; 42:1206–1252. [DOI] [PubMed] [Google Scholar]
- 18.Grundy SM, Cleeman JI, Daniels SR, Donato KA, Eckel RH, Franklin BA, et al. Diagnosis and management of the metabolic syndrome: an American Heart Association/National Heart, Lung, and Blood Institute Scientific Statement. Circulation 2005; 112:2735–2752. [DOI] [PubMed] [Google Scholar]
- 19.Silbernagel G, Hoffmann MM, Grammer TB, Boehm BO, Marz W. Uric acid is predictive of cardiovascular mortality and sudden cardiac death in subjects referred for coronary angiography. Nutr Metab Cardiovasc Dis 2013; 23:46–52. [DOI] [PubMed] [Google Scholar]
- 20.Gur M, Sahin DY, Elbasan Z, Kalkan GY, Yildiz A, Kaya Z, et al. Uric acid and high sensitive C-reactive protein are associated with subclinical thoracic aortic atherosclerosis. J Cardiol 2013; 61:144–148. [DOI] [PubMed] [Google Scholar]
- 21.Resl M, Clodi M, Neuhold S, Kromoser H, Riedl M, Vila G, et al. Serum uric acid is related to cardiovascular events and correlates with N-terminal pro-B-type natriuretic peptide and albuminuria in patients with diabetes mellitus. Diabet Med 2012; 29:721–725. [DOI] [PubMed] [Google Scholar]
- 22.Culleton BF, Larson MG, Kannel WB, Levy D. Serum uric acid and risk for cardiovascular disease and death: the Framingham Heart Study. Ann Intern Med 1999; 131:7–13. [DOI] [PubMed] [Google Scholar]
- 23.Moriarity JT, Folsom AR, Iribarren C, Nieto FJ, Rosamond WD. Serum uric acid and risk of coronary heart disease: Atherosclerosis Risk in Communities (ARIC) Study. Ann Epidemiol 2000; 10:136–143. [DOI] [PubMed] [Google Scholar]
- 24.Panero F, Gruden G, Perotto M, Fornengo P, Barutta F, Greco E, et al. Uric acid is not an independent predictor of cardiovascular mortality in type 2 diabetes: a population-based study. Atherosclerosis 2012; 221:183–188. [DOI] [PubMed] [Google Scholar]
- 25.Ford ES. Uric acid and mortality from all-causes and cardiovascular disease among adults with and without diagnosed diabetes: findings from the National Health and Nutrition Examination Survey III Linked Mortality Study. Diabetes Res Clin Pract 2011; 93:e84–e86. [DOI] [PubMed] [Google Scholar]
- 26.Cicero AF, Salvi P, D’Addato S, Rosticci M, Borghi C. Association between serum uric acid, hypertension, vascular stiffness and subclinical atherosclerosis: data from the Brisighella Heart Study. J Hypertens 2014; 32:57–64. [DOI] [PubMed] [Google Scholar]
- 27.Grayson PC, Kim SY, LaValley M, Choi HK. Hyperuricemia and incident hypertension: a systematic review and meta-analysis. Arthritis Care Res (Hoboken) 2011; 63:102–110. [DOI] [PMC free article] [PubMed] [Google Scholar]
- 28.Mazzali M, Hughes J, Kim YG, Jefferson JA, Kang DH, Gordon KL, et al. Elevated uric acid increases blood pressure in the rat by a novel crystal-independent mechanism. Hypertension 2001; 38:1101–1106. [DOI] [PubMed] [Google Scholar]
- 29.Kanbay M, Ozkara A, Selcoki Y, Isik B, Turgut F, Bavbek N, et al. Effect of treatment of hyperuricemia with allopurinol on blood pressure, creatinine clearence, and proteinuria in patients with normal renal functions. Int Urol Nephrol 2007; 39:1227–1233. [DOI] [PubMed] [Google Scholar]
- 30.Feig DI, Soletsky B, Johnson RJ. Effect of allopurinol on blood pressure of adolescents with newly diagnosed essential hypertension: a randomized trial. JAMA 2008; 300:924–932. [DOI] [PMC free article] [PubMed] [Google Scholar]
- 31.Zhang Z, Bian L, Choi Y. Serum uric acid: a marker of metabolic syndrome and subclinical atherosclerosis in Korean men. Angiology 2012; 63:420–428. [DOI] [PubMed] [Google Scholar]
- 32.Baldwin W, McRae S, Marek G, Wymer D, Pannu V, Baylis C, et al. Hyperuricemia as a mediator of the proinflammatory endocrine imbalance in the adipose tissue in a murine model of the metabolic syndrome. Diabetes 2011; 60:1258–1269. [DOI] [PMC free article] [PubMed] [Google Scholar]
- 33.Nakagawa T, Hu H, Zharikov S, Tuttle KR, Short RA, Glushakova O, et al. A causal role for uric acid in fructose-induced metabolic syndrome. Am J Physiol Renal Physiol 2006; 290:F625–631. [DOI] [PubMed] [Google Scholar]
- 34.Takayama S, Kawamoto R, Kusunoki T, Abe M, Onji M. Uric acid is an independent risk factor for carotid atherosclerosis in a Japanese elderly population without metabolic syndrome. Cardiovasc Diabetol 2012; 11:2. [DOI] [PMC free article] [PubMed] [Google Scholar]
- 35.Ong G, Davis WA, Davis TM. Serum uric acid does not predict cardiovascular or all-cause mortality in type 2 diabetes: the Fremantle Diabetes Study. Diabetologia 2010; 53:1288–1294. [DOI] [PubMed] [Google Scholar]
- 36.Kim SY, Guevara JP, Kim KM, Choi HK, Heitjan DF, Albert DA. Hyperuricemia and coronary heart disease: a systematic review and meta-analysis. Arthritis Care Res (Hoboken) 2010; 62:170–180. [DOI] [PMC free article] [PubMed] [Google Scholar]
- 37.Wheeler JG, Juzwishin KD, Eiriksdottir G, Gudnason V, Danesh J. Serum uric acid and coronary heart disease in 9,458 incident cases and 155,084 controls: prospective study and meta-analysis. PLoS Med 2005; 2:e76. [DOI] [PMC free article] [PubMed] [Google Scholar]
Associated Data
This section collects any data citations, data availability statements, or supplementary materials included in this article.