

Abstract
Aim
We aimed to establish a method to assess systemic and pre-systemic cytochrome P450 (CYP) 3A activity using ineffective microgram doses of midazolam.
Methods
In an open, one sequence, crossover study, 16 healthy participants received intravenous and oral midazolam at microgram (0.001 mg intravenous and 0.003 mg oral) and regular milligram (1 mg intravenous and 3 mg oral) doses to assess the linearity of plasma and urine pharmacokinetics.
Results
Dose-normalized AUC and Cmax were 37.1 ng ml−1 h [95% CI 35.5, 40.6] and 39.1 ng ml−1 [95% CI 30.4, 50.2] for the microdose and 39.0 ng ml−1 h [95% CI 36.1, 42.1] and 37.1 ng ml−1 [95% CI 26.9, 51.3] for the milligram dose. CLmet was 253 ml min−1 [95% CI 201, 318] vs. 278 ml min−1 [95% CI 248, 311] for intravenous doses and 1880 ml min−1 [95% CI 1590, 2230] vs. 2050 ml min−1 [95% CI 1720, 2450] for oral doses. Oral bioavailability of a midazolam microdose was 23.4% [95% CI 20.0, 27.3] vs. 20.9% [95% CI 17.1, 25.5] after the regular dose. Hepatic and gut extraction ratios for microgram doses were 0.44 [95% CI 0.39, 0.49] and 0.53 [95% CI 0.45, 0.63] and compared well with those for milligram doses (0.43 [95% CI 0.37, 0.49] and 0.61 [95% CI 0.53, 0.70]).
Conclusion
The pharmacokinetics of an intravenous midazolam microdose is linear to the applied regular doses and can be used to assess safely systemic CYP3A activity and, in combination with oral microdoses, pre-systemic CYP3A activity.
Keywords: CYP3A, microdosing, midazolam, phenotyping, UPLC/MS/MS
What is Already Known about this Subject
Midazolam pharmacokinetics of oral doses are linear over a 30 000-fold range.
An oral microdose of midazolam is suitable to measure total CYP3A activity.
CYP3A inhibition with strong inhibitors can be evaluated with a microdose in healthy volunteers and patients.
What this Study Adds
The pharmacokinetics of intravenous midazolam microdoses are linear to milligram doses.
The bioavailability and metabolic clearance of midazolam is similar after administration of microdoses and milligram doses.
Midazolam microdoses are a suitable tool to assess both systemic and pre-systemic CYP3A activity.
Introduction
The cytochrome P450 (CYP) gene family encodes >50 isozymes playing an important role in the clearance of drugs from the human body 1. CYP3A is the most abundant in the human liver and gut, accounting for 40% of total hepatic and 82% of total intestinal CYP content 2. Xenobiotics can act also as inducers or inhibitors of CYP3A thus modifying the exposure of the very numerous CYP3A substrates and, hence, their effectiveness and tolerability 3. Therefore, reliable and safe phenotyping strategies assessing CYP3A activity are needed.
The benzodiazepine midazolam is the paradigm marker substrate for the in vivo assessment of CYP3A activity recommended by the FDA and EMA 4,5. For this purpose it is particularly well suited because it is almost exclusively metabolized by CYP3A to 1'-OH-midazolam 6. In the subsequent UDP-glucuronosyltransferase (UGT)-mediated phase II-reaction the main urinary metabolite 1'-OH-midazolam-glucuronide is formed 7; 63–80% of the dose is found conjugated in the urine within 24 h, while only 1% is excreted unchanged 8. The most predictive and reliable parameter for in vivo CYP3A activity is the metabolic clearance (CLmet) to 1'-OH-midazolam 9.
The total CYP3A activity can be assessed using oral midazolam whereas the use of intravenous midazolam allows the measurement of systemic CYP3A activity 9. Usually CYP3A activity is measured before and during treatment with a potential perpetrator drug 4,5. The EMA recommends the use of intravenously administered midazolam to investigate effects on systemic CYP3A catalyzed metabolism especially if a perpetrator is likely to be administered intravenously and a marked effect is found on orally administered midazolam 5.
When used as a CYP3A probe in drug interaction studies, midazolam doses are lower than the doses used during anaesthetic induction or sedation of patients and usually range between 1–4 mg 10. We have previously shown that oral doses of midazolam exhibit linear pharmacokinetics over a 30 000-fold range and that oral microdoses can successfully predict drug interactions with strong inhibitors of CYP3A in healthy volunteers 11 and patients with haematological diseases 12. Microdosing refers to the concept of administering 1% of a pharmacologically active dose of a substance or 100 μg, whatever is less, to study a substance's property. Because these doses are far below the no observed adverse effect level (NOAEL) it is an attractive approach to assess a drug's propensity to exert pharmacokinetic drug interactions in early drug development and also in vulnerable populations. To be useful and predictive, it needs systematic validation to show dose linearity 13.
In this study we investigated intravenous and oral microgram and milligram doses of midazolam to evaluate the linearity of bioavailability and drug disposition in healthy volunteers.
Methods
Study quality standards
After approval by the responsible Ethics Committee of the Medical Faculty of the University of Heidelberg and the Federal Institute of Drugs and Medical Devices (BfArM, Bonn, Germany) we performed a monocentre drug trial (EudraCT 2012-000970-52) in healthy volunteers. The study was carried out at the Clinical Research Center of the Department of Clinical Pharmacology and Pharmacoepidemiology, University of Heidelberg, which is certified according to DIN EN ISO9001. It was conducted in agreement with the standards of Good Clinical Practice (as defined in the International Conference on Harmonization E6 Guideline for Good Clinical Practice), the Declaration of Helsinki and the specific legal requirements in Germany.
Population
After obtaining written informed consent, 17 participants were enrolled. One participant dropped out due to difficulties in getting venous access for frequent blood sampling. Hence, 16 healthy participants aged 18 to 60 years (four females, one Asian) participated in all 4 study days. They were mentally and physically healthy as ascertained by medical history, clinical examination, electrocardiogram and routine laboratory analyses including haematology, blood chemistry, urine screening for illicit drugs and a quantitative pregnancy test in females to exclude pregnancy. All participants were informed to use a double barrier method for contraception. None of the participants had been on any regular drug treatment in the 2 weeks prior to the study nor were they taking any drugs or any substances known to induce or inhibit drug metabolizing enzymes or transporters (e.g. grapefruit juice or St John's wort) within a period of less than 10 times the respective elimination half-life. Participants with known intolerance against midazolam were excluded as were participants with any of the following conditions: regular smoking, excessive alcohol drinking, blood donation within the last 4 weeks, participation in another study within the last 6 weeks before inclusion, suspected non-adherence, or inability to give written informed consent or to communicate well with the investigator.
Study design
This was an open label, fixed sequence, single dose, dose escalating study that was conducted in 16 healthy participants of either gender.
Study conduct
On 4 separate study days, participants received 3 μg of midazolam solution orally, 1 μg of midazolam intravenously over 5 min, 3 mg of midazolam solution orally or 1 mg of midazolam intravenously over 5 min. The washout between each study day was at least 72 h. Alcoholic and methylxanthine-containing beverages were not allowed on study days and in the 24 h before midazolam administration. Lunch and dinner on study days consisted of standardized meals provided by the hospital.
The preparation of midazolam from a vial containing 5 mg midazolam in 5 ml (Dormicum® V, Roche, Grenzach-Wyhlen, Germany) was done using calibrated Eppendorf® pipettes. For the 3 mg oral dose 3000 μl of Dormicum® were directly transferred into a plastic cup containing 100 ml of water. For the 3 μg oral dose 100 μl of Dormicum® were diluted in 9900 μl of water for a concentration of 10 μg ml−1. Then 300 μl of this solution were transferred into a plastic cup containing 100 ml of water. For the 1 mg intravenous dose 2 ml of Dormicum® were transferred into a 50 ml syringe containing 38 ml of saline solution (Fresenius, Germany) (final concentration 0.05 mg ml−1) and 20 ml were injected in 5 min using a syringe pump. For the 1 μg intravenous dose 1 ml of Dormicum® was diluted in 999 ml of physiological saline solution for a concentration of 1 μg ml−1. Two ml were transferred into a 50 ml syringe containing 38 ml of saline solution (final concentration 0.05 μg ml−1) and 20 ml were injected in 5 min using a syringe pump. These dilution steps were carried out according to a corresponding dilution protocol by the investigator with a four-eyes-principle shortly before application which was documented appropriately. The possibility of losses due to adsorption to tubing and vials was thoroughly evaluated and confirmed in preceding experiments 14.
Blood and urine sampling
Midazolam was administered in the morning of each study day after an overnight fast. Venous blood samples were drawn before and 15, 30 and 45 min as well as 1, 1.5, 2, 2.5, 3, 4, 6, 8, 10 and 24 h after administration of oral midazolam and before and 5, 15, 30 and 45 min as well as 1, 1.5, 2, 2.5, 3, 4, 6, 8, 10 and 24 h after administration of intravenous midazolam. Blood samples were immediately centrifuged for 10 min at 4°C and 2500 g and plasma was stored at −20°C until analysis. Volunteers were instructed to void their bladder in the morning and then to collect urine completely for 24 h post-dose in a container. Urine volume was measured and two 10 ml urine aliquots were stored at −20°C.
Analytical assays
Midazolam and 1'-OH-midazolam plasma and urine (after deconjugation) concentrations were quantified by LC/MS/MS techniques as previously described 14,15 with a lower limit of quantification (LLOQ) of 0.093 pg ml−1 for midazolam and 0.281 pg ml−1 for 1'-OH-midazolam.
Pharmacokinetic analysis and statistical evaluation
Standard pharmacokinetic parameters of midazolam and 1'-OH-midazolam were determined using Kinetica 5.0 (Thermo Fisher Scientific, Waltham, MA, USA). The following pharmacokinetic parameters were calculated by a non-compartmental analysis using plasma concentrations of midazolam (pg ml−1), blood collecting times (h) and administered midazolam doses (mg): maximum concentration (Cmax, pg ml−1), time to Cmax (tmax, h), terminal half-life (t1/2, h), volume of distribution (Vss or Vss/F, l), area under the plasma concentration−time profile (AUC(0,∞), pg ml−1 h), metabolic clearance, total clearance, and apparent oral clearance (CL/F, ml min−1). Cmax and tmax were directly obtained from the concentration−time curve. AUCs were calculated by a mixed log-linear model.
Metabolic clearance to 1'-OH-midazolam was calculated as Ae (1'-OH-midazolam)urine/AUC(midazolam)plasma.
Hepatic (ERH = CLiv/QH) and gastrointestinal extraction ratio (ERG = 1 − F/1 − ERH) were calculated assuming a liver blood flow (QH) of 25.4 ml min−1 × body weight (kg) × (1 − haematocrit) 16. Bioavailability was calculated as follows: Bioavailability (F) = (intravenous dose (Div) × AUCpo)/(oral dose (Dpo) × AUCiv).
With a sample size of 16 participants a difference in AUC greater than 25% between intravenous microgram and milligram (CV% = 14%) dose will be detected with a power of 0.96 and α = 0.05 (https://www.statstodo.com/SSizBioequiv_Pgm.php). The statistical analysis was performed with Prism 6.0 (Graphpad, San Diego, USA). To compare Cmax and AUC between microgram and milligram doses, the results were normalized to a dose of 1 mg. Groups were compared with a paired t-test after log-transformation. A P value <0.05 was considered significant.
Results
The pharmacokinetics of oral midazolam microdoses are shown in Table 1 and Figure 1. The midazolam concentration was > LLOQ in all post-dose samples and quantifiable. No significant differences between midazolam pharmacokinetics after intravenous administration of 1 μg and 1 mg were observed for dose-normalized Cmax and AUC, t1/2, total clearance and volume of distribution (Table 1, Figure 1). The geometric mean ratio of each PK parameter was nearly 1 (Table 2) in most cases. The 90% confidence interval of AUC geometric mean ratio was within bioequivalence limits for both oral and intravenous doses while Cmax dispersed more (Table 2). Within 24 h after dosing, 59.9% of the intravenous and 69.4% of the oral microgram doses of midazolam were recovered in the urine as 1'-OH-midazolam and its conjugates, which is comparable with the recoveries after the milligram doses (intravenous 61.2%, oral 67.5%). The calculated metabolic clearances of the two intravenous doses and the corresponding values for oral doses were similar (Table 1, Figure 2) as was the bioavailability of microgram and milligram doses (Table 1, Figure 3A). Hepatic and gut extraction ratios for microgram doses were 0.44 [95% CI 0.39, 0.49] and 0.53 [95% CI 0.44, 0.63] and those for milligram doses were 0.43 [95% CI 0.37, 0.49] and 0.61 [95% CI 0.53, 0.70] (Figure 3B and C). While there was no statistical difference in hepatic extraction ratio, gut extraction ratio after the oral microdose of midazolam was 13% smaller (P = 0.03). Intra- and interindividual variability of microdoses and milligram doses did not differ (Table 3).
Table 1.
Pharmacokinetics of intravenous and oral microgram and milligram doses of midazolam in healthy volunteers
| Dose (mg) | 0.001 | 1 | 0.003 | 3 |
|---|---|---|---|---|
| Route | Intravenous | Oral | ||
| Cmax (pg ml−1) | 39.1 [30.4, 50.2] | 37100 [26900, 51300] | 11.9 [9.17, 13.7] | 9990 [8050, 12400] |
| Dose-normalized Cmax | 39100 [30400, 50200] | 37100 [26900, 51300] | 11900 [9170, 13700] | 9990 [8050, 12400] |
| tmax (h) | 0.083 | 0.083 | 0.50 [0.25–0.75] | 0.50 [0.25–0.75] |
| AUC(0,∞) (pg ml−1 h) | 37.9 [35.5, 40.6] | 39000 [36100, 42100] | 26.6 [22.4, 31.5] | 24400 [20400, 29200] |
| Dose-normalized AUC(0,∞) | 37900 [35500, 40600] | 39000 [36100, 42100] | 8870 [7470, 10500] | 8130 [6800, 9730] |
| t1/2 (h) | 3.55 [3.01, 4.19] | 4.02 [3.63, 4.46] | 3.26 [2.81, 3.80] | 3.96 [3.76, 4.17] |
| CL or CL/F (ml min−1) | 439 [411, 470] | 428 [396, 462] | 1880 [1590, 2230] | 2050 [1720, 2450] |
| CLmet (ml min−1) | 253 [201, 318] | 278 [248, 311] | 1286 [1075, 1537] | 1199 [905, 1588] |
| Vss (l) | 83.5 [72.3, 96.6] | 73.5 [62.1, 87.1] | 413 [355, 481] | 469 [404, 544] |
| Ae (1'-OH-midazolam) (% of dose) | 59.9 [47.7, 75.1] | 61.2 [50.4, 74.4] | 69.4 [64.7, 74.5] | 67.5 [62.7, 72.5] |
| F (%) | 23.4 [20.0, 27.3] | 20.9 [17.1, 25.5] | ||
Geometric mean and 95% confidence interval for all parameters except tmax. Median and range for tmax.Ae, amount excreted into the urine;AUC(0,∞), area under the time−concentration curve;CL, clearance;CL/F, apparent oral clearance;CLmet, metabolic clearance;Cmax, observed maximum plasma concentration;F, bioavailability;t1/2, half-life;tmax, time to reach the Cmax;Vss, steady-state volume of distribution.
Figure 1.
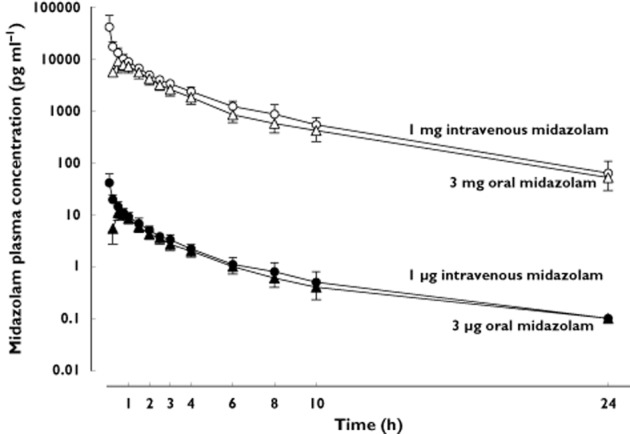
Plasma concentration−time curve (mean and 95% confidence interval) of midazolam after intravenous (circles) and oral (triangles) administration of milligram and microgram doses of midazolam to 16 healthy volunteers. Closed symbols represent microgram doses, open symbols milligram doses
Table 2.
Comparison of midazolam pharmacokinetic parameters between microdoses and milligram doses. Values near 1 indicate perfect linearity
| Parameter | Intravenous midazolam | Oral midazolam |
|---|---|---|
| AUC (dose-normalized) | 1.03 [0.95, 1.11] | 1.09 [0.98, 1.20] |
| Cmax (dose-normalized) | 1.05 [0.75, 1.48] | 1.12 [0.98, 1.28] |
| CLmet | 0.93 [0.78, 1.11] | 1.04 [0.83, 1.29] |
| t1/2 | 0.88 [0.77, 1.02] | 0.92 [0.81, 1.05] |
| Vss or Vss/F | 1.14 [0.99, 1.31] | 0.89 [0.79, 1.00] |
| Ae | 0.96 [0.70, 1.31] | 1.04 [0.97, 1.12] |
Geometric mean ratio and 90% confidence intervals of all parameters.Ae, amount excreted into the urine; AUC(0,∞), area under the time−concentration curve; CLmet, metabolic clearance; Cmax, observed maximum plasma concentration; F, bioavailability; t1/2, half-life; Vss, steady-state volume of distribution.
Figure 2.
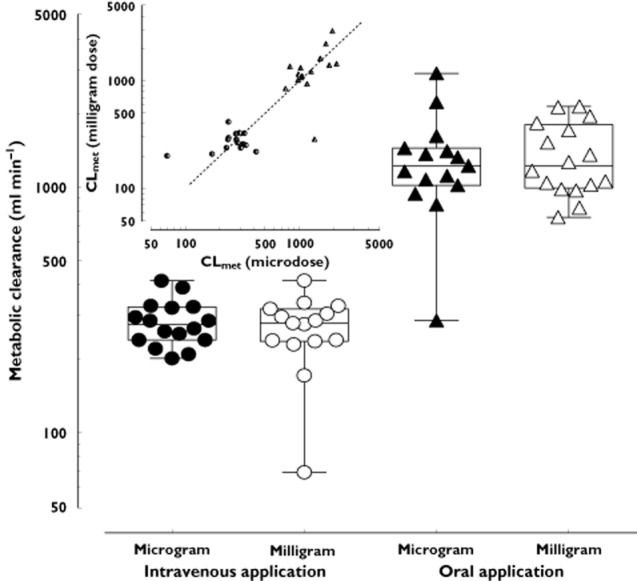
Metabolic clearance (mean and 95% confidence interval) of midazolam to 1'-OH-midazolam after administration of intravenous (circles) and oral (triangles) microgram and milligram doses in 16 healthy volunteers. Closed symbols represent microgram doses, open symbols milligram doses. The insert shows the intra-individual correlation of the metabolic clearance after intravenous (circles) and oral (triangles) microgram and milligram doses. The dashed line indicates the line of identity (slope = 1)
Figure 3.

Pharmacokinetic parameters of midazolam in 16 healthy volunteers after intravenous and oral administration of milligram and microgram doses. Each point represents one participant. Closed symbols represent microgram doses, open symbols milligram doses. (A) Mean and 95% confidence interval of bioavailability of microgram and milligram doses of midazolam. (B) Mean and 95% confidence interval of apparent oral clearances of oral midazolam. (C) Mean and 95% confidence interval of hepatic extraction ratios of midazolam milligram and microgram doses. Diamond represents outlier
Table 3.
Comparison of the coefficient of variation (CV%) between microdosing and milligram doses
| Parameter | μg dose oral | μg dose intravenous | mg dose oral | mg dose intravenous |
|---|---|---|---|---|
| Cmax | 38.2% | 43.7% | 51.0% | 61.3% |
| AUC(0,∞) | 30.9% | 13.2% | 31.3% | 14.0% |
| t1/2 | 26.7% | 27.4% | 19.4% | 19.4% |
| CL/F or CL | 32.3% | 11.9% | 35.8% | 14.9% |
| Vss/F or Vss | 28.0% | 24.8% | 25.6% | 36.7% |
| F | 29.4% | 36.1% | ||
| ERH | 20.3% | 25.6% | ||
| ERG | 26.0% | 43.9% | ||
| Ae | 33.9% | 27.1% | 25.2% | 12.9% |
| CLmet | 11.4% | 40.6% | 45.4% | 21.7% |
Ae, amount excreted into the urine; AUC(0,∞), area under the time−concentration curve; CL, clearance; CL/F, apparent oral clearance; CLmet, metabolic clearance; Cmax, observed maximum plasma concentration; ERG gut extraction ratio; ERH, hepatic extraction ratio; F, bioavailability; t1/2, half-life; Vss, steady-state volume of distribution.
Safety and tolerability
All 16 participants completed the 4 study days. Midazolam doses were well tolerated. No benzodiazepine effects and no adverse events were observed after microgram doses. All adverse events were observed after administration of milligram doses of midazolam, they were non-serious, low-grade and transient in nature. Two participants experienced transient asymptomatic hypotension after infusion of 1 mg doses of midazolam. All participants experienced drowsiness or sleepiness for several hours after administration of milligram doses of midazolam.
Discussion
This study shows linearity of absorption, distribution, metabolism and elimination of a midazolam microdose with essentially no pharmacokinetic parameter differing between microgram and milligram doses, independently of the route of administration. While our earlier study already suggested that absorption was linear in the range between 100 ng and 3 mg direct intra-individual comparison with intravenous pharmacokinetics has now confirmed this earlier finding 11.
For a number of reasons midazolam is well suited as a probe drug in microdosing studies: (1) It can be quantified in plasma even at concentrations less than 1 pg ml−1 using MS/MS-technology not requiring radio-labelled drugs 14, (2) plasma concentrations in the observed dose range are well below KM of 3–5 μm for the CYP3A4-mediated biotransformation of midazolam 17. Hence first order kinetics may be anticipated for CYP3A-dependent from enzyme kinetics for all investigated doses, (3) a saturated enzymatic process becoming unsaturated would disrupt pharmacokinetic linearity. There is no other enzyme metabolizing midazolam with low capacity but high affinity that could become unsaturated while scaling down the dose 18 and (4) moreover, midazolam is not a substrate of important drug transporters like P-glycoprotein (P-gp) 19 or SLCO1B1 20, so neither transportation processes might become unsaturated for microgram doses.
The accuracy of the pharmacokinetic prediction is deemed acceptable and linearity of microdoses confirmed if the results of regular doses and microdoses scatter within a two-fold range 13. In this regard, the midazolam microdose did very well and most parameters fulfilled these requirements (Table 2). Both dose levels had a similar statistical dispersion (Table 3). A notable exception was Cmax, which was determined as a non-continuous variable, i.e. directly derived from the sampling points. The most relevant parameter, mean metabolic clearance, was equal (Figure 2) and correlation of individual clearances (Figure 2, insert) was good with only two cases with clearance values deviating slightly more than two-fold on one study day.
Bypassing pre-systemic elimination through intravenous administration further reduces pharmacokinetic variability caused by the absorption process. Therefore, and in accordance with our earlier findings 11, we anticipated linearity of the pharmacokinetics intravenous doses, and dose-normalized values for Cmax and AUC indeed well compared with the data of the former study. The same was true for clearances, half-lives and volumes of distribution. Comparing dose-normalized microdose data with published data from microgram and milligram doses showed linearity of pharmacokinetic parameters ranging from 100 ng to 10 mg for oral doses and 1 μg to 10 mg for intravenous doses 8,11,13,15,21. There was no difference in the absorption process reflected by bioavailability and Cmax between our work and previously published data 13,15,21.
Use of intravenous midazolam microdosing will help to assess sensitively systemic CYP3A activity in vivo without side effects. Combination with an oral microdose is a useful method for the safe investigation of net systemic and pre-systemic CYP3A metabolism, allowing the estimation of hepatic and intestinal contribution. While the safety profile of a usual midazolam dose is favourable in most cases, the risk of cardio-depression or prolonged sedation remains which is eliminated using a microdose. The extent of extrinsic modulators of CYP3A activity such as co-medication can also be investigated safely in target populations. We have recently shown that midazolam clearance in haematological patients taking posaconazole was inhibited to a similar extent compared with healthy volunteers using a 3 μg oral dose without any systemic benzodiazepine effects 12. Even when combinations of strong inhibitors of midazolam such as ketoconazole/fluoxetine were administered, which may increase exposure 12-fold 22, this phenotyping procedure is still safe, because even then effective concentrations will not be reached.
Limitations
It remains to be determined if the difference of 13% in ERG was due to true differences in absorption and pre-systemic metabolism of microdoses as statistical significance was based on one participant whose ERG was 0.21 when receiving the midazolam microdose (Figure 3C). This participant had a high systemic midazolam clearance, a small body weight (58.6 kg) and hence the lowest estimated plasma flow in the group. A small change in bioavailability of 6% explicable by intra-individual variability led to a high relative change in ERG by 45% in this situation, likely pushing the model to its limit.
The AUC(0,∞) ratio was within bioequivalence limits but the 90% confidence interval of the Cmax ratio was outside the 0.8–1.25 range. As the CV% of Cmax ranges from >30% up to 61% (Table 3), midazolam can be considered a highly variable drug where bioequivalence limits for Cmax are wider 5. Also the blood sampling times around expected tmax may not have been enough to determine Cmax properly and the real value may have been missed in some cases further increasing intra and intersubject variability. This was especially true for the intravenous application of midazolam.
While there was no difference in mean systemic clearance, there was some intra-individual variability. This observed variability may be explained by the dosing interval between study days as intra-individual changes of systemic clearance of a similar magnitude have been observed in some volunteers with milligram doses over a time period of 21 days 23. This can be reduced by the simultaneous oral and/or intravenous application with the help of a stable isotope technique (e.g. 15N-midazolam) 24. Nevertheless the reliable prediction of individual drug metabolism with a microdose would be a necessary condition for applications in personalized dosing algorithms such as the diagnostic microdosing of anti-cancer drugs 25 or prediction of chemotherapy exposure 26. In cases where precise prediction of individual clearance within a two-fold margin is of importance, phenotyping with probe drugs might have an expiry date and should be performed in proximity of time.
In conclusion this study shows that midazolam pharmacokinetics are also linear after intravenous administration of microdoses and expands our previous findings after oral administration 11. The administered microdose is 33-fold lower than the lowest microdose (75 μg) studied so far 21 which is still manageable from a clinical and also conventional analytical (LC-MS/MS) point of view. This opens new possibilities for the safe investigation of CYP3A-dependent metabolism, drug interactions and dosing strategies in the many target patient populations previously excluded from such studies.
Competing Interests
All authors have completed the Unified Competing Interest form at http://www.icmje.org/coi_disclosure.pdf (available on request from the corresponding author) and declare no support from any organization for the submitted work, no financial relationships with any organizations that might have an interest in the submitted work in the previous 3 years and no other relationships or activities that could appear to have influenced the submitted work.
The authors are grateful to Marlies Stützle-Schnetz and Brigitte Tayrouz for excellent assistance during the conduct of the trial, to Kristina Lohmann for monitoring the study and to Monika Maurer for technical support during analytical procedures.
Author Contributions
NH, FK, AC, JB, WEH and GM wrote the manuscript, GM, WEH, FK and NH designed the study, NH, AC and FK performed the trial and JB developed the analytical methods and analyzed the samples.
References
- Evans WE, Relling MV. Pharmacogenomics: translating functional genomics into rational therapeutics. Science. 1999;286:487–491. doi: 10.1126/science.286.5439.487. [DOI] [PubMed] [Google Scholar]
- Paine MF, Hart HL, Ludington SS, Haining RL, Rettie AE, Zeldin DC. The human intestinal cytochrome P450 ‘pie’. Drug Metab Dispos. 2006;34:880–886. doi: 10.1124/dmd.105.008672. [DOI] [PMC free article] [PubMed] [Google Scholar]
- Dresser GK, Spence JD, Bailey DG. Pharmacokinetic-pharmacodynamic consequences and clinical relevance of cytochrome P450 3A4 inhibition. Clin Pharmacokinet. 2000;38:41–57. doi: 10.2165/00003088-200038010-00003. [DOI] [PubMed] [Google Scholar]
- CDER. 2012. Guidance for industry drug interaction studies – study design, data analysis, implications for dosing, and labeling recommendations, Available at http://www.fda.gov/downloads/Drugs/GuidanceComplianceRegulatoryInformation/Guidances/ucm292362.pdf (last accessed 19 August 2014)
- EMA. 2012. Guideline on the investigation of drug interactions, Available at http://www.ema.europa.eu/docs/en_GB/document_library/Scientific_guideline/2012/07/WC500129606.pdf (last accessed 19 August 2014)
- Arendt RM, Greenblatt DJ, Garland WA. Quantitation by gas chromatography of the 1- and 4-hydroxy metabolites of midazolam in human plasma. Pharmacology. 1984;29:158–164. doi: 10.1159/000138007. [DOI] [PubMed] [Google Scholar]
- Seo KA, Bae SK, Choi YK, Choi CS, Liu KH, Shin JG. Metabolism of 1'- and 4-hydroxymidazolam by glucuronide conjugation is largely mediated by UDP-glucuronosyltransferases 1A4, 2B4, and 2B7. Drug Metab Dispos. 2010;38:2007–2013. doi: 10.1124/dmd.110.035295. [DOI] [PubMed] [Google Scholar]
- Heizmann P, Eckert M, Ziegler WH. Pharmacokinetics and bioavailability of midazolam in man. Br J Clin Pharmacol. 1983;16(Suppl. 1):43S–49. doi: 10.1111/j.1365-2125.1983.tb02270.x. [DOI] [PMC free article] [PubMed] [Google Scholar]
- Thummel KE, Shen DD, Podoll TD, Kunze KL, Trager WF, Hartwell PS, Raisys VA, Marsh CL, McVicar JP, Barr DM. Use of midazolam as a human cytochrome P450 3A probe: I. In vitroin vivo correlations in liver transplant patients. J Pharmacol Exp Ther. 1994;271:549–556. [PubMed] [Google Scholar]
- Fuhr U, Jetter A, Kirchheiner J. Appropriate phenotyping procedures for drug metabolizing enzymes and transporters in humans and their simultaneous use in the ‘cocktail’ approach. Clin Pharmacol Ther. 2007;81:270–283. doi: 10.1038/sj.clpt.6100050. [DOI] [PubMed] [Google Scholar]
- Halama B, Hohmann N, Burhenne J, Weiss J, Mikus G, Haefeli WE. A nanogram dose of the CYP3A probe substrate midazolam to evaluate drug interactions. Clin Pharmacol Ther. 2013;93:564–571. doi: 10.1038/clpt.2013.27. [DOI] [PubMed] [Google Scholar]
- Hohmann N, Halama B, Siller N, Mikus G, Haefeli WE. Response to ‘can CYP3A activity be evaluated for drug interaction using a nanogram dose of probe drug?’: evaluation of CYP3A activity with microdoses of midazolam. Clin Pharmacol Ther. 2014;95:490–491. doi: 10.1038/clpt.2014.28. [DOI] [PubMed] [Google Scholar]
- Lappin G, Kuhnz W, Jochemsen R, Kneer J, Chaudhary A, Oosterhuis B, Drijfhout WJ, Rowland M, Garner RC. Use of microdosing to predict pharmacokinetics at the therapeutic dose: experience with 5 drugs. Clin Pharmacol Ther. 2006;80:203–215. doi: 10.1016/j.clpt.2006.05.008. [DOI] [PubMed] [Google Scholar]
- Burhenne J, Halama B, Maurer M, Riedel KD, Hohmann N, Mikus G, Haefeli WE. Quantification of femtomolar concentrations of the CYP3A substrate midazolam and its main metabolite 1'-hydroxymidazolam in human plasma using ultra performance liquid chromatography coupled to tandem mass spectrometry. Anal Bioanal Chem. 2012;402:2439–2450. doi: 10.1007/s00216-011-5675-y. [DOI] [PubMed] [Google Scholar]
- Hafner V, Jäger M, Matthée AK, Ding R, Burhenne J, Haefeli WE, Mikus G. Effect of simultaneous induction and inhibition of CYP3A by St John's Wort and ritonavir on CYP3A activity. Clin Pharmacol Ther. 2010;87:191–196. doi: 10.1038/clpt.2009.206. [DOI] [PubMed] [Google Scholar]
- Lee JI, Chaves-Gnecco D, Amico JA, Kroboth PD, Wilson JW, Frye RF. Application of semisimultaneous midazolam administration for hepatic and intestinal cytochrome P450 3A phenotyping. Clin Pharmacol Ther. 2002;72:718–728. doi: 10.1067/mcp.2002.129068. [DOI] [PubMed] [Google Scholar]
- Yuan R, Madani S, Wei XX, Reynolds K, Huang SM. Evaluation of cytochrome P450 probe substrates commonly used by the pharmaceutical industry to study in vitro drug interactions. Drug Metab Dispos. 2002;30:1311–1319. doi: 10.1124/dmd.30.12.1311. [DOI] [PubMed] [Google Scholar]
- Hamaoka N, Oda Y, Hase I, Asada A. Cytochrome P4502B6 and 2C9 do not metabolize midazolam: kinetic analysis and inhibition study with monoclonal antibodies. Br J Anaesth. 2001;86:540–544. doi: 10.1093/bja/86.4.540. [DOI] [PubMed] [Google Scholar]
- Eap CB, Fellay J, Buclin T, Bleiber G, Golay KP, Brocard M, Baumann P, Telenti A. CYP3A activity measured by the midazolam test is not related to 3435 C >T polymorphism in the multiple drug resistance transporter gene. Pharmacogenetics. 2004;14:255–260. doi: 10.1097/00008571-200404000-00005. [DOI] [PubMed] [Google Scholar]
- Ziesenitz VC, Weiss J, Haefeli WE, Mikus G. Cytochrome P450-3A phenotyping using midazolam is not altered by OATP1B1 polymorphisms. Clin Pharmacol Ther. 2013;93:388. doi: 10.1038/clpt.2013.46. [DOI] [PubMed] [Google Scholar]
- Eap CB, Buclin T, Cucchia G, Zullino D, Hustert E, Bleiber G, Golay KP, Aubert AC, Baumann P, Telenti A, Kerb R. Oral administration of a low dose of midazolam (75 microg) as an in vivo probe for CYP3A activity. Eur J Clin Pharmacol. 2004;60:237–246. doi: 10.1007/s00228-004-0762-z. [DOI] [PubMed] [Google Scholar]
- Croft M, Keely B, Morris I, Tann L, Lappin G. Predicting drug candidate victims of drug−drug interactions, using microdosing. Clin Pharmacokinet. 2012;51:237–246. doi: 10.2165/11597070-000000000-00000. [DOI] [PubMed] [Google Scholar]
- Kharasch ED, Jubert C, Senn T, Bowdle TA, Thummel KE. Intraindividual variability in male hepatic CYP3A4 activity assessed by alfentanil and midazolam clearance. J Clin Pharmacol. 1999;39:664–669. doi: 10.1177/00912709922008290. [DOI] [PubMed] [Google Scholar]
- Nakamura K, Watanabe A, Okudaira N, Okazaki O, Sudo K. Effect of ion suppression on judgment of enzyme inhibition and avoidance of error by utilizing a stable isotope-labeled probe substrate: example of CYP3A4 inhibition with [13C4,15N] labeled midazolam as a substrate. Drug Metab Pharmacokinet. 2007;22:113–118. doi: 10.2133/dmpk.22.113. [DOI] [PubMed] [Google Scholar]
- Theile D, Mikus G. Deceptive argumentation against diagnostic microdosing of anticancer drugs. Int J Cancer. 2014;135:1753–1754. doi: 10.1002/ijc.28806. [DOI] [PubMed] [Google Scholar]
- Mathijssen RH, de Jong FA, van Schaik RH, Lepper ER, Friberg LE, Rietveld T, de Bruijn P, Graveland WJ, Figg WD, Verweij J, Sparreboom A. Prediction of irinotecan pharmacokinetics by use of cytochrome P450 3A4 phenotyping probes. J Natl Cancer Inst. 2004;96:1585–1592. doi: 10.1093/jnci/djh298. [DOI] [PubMed] [Google Scholar]