

Abstract
RNA-sensing toll-like receptors (TLRs) mediate innate immunity and regulate anti-viral response. We show here that TLR3 regulates host immunity and the loss of TLR3 aggravates pathology in Chikungunya virus (CHIKV) infection. Susceptibility to CHIKV infection is markedly increased in human and mouse fibroblasts with defective TLR3 signaling. Up to 100-fold increase in CHIKV load was observed in Tlr3−/− mice, alongside increased virus dissemination and pro-inflammatory myeloid cells infiltration. Infection in bone marrow chimeric mice showed that TLR3-expressing hematopoietic cells are required for effective CHIKV clearance. CHIKV-specific antibodies from Tlr3−/− mice exhibited significantly lower in vitro neutralization capacity, due to altered virus-neutralizing epitope specificity. Finally, SNP genotyping analysis of CHIKF patients on TLR3 identified SNP rs6552950 to be associated with disease severity and CHIKV-specific neutralizing antibody response. These results demonstrate a key role for TLR3-mediated antibody response to CHIKV infection, virus replication and pathology, providing a basis for future development of immunotherapeutics in vaccine development.
Keywords: Chikungunya virus, innate immunity, joint inflammation, neutralizing antibodies, TLR3
Introduction
Innate immunity against RNA viruses involves pattern recognition receptors (PRRs) that recognize structurally conserved molecules from diverse pathogens known as pathogen-associated molecular patterns (PAMPs) (Arpaia & Barton, 2011). PRRs include TLRs (particularly TLR3, TLR7 and TLR8) and members of the cytosolic retinoic acid-inducible gene I (RIG-I)-like receptors such as melanoma differentiation-associated protein 5 (MDA5) and RIG-I that detect RNA viruses through their genomic RNA or the double-stranded RNA (dsRNA) viral intermediate generated during replication (Yoneyama et al, 2004, 2005; Gitlin et al, 2006). Activation of these PRRs induces downstream anti-viral type I IFN response, which can also occur independently of viral RNA transcription and replication (Nikonov et al, 2013).
The involvement of TLRs in counteracting RNA virus infection is widely documented (Arpaia & Barton, 2011; Neighbours et al, 2012; Zhang et al, 2013). TLR3 recognizes dsRNA and can influence disease outcomes depending on the type of virus and infection model. TLR3-mediated innate and inflammatory responses were demonstrated to be protective against HIV, CMV and Dengue virus infections, while TLR3 stimulation results in detrimental disease outcomes in Influenza A virus and Punta Toro virus infections (Tabeta et al, 2004; Goffic et al, 2006; Gowen et al, 2006; Suh et al, 2007; Nasirudeen et al, 2011). TLR3-dependent response has been shown to be both protective by restricting virus replication in neurons (Daffis et al, 2008) and also detrimental in West Nile virus infection by perturbing TNFR1 signaling to promote virus entry into the brains of mice resulting in lethal encephalitis (Wang et al, 2004). Clinically, patients with impaired TLR3-mediated responses show an increased susceptibility to HSV-1 encephalitis (Zhang et al, 2007; Pérez de Diego et al, 2010; Sancho-Shimizu et al, 2011). Repeated reactivation of HSV-2 that led to the development of Mollaret meningitis has also been reported in an individual with TLR3 deficiency (Willmann et al, 2010).
The significance of TLR-mediated signaling and how TLR molecules influence clinically important re-emerging viruses such as CHIKV remains confounding. CHIKV is an ‘Old World’ alphavirus with a positive sense RNA genome belonging to the Togaviridae family (Deller & Russell, 1968). CHIKV is the causative agent for CHIKF, and over the last decade, it has caused simultaneous outbreaks of unprecedented scale in the Indian Ocean Islands (Josseran et al, 2006), India (Kaur et al, 2008) and subsequently in South East Asia (Laras et al, 2005; AbuBakar et al, 2007; Leo et al, 2009) and Europe (Queyriaux et al, 2008). Serious CHIKF outbreaks have also occurred in Cambodia (Centers for Disease Control & Prevention, 2012; Duong et al, 2012), Laos (Soulaphy et al, 2013) and Sierra Leone (Ansumana et al, 2013). Since 2013, it has finally reached the Americas and triggered ongoing outbreaks in the French West Indies (Enserink, 2014; Leparc-Goffart et al, 2014). The clinical presentation of the disease is characterized by flu-like symptoms such as fever, rash and muscle aches which subside in 7–10 days (Kam et al, 2009). The hallmark of CHIKV infection is the incapacitating arthralgia that routinely persists for weeks or months after resolution of the acute symptoms and has high costs in terms of both quality of life and healthcare provision/economic loss (Borgherini et al, 2008).
The involvement of TLRs in CHIKV replication was previously investigated in murine models (Schilte et al, 2010, 2012), but their role in CHIKV pathology and dissemination was not well established. We show here that TLR3 signaling plays a critical role in the control of CHIKV infection, replication, dissemination and pathology. Complementing an earlier report where CHIKV-infected Trif−/− (Toll/IL-1 resistance domain-containing adaptor inducing IFNβ; an adaptor protein essential for TLR3-mediated signaling) mice showed more pronounced viremia and joint inflammation compared to WT mice (Rudd et al, 2012), this study further demonstrated that infection of cultured primary human TRIF−/− and mouse Tlr3−/− fibroblasts resulted in a significant enhancement of virus replication. Notably, infected Tlr3−/− mice developed higher viremia and more pronounced joint inflammation, associated with a massive infiltration of myeloid cells such as neutrophils and macrophages when compared to WT mice. Furthermore, monitoring of virus infection using a firefly luciferase (FLuc)-tagged recombinant CHIKV (FLuc-CHIKV) revealed increased CHIKV dissemination in Tlr3−/− mice. By infecting bone marrow chimeric mice, we showed that TLR3-expressing hematopoietic cells were required for effective CHIKV clearance, but did not directly regulate CHIKV-induced joint inflammation. Mechanistic investigations further demonstrated that TLR3 was required by hematopoietic cells to direct CHIKV-specific antibody response toward important neutralizing linear B-cell epitopes in the E2 glycoprotein. In the absence of TLR3, high levels of CHIKV-specific IgG were still generated, but with substantially diminished neutralizing capacity. The clinical relevance of TLR3 was further investigated in CHIKV-infected patients, where the level of TLR3 transcripts was increased in PBMCs of CHIKV-infected patients. Interestingly, SNP genotyping analysis further identified TLR3 SNPs rs3775292 and rs6552950, whose functional effects remain unknown, to be associated with prevalence of CHIKV phenotypes, and in the case of SNP rs6552950, also with disease severity, CHIKV-specific IgG response and antibody neutralizing capacity. Taken together, these results substantiate a role for TLR3 in the control of CHIKV replication, immunity and pathology.
Results
TRIF deficiency increases CHIKV replication
Activation of various TLR signaling pathways including TLR2, TLR3 and TLR4 engage the TRIF adaptor protein to induce expression of downstream anti-viral and pro-inflammatory genes (Yamamoto et al, 2003). To demonstrate a functional role for TRIF signaling in anti-CHIKV response, human primary fibroblasts with homozygous TRIF nonsense mutation (Sancho-Shimizu et al, 2011) were infected with CHIKV in vitro. CHIKV replication was remarkably higher in the TRIF−/− fibroblasts with a 2-log difference when compared to healthy control (Fig1A–C). This observation is in line with previous findings where TRIF−/− fibroblasts were shown to be more susceptible to infection with HSV-1 and vesicular stomatitis virus (Sancho-Shimizu et al, 2011) due to a defect in type I interferon induction. This suggested that TLRs could be involved in CHIKV infection. We focused our study on TLR3 because TLR3-mediated immunity and polymorphisms to viral infection in human have been demonstrated to regulate disease progression (Pérez de Diego et al, 2010; Reinert et al, 2012; Zhang et al, 2007b).
Figure 1. Enhanced CHIKV replication in TRIF−/− and Tlr3−/− primary fibroblasts from human and mice, respectively.

- A–C CHIKV replication in TRIF−/− primary human fibroblasts was determined by CHIKV Ag detection using flow cytometry (A and B) and viral load quantification using qRT-PCR (C) after 6 and 12 hpi (MOI 10). Infection was performed in triplicate, and data are representative of two independent experiments and presented as mean ± SD (two-tailed unpaired t-test, ***P = 0.0005 6 hpi CHIKV Ag, ***P = 0.0009 12 hpi CHIKV Ag, **P = 0.0041 6 hpi viral load, **P = 0.0043 12 hpi viral load).
- D–F Primary tail fibroblasts isolated from WT and Tlr3−/− mice (n = 3 per group) were infected with CHIKV (MOI 10). CHIKV infectivity was determined by flow cytometry for CHIKV Ag (D and E) and by qRT-PCR for viral load quantification (F) at 12 hpi. Infection was performed in triplicate, and data are representative of two independent experiments and presented as mean ± SD (two-tailed unpaired t-test, ***P = 0.0001 CHIKV Ag, *P = 0.0368 viral load).
TLR3 inhibits CHIKV replication
To dissect the significance of TLR3-mediated anti-CHIKV response, primary fibroblasts were isolated from both WT and Tlr3−/− mice and infected with CHIKV ex vivo. The loss of TLR3 significantly increased susceptibility to CHIKV infection that led to marked virus replication when compared to WT fibroblasts (Fig1D–F). To gain further insights on how TLR3 signaling mediates an anti-CHIKV state, transcriptional profiles of type I IFNs and related IFN-stimulated genes (ISGs) during infection were analyzed (Supplementary Fig S1). Results revealed that the induction of type I IFNs were higher in Tlr3−/− fibroblasts, suggesting that the induction of type I IFN response observed here is independent of TLR3.
Loss of TLR3 leads to more pronounced virus dissemination and CHIKV-induced pathology
The importance of TLR3 in CHIKV infection was next examined in vivo in both WT and Tlr3−/− mice via the joint footpad inoculation route (Gardner et al, 2010; Teng et al, 2012). Animals were monitored daily for survival, viremia and joint inflammation. Although the loss of TLR3 expression did not affect animal survival, significantly higher viremia was observed throughout the course of disease in Tlr3−/−animals (Fig2A). Strikingly, Tlr3−/− mice exhibited a remarkable exacerbation of CHIKV-induced inflammation at the joint footpad (Fig2B). Transcriptional analysis on joint footpad samples harvested at the peak of viremia revealed that the induction of type I IFNs was differentially induced in Tlr3−/− mice as compared to WT mice (Supplementary Fig S2).
Figure 2. TLR3 modulates CHIKV replication, disease pathology and dissemination in mice.

- A, B WT and Tlr3−/− mice (n = 5 per group) were infected with CHIKV (106 PFU) by joint footpad inoculation. (A) Viremia was determined from blood collected from tails by viral load quantification. Dotted line indicates the limit of viral load detection. (B) Extent of joint inflammation was measured daily and expressed as disease score relative to day 0 (pre-infection). Data are representative of three independent experiments and presented as mean ± SD (two-tailed Mann–Whitney U-test, **P = 0.0037 1 dpi viremia, ***P = 0.0006 2 dpi viremia, ***P = 0.0003 3–6 dpi viremia, **P = 0.0012 8 dpi viremia, **P = 0.0012 10 dpi viremia, ***P = 0.0003 12 dpi viremia, ***P = 0.0002 2–9 dpi disease score, ***P = 0.0003 10 dpi disease score, **P = 0.003 11 dpi disease score, *P = 0.014 12 dpi disease score, **P = 0.0093 13 dpi disease score).
- C, D TLR3 modulates CHIKV dissemination in mice. WT and Tlr3−/− mice were infected with FLuc-CHIKV (106 PFU) by joint footpad (n = 4–5 per group) inoculation. Bioluminescence signals were measured using an in vivo bioluminescence imaging system. (C) Images of representative 6 dpi in WT and Tlr3−/− mice. Color scale indicates the level of bioluminescence signals detected. (D) Bioluminescence signals of whole body, head region and at site of inoculation were quantified and expressed as average radiance (p/s/cm2/sr). The lowest limit of detection is 0 p/s/cm2/sr. Data are representative of two independent experiments and presented as mean ± SD (two-tailed Mann–Whitney U-test, *P = 0.0159 3 hpi whole body, *P = 0.0317 6 hpi whole body, *P = 0.0317 4 dpi whole body, *P = 0.0159 6 dpi whole body, *P = 0.0159 7 dpi whole body, *P = 0.0317 8 dpi whole body, *P = 0.0195 3 hpi right footpad, *P = 0.0159 3 hpi head, *P = 0.0159 6 hpi head, *P = 0.0317 5 dpi head, *P = 0.0159 6 dpi head, *P = 0.0317 7 dpi head, *P = 0.0317 8 dpi head, *P = 0.0317 10 dpi head, *P = 0.0476 12 dpi head).
- E TLR3 modulates CHIKV tissue tropism in mice. Bioluminescence signals of various organs, body and skin of WT and Tlr3−/− mice (n = 10–12 per group) infected with FLuc-CHIKV (106 PFU) by joint footpad inoculation at 3 dpi were quantified and expressed as average radiance (p/s/cm2/sr). The lowest limit of detection is 0 p/s/cm2/sr. Data are representative of two independent experiments and presented as mean ± SD (two-tailed Mann–Whitney U-test, *P = 0.0206 body, **P = 0.0034 skin, ***P = 0.0003 head, ***P = 0.0002 lungs, **P = 0.0011 liver, *P = 0.0434 heart, ***P = 0.0003 spleen, *P = 0.0117 kidneys, *P = 0.0213 brain).
To further study the role of TLR3 on in vivo CHIKV replication and dissemination, we used a recombinant FLuc-CHIKV to infect both WT and Tlr3−/− mice and tracked the kinetics of CHIKV infection by live imaging for a duration of 20 dpi. As expected, the loss of TLR3 once again resulted in more pronounced joint inflammation and viremia (Supplementary Fig S3A–C). Bioluminescence signals indicative of virus replication distinctly reveal the differences in the route of CHIKV dissemination in WT and Tlr3−/− mice during the initial phase of infection (Fig3C and Supplementary Videos S1 and S2). From the site of infection (i.e. right joint footpad), signals were next detected in the posterior regions (tail, lymph node and left footpad) before moving to the anterior regions in the lower abdomen and head (Supplementary Videos S1 and S2). Notably, CHIKV dissemination was more rapid and extensive in Tlr3−/− mice than in WT mice (Fig2C and D and Supplementary Videos S1 and S2). High level of virus replication was detected from the whole body by the bioluminescence signals (Fig2D) and also from the blood by viral RNA quantification (Supplementary Fig S3C). The Tlr3−/− mice exhibited delayed virus clearance throughout the disease. On the contrary, bioluminescence signals were mainly localized at the site of infection in WT mice (Fig2C and Supplementary Video S1). Notably, bioluminescence signals peaked at 2–3 dpi in the head region of Tlr3−/− mice and remained detectable until 16 dpi (Fig2D).
Figure 3. Loss of TLR3 increases myeloid cells infiltration at the peak of joint swelling.

- A–D WT and Tlr3−/− mice (n = 5–6 per group) were infected with CHIKV (106 PFU) by joint footpad inoculation. Histological analysis of CHIKV-inoculated joint footpad samples from WT and Tlr3−/− mice by H&E staining (A) and labeling with anti-F4/80 antibody (B), anti-CD11b (C) and anti-Ly6G (D) at 6 dpi. Boxed regions are shown at higher magnification on the right. * = edema, B = bone, M = muscle, T = tendon. Black arrow heads indicate positively stained cells. Images presented are from one mouse representative of 3 mice per group from two independent experiments. Scale bars: left, 100 μm; middle, 50 μm; right, 30 μm.
To determine whether the pattern of CHIKV dissemination was specific to the loss of TLR3 and not due to the site of virus inoculation, mice were subjected to s.c. inoculation of CHIKV at the dermis region of the ear prior to live imaging analysis (Supplementary Fig S4 and Supplementary Videos S3 and S4). Similar patterns of CHIKV dissemination were observed. Although the level of bioluminescence signals measured by the ear inoculation route was lower, signals detected from the whole body, head region and inoculated ear in Tlr3−/− mice still remained significantly higher than that of the WT mice (Supplementary Fig S4B and Supplementary Videos S3 and S4) and correlated with viremia (Supplementary Fig S3D).
To further evaluate whether a loss of TLR3 expression affects virus tropism in tissues and deeper organs, mice inoculated via the joint footpad route were sacrificed at 3 dpi and dissected in order to quantify bioluminescence signals from the various organs, skeletal body and skin (Fig2E). Higher bioluminescence signals were detected from the skeletal body, skin, head, lungs, liver, heart, spleen, kidneys and brain of Tlr3−/− mice (Fig2E), confirming the role of TLR3 in controlling CHIKV infection and virus dissemination. Interestingly, bioluminescence signals were also detected in the brain in 40% of Tlr3−/− mice (Fig2E), and positive bioluminescence signals were still detectable in the body, skin and head of Tlr3−/− mice at 6 dpi (Supplementary Fig S5).
Severe joint inflammation in Tlr3−/− mice is associated with a massive infiltration of myeloid cells
In an effort to assess tissue damage in the joints of CHIKV-infected mice, histological assessments revealed an intensified disease score in Tlr3−/− mice that correlated with more pronounced subcutaneous edema and infiltration of CD11b+ myeloid cells at 3 dpi (Supplementary Fig S6) and during the peak of disease severity at 6 dpi (Fig3). The infiltrated myeloid cells consisted primarily of F4/80+ macrophages that were localized in the edema region, while the Ly6G+ neutrophils were localized distinctly in the skeletal muscles. In addition, cellular infiltrates in the joint of virus-infected mice were further analyzed during the peak of inflammation at 6 dpi by flow cytometry. Consistent with histological analysis (Fig3), the loss of TLR3 resulted in a significant increase in infiltrating CD11b+ myeloid cells and, in particular, CD11b+Ly6G+ neutrophils in Tlr3−/− mice (Fig4A and Supplementary Fig S7). This observation was further complemented by transcriptional analysis of the CHIKV-infected joint footpad that revealed a significant induction of neutrophil-associated activation molecules and chemokines such as defensins Defb4,Defb14, myeloperoxidase (Mpo), Il-1b and Il-8r in Tlr3−/− mice at 6 dpi (Fig4B).
Figure 4. Loss of TLR3 modulates neutrophils recruitment, but not CD4+ T-cell-mediated joint inflammation.

- A WT and Tlr3−/− mice were infected with CHIKV (106 PFU) by joint footpad (n = 5–6 per group) inoculation. At 6 dpi, cells from the CHIKV-inoculated footpad were harvested and labeled for CD45, CD3, CD4, CD8, CD11b and Ly6G. The absolute cell counts of each immune cell subset were calculated based on the total number of live cells determined before labeling. Data are representative of one of two independent experiments and presented as mean ± SD (two-tailed Mann–Whitney U-test, **P = 0.0079 total CD3+, **P = 0.0079 CD3+CD4+, *P = 0.0159 CD3−CD11b+Ly6G+).
- B Increased recruitment of neutrophils in Tlr3−/− mice on 6 dpi was associated with induction of neutrophil-associated molecules/chemokines expression. WT and Tlr3−/−mice (n = 5–6 per group) were infected with CHIKV (106 PFU) by joint footpad inoculation. The level of gene expression was expressed as fold change compared to mock-infected mice footpad (n = 5 per group) after normalization to Gapdh. Data are representative of two independent experiments and presented as mean ± SD (two-tailed Mann–Whitney U-test, **P = 0.0079 Ccr2, *P = 0.317 Defb4, *P = 0.0159 Defb14, *P = 0.0317 Il-1b, *P = 0.0159 Il-8r, *P = 0.0317 Ip-10, *P = 0.0159 Mpo, *P = 0.0317 Mip2).
- C, D Depletion of CD4+ T cells in Tlr3−/− mice reduced severity of joint swelling. Tlr3−/− mice were injected i.p. with rat anti-mouse CD4 antibody to deplete CD4+ T cells on −2 and −1 dpi before CHIKV infection (106 PFU) by joint footpad (n = 5–6 per group) inoculation. (C) Extent of joint inflammation was measured daily and expressed as disease score relative to day 0 (pre-infection), and (D) viremia was determined by viral load quantification. Dotted line indicates the limit of viral load detection. Data are representative of two independent experiments and presented as mean ± SD (two-tailed Mann–Whitney U-test, *P = 0.0159 6 dpi CD4+ T-cell-depleted and T-cell-non-depleted WT mice, *P = 0.0173 4 dpi CD4+ T-cell-depleted and T-cell-non-depleted Tlr3−/− mice, *P = 0.0281 5 dpi CD4+ T-cell-depleted and T-cell-non-depleted Tlr3−/− mice, **P = 0.0087 6 dpi CD4+ T-cell-depleted and T-cell-non-depleted Tlr3−/− mice).
- E Depletion of CD4+ T cells reduced recruitment of neutrophils in Tlr3−/− mice. At 6 dpi, cells from CHIKV-inoculated footpad were harvested and labeled for CD45, CD3, CD4, CD11b and Ly6G. Absolute cell counts of each immune cell subset were calculated according to the total number of live cells determined before labeling. Data are representative of two independent experiments and presented as mean ± SD (two-tailed Mann–Whitney U-test, *P = 0.0159 CD3+CD4+ of CD4+ T-cell-non-depleted WT and Tlr3−/− mice, **P = 0.0079 CD3+CD4+ of CD4+ T-cell-depleted and T-cell-non-depleted WT mice, **P = 0.0043 CD3+CD4+ of CD4+ T-cell-depleted and T-cell-non-depleted Tlr3−/− mice, *P = 0.0317 CD3−CD11b+Ly6G+ of CD4+ T-cell-non-depleted WT and Tlr3−/− mice, **P = 0.0043 CD3−CD11b+Ly6G+ of CD4+ T-cell-depleted and T-cell-non-depleted Tlr3−/− mice).
Although both CD4+ and CD8+ T cells were previously demonstrated to infiltrate the joint footpad, only CD4+ T cells were responsible for the pathology (Teo et al, 2013). Therefore, it would be compelling to assess the number of CD4+ T cells in Tlr3−/− mice. Interestingly, the number of infiltrating CD4+ T cells in the joint footpad was significantly reduced by half (Fig4A). Joint inflammation was significantly reduced both in CHIKV-infected WT and Tlr3−/− mice depleted of CD4+ T cells when compared to controls (Fig4C), indicating that joint pathology is mediated by CD4+ T cells in both groups. However, depleting CD4+ T cells did not modify the viremia in both WT and Tlr3−/− mice (Figure4D), demonstrating that virus replication is independent of CD4+ T cells. Furthermore, CD4+ T-cell depletion resulted in a significant reduction in Ly6G+ neutrophils infiltration at 6 dpi (Fig4E), supporting earlier observations (Figure3) that neutrophils are a vital mediator of footpad joint inflammation in Tlr3−/− mice.
TLR3-expressing hematopoietic cells are required for effective CHIKV clearance
It is well established that hematopoietic and non-hematopoietic cells are engaged in the control of CHIKV infection by the innate immune system (Her et al, 2010; Schilte et al, 2010). To next assess whether effective CHIKV clearance could be mediated directly by TLR3-expressing hematopoietic cells, bone marrow chimeric mice were generated by lethal irradiation of WT mice, followed by adoptive transfer of either WT (referred to as WT→WT) or Tlr3−/− (referred to as Tlr3−/−→WT) bone marrow cells. Upon successful bone marrow engraftment after 6 weeks, chimeric mice were infected with recombinant FLuc-CHIKV by footpad inoculation and monitored for joint inflammation, viremia and CHIKV dissemination. Strikingly, Tlr3−/−→WT chimeras suffered significantly higher viremia from 5 dpi onward and endured delayed virus clearance till 14 dpi (Fig5A), but joint inflammation and bioluminescence signals detected in body and CHIKV-infected footpad were not significantly different when compared to WT→WT chimeras (Fig5B and C). The similar degree of joint inflammation observed between these two groups further substantiate that the differences observed in joint inflammation between WT and Tlr3−/− mice were not mediated by TLR3 deficiency in hematopoietic cells. Nonetheless, these results indicate that TLR3-expressing hematopoietic cells are the main subsets required for effective CHIKV clearance. This notion was further supported by the converse bone marrow engraftment experiments, where a significant reduction in viremia was observed in the WT→Tlr3−/− chimeras, even though the WT→Tlr3−/− chimeras still displayed a similar level of joint inflammation comparable to the Tlr3−/−→Tlr3−/− chimeras (Fig5D–F).
Figure 5. Tlr3−/−→WT and Tlr3−/−→Tlr3−/− bone marrow chimeras were impaired in CHIKV clearance.

- A, D WT and Tlr3−/− mice (n = 4–7 per group) were lethally irradiated and reconstituted with bone marrow cells from WT or Tlr3−/−mice. Chimeric mice were infected with CHIKV (106 PFU) by joint footpad inoculation after 6 wks. Viremia was determined by viral load quantification. Dotted line indicates the limit of viral load detection. Data are representative of two independent experiments and presented as mean ± SD (two-tailed Mann–Whitney U-test, **P = 0.0095 5–7 dpi viremia WT recipient chimera, *P = 0.0139 8 dpi viremia WT recipient chimera, **P = 0.0095 10 dpi viremia WT recipient chimera, *P = 0.0350 4 dpi viremia Tlr3−/− recipient chimera, **P = 0.0082 5 dpi viremia Tlr3−/− recipient chimera, *P = 0.0221 6 dpi viremia Tlr3−/− recipient chimera, **P = 0.0012 7 dpi viremia Tlr3−/− recipient chimera, **P = 0.0082 8 dpi viremia Tlr3−/− recipient chimera).
- B, E Extent of joint inflammation was measured daily and expressed as disease score relative to day 0 (pre-infection). Data are representative of two independent experiments and presented as mean ± SD (two-tailed Mann–Whitney U-test, *P = 0.0117 4 dpi disease score Tlr3−/− recipient chimera, *P = 0.0146 5 dpi disease score Tlr3−/− recipient chimera).
- C, F CHIKV dissemination is not modulated in WT and Tlr3−/− chimeras. Bioluminescence signals of whole body was quantified and expressed as average radiance (p/s/cm2/sr). The lowest limit of detection is 0 p/s/cm2/sr. Data are representative of one of two independent experiments and presented as mean ± SD (two-tailed Mann–Whitney U-test, *P = 0.0381 1 dpi whole-body WT recipient chimera, **P = 0.0082 1 dpi whole-body Tlr3−/− recipient chimera).
Impaired virus clearance in Tlr3−/− mice is due to diminished recognition of CHIKV E2 glycoprotein
Chimera and T-cell depletion experiments suggested a role for TLR3 signaling on B cells in virus control. The role of B cells in mediating virus clearance was demonstrated with CHIKV-specific antibodies that map to epitopes within the CHIKV E1 and E2 glycoproteins (Kam et al, 2012b; Lum et al, 2013). These antibodies were demonstrated to exhibit high neutralizing activities in both macaque and murine models (Kam et al, 2012b, 2014; Lum et al, 2013). This led us to further examine whether the impaired virus clearance observed in Tlr3−/− mice (Fig2A and Supplementary Fig S3C and D) was due to a defective CHIKV-specific antibody response. The levels of CHIKV-specific total IgM and IgG antibodies in sera of infected mice collected at 0, 3, 6, 9, 12 and 15 dpi were first determined using virion-based ELISA (Fig6A and B). CHIKV-specific IgM antibodies were detected on 3 dpi and peaked at 6 dpi with no difference between the WT and Tlr3−/− mice (Fig6A). CHIKV-specific IgGs were detected later, from 6 dpi, and their levels continued to increase substantially up to 15 dpi (Fig6B). These results indicated that the delayed virus clearance observed in Tlr3−/− mice was not due to the inability to produce CHIKV-specific antibodies. Interestingly, the level of CHIKV-specific total IgG antibodies was significantly higher in Tlr3−/− mice than from WT mice at 6 dpi (Fig6B), but this did not translate to a higher CHIKV-neutralizing capacity as demonstrated by the in vitro neutralizing assay (Kam et al, 2012b) (Fig6C). Intriguingly, serially diluted pooled sera taken at 6 dpi from Tlr3−/− mice significantly showed in vitro lower neutralizing activity against CHIKV compared to sera from WT mice (Fig6C). Similar observations were obtained using pooled sera taken during complete virus clearance at 15 dpi from Tlr3−/− mice (Fig6D) and Tlr3−/−→Tlr3−/−chimeras (Supplementary Fig S8A). Neutralizing activity was significantly reduced against CHIKV compared to sera from WT and WT→Tlr3−/− chimeras, respectively.
Figure 6. TLR3 modulates early CHIKV-specific IgG response in mice.

- A, B Total CHIKV-specific IgM (A) and IgG (B) levels were determined from serum samples collected at 0, 3, 6, 9, 12 and 15 dpi at a dilution of 1:100 and 1:2,000, respectively, using purified CHIKV virion-based ELISA. Data are representative of two independent experiments and presented as mean ± SD (two-tailed Mann–Whitney U-test, **P = 0.0087 6 dpi IgG).
- C, D Neutralizing capacity of pooled sera collected at 6 dpi (C) and 15 dpi (D) from WT mice is significantly higher than from Tlr3−/− mice. Pooled sera were diluted 1:50–1:5,000 and mixed with CHIKV (MOI 10) for 2 h before infection of HEK 293T cells for 6 h. Assays were performed in quintuplicate, and data are expressed relative to virus-only-infected samples without sera. Dotted line indicates the detection limit of assay determined from mock-infected samples. Data are representative of two independent experiments and presented as mean ± SD (two-tailed Mann–Whitney U-test, **P = 0.0079 6 dpi 1:500 serum dilution, **P = 0.0079 6 dpi 1:5,000 serum dilution, *P = 0.0286 15 dpi 1:50 serum dilution, *P = 0.0286 15 dpi 1:500 serum dilution, *P = 0.0286 15 dpi 1:5,000 serum dilution).
- E, F Mapping antibody reactivity to linear B-cell epitopes within CHIKV E2 proteome. CHIKV E2 epitopes recognized at 6 dpi (E) and 15 dpi (F) were determined in pooled sera collected from infected mice using ELISA specific for overlapping 18-mer linear peptides spanning the CHIKV E2 proteome. The peptide numbers correspond to the position of the 18-mer linear peptides along the CHIKV E2 proteome. Structural data were retrieved from PDB (id: 3N44 and 2XFB) and visualized using the software CHIMERA (Pettersen et al, 2004). Assays were performed in triplicate and expressed as relative fold change after normalizing to OD450 from non-infected sera. Data are representative of two independent experiments and presented as mean ± SD (two-tailed unpaired t-test, *P = 0.0191 6 dpi epitope 381, *P = 0.038 6 dpi epitope E2EP3, ***P = 0.0004 15 dpi epitope 381, ***P = 0.0001 15 dpi epitope E2EP3).
- G Localization of identified CHIKV B-cell epitopes (381; blue, 388; green, E2EP3; red) within CHIKV proteome. Epitopes in the E2 glycoprotein were located based on the structural data obtained from PDB records: 3N42. Number corresponds to the region of amino acid sequences in our overlapping 18-mer linear peptides library, along the CHIKV viral genome. All representations are shown in frontal and back view.
Studies using plasma samples from CHIKV-infected patients and sera from CHIKV-infected WT mice have revealed that most of the linear B-cell epitopes recognized by CHIKV-specific antibodies are localized in the E2 glycoprotein (Kam et al, 2012a,b; Lum et al, 2013). Based on these observations, linear B-cell epitopes were screened to assess whether the decreased neutralizing capacity of anti-CHIKV antibodies from Tlr3−/− mice was associated with diminished epitope recognition. Using the optimized peptide-based ELISA described (Kam et al, 2012b; Lum et al, 2013), linear peptides covering the E2 glycoprotein proteome (Supplementary Table S1) were screened with diluted sera (1:500) from mice collected at 6 and 15 dpi (Fig6E and F and Supplementary Fig S8B). Linear peptides were screened individually and only three peptides were detected to exhibit significant differences toward the sera between WT and Tlr3−/− mice (Fig6E and F). Recognition of these three peptides (381, 388 and E2EP3) by CHIKV-specific antibodies from Tlr3−/− mice was significantly diminished compared to WT mice (Fig6E–G). Specifically, recognition of an early detection serological epitope ‘E2EP3’, which is a dominant linear B-cell epitope in CHIKV-infected patients and animal models (Kam et al, 2012a,b; Lum et al, 2013), was significantly diminished (FigE–G). Moreover, sera from Tlr3−/−→Tlr3−/− chimeras were also less neutralizing and similarly associated with a reduced recognition of the same dominant linear E2 epitopes analyzed in Tlr3−/− mice (Supplementary Fig S8B). These observations strongly indicate that the impaired virus clearance in Tlr3−/− mice is related to the diminished recognition of dominant linear epitopes in the E2 glycoprotein that are functionally important for virus neutralization (Kam et al, 2012b).
TLR3 SNP rs6552950 is associated with disease severity and CHIKV-specific IgG neutralizing antibody capacity in CHIKV-infected patients
To examine the clinical relevance of TLR3-mediated immunity in CHIKV pathogenesis, transcriptional analysis was carried out in PBMCs of patients with CHIKV. TLR3 levels were significantly higher in CHIKV-infected patients when compared to healthy controls during the acute and early convalescent phases of CHIKV infection (Fig7A). These results suggest that TLR3-mediated signaling forms part of the early innate immune response against CHIKV.
Figure 7. TLR3 is highly induced in CHIKV-infected patients during the early disease phase and TLR3 SNP rs6552950 is associated with disease severity and specific IgG response.
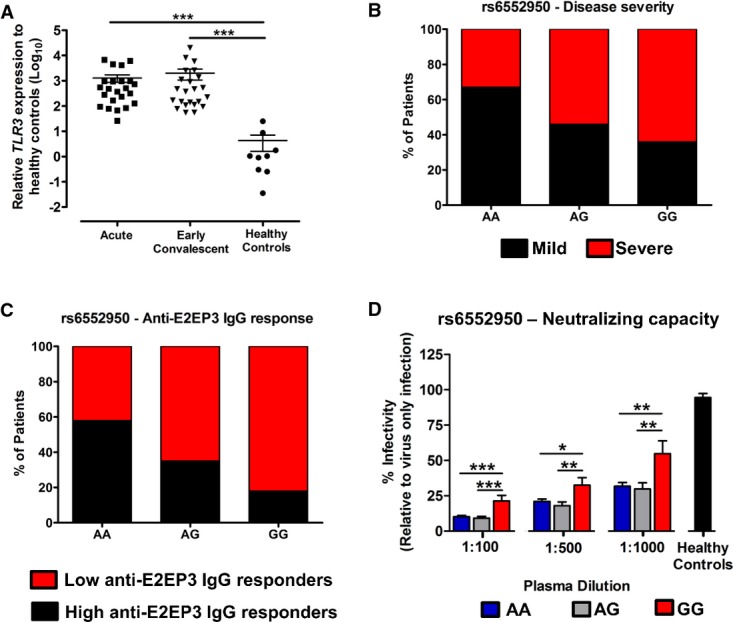
- Transcriptional profiles of TLR3 in PBMCs of CHIKV-infected patients (n = 23) during acute (median 4 days post-illness onset), and early convalescent (median 10 days post-illness onset) disease. The level of TLR3 gene expression was expressed relative to healthy controls (n = 8) after normalization to GAPDH. Data are presented as mean ± SEM (two-tailed Mann–Whitney U-test, ***P = 0.0001 acute versus healthy controls, ***P = 0.0001 early convalescent versus healthy controls).
- TLR3 SNP rs6552950 is associated with disease severity in 94 CHIKV-infected patients. Histogram shows the percentage of patients in each genotype exhibiting either mild or severe disease phenotype. Severe illness is defined as patients having either a maximum temperature greater than 38.5°C, a maximum pulse rate greater than 100 beats/min or a nadir platelet count less than 100 × 109/l. Mild illness is defined as patients who do not fulfill these criteria. Association between SNP genotype (AA, n = 43; AG, n = 24; GG, n = 11; unknown, n = 16) and disease phenotype (Mild—AA, n = 29; AG, n = 11; GG, n = 4; Severe—AA, n = 14; AG, n = 13; GG, n = 7) is performed using logistic regression analysis (Table1); *P = 0.02.
- TLR3 SNP rs6552950 is associated with the degree of anti-E2EP3 IgG response in 69 CHIKV-infected patients. Plasma collected at early convalescent (median 10 days post-illness onset) was subjected to E2EP3 peptide-based ELISA at a dilution of 1:2,000. Histogram shows the percentage of patients in each genotype exhibiting either low or high anti-E2EP3 IgG response. Low and high anti-E2EP3 IgG response were defined as being below or above the mean value of anti-E2EP3 IgG response, respectively. Association between SNP genotypes (AA, n = 38; AG, n = 20; GG, n = 11) and anti-E2EP3 IgG response (low—AA, n = 16; AG, n = 13; GG, n = 9; high—AA, n = 22; AG, n = 7; GG, n = 2) is performed using logistic regression analysis; *P = 0.0376.
- TLR3 SNP rs6552950 is associated with the CHIKV-specific antibody neutralizing capacity in 69 CHIKF patients. Plasma collected at early convalescent (median 10 days post-illness onset) was diluted 1:100–1:1,000 and mixed with CHIKV (MOI 10) for 2 h before infection of HEK 293T cells for 6 h. Assays were performed in quadruplicate, and data are expressed relative to virus-only-infected samples without sera. Data are presented as mean ± SEM. Comparison among SNP genotypes (AA, n = 38; AG, n = 20; GG, n = 11) is performed using one-way ANOVA analysis followed by Tukey's multiple comparison test. ***P = 0.0001 1:100 serum dilution GG versus AA, ***P = 0.0001 1:100 serum dilution GG versus AG, *P = 0.0178 1:500 serum dilution GG versus AA, **P = 0.0056 1:500 serum dilution GG versus AG, **P = 0.0037 1:1,000 serum dilution GG versus AA, **P = 0.0041 1:1,000 serum dilution GG versus AG.
SNP genotyping analysis of 10 TLR3 tagSNPs was performed in 94 CHIKF patients to establish the impact of TLR3 polymorphisms on CHIKV-induced disease outcome. Association with CHIKV phenotypes revealed that SNP rs3775292 and SNP rs6552950 had significant nominal association to disease occurrence when compared to population controls from the 1000 genome project (Table1) (1000 Genomes Project Consortium et al, 2010). In both SNPs, the minor alleles were associated with increased disease susceptibility as indicated by the odds ratios (OR) (Table1). Stratified analysis of these TLR3 tagSNPs to disease severity revealed that a non-coding variant SNP rs6552950 had a nominal association with disease severity with an OR of 2.39 (P < 0.05) in severe CHIKF patients when compared to mild CHIKF patients (Table1 and Fig7B). In addition, anti-E2EP3 IgG response determined from 69 available patients' plasma in this study cohort further revealed that patients with SNP rs6552950 genotype associated with severe disease outcome and with low anti-E2EP3 IgG response during early convalescence phase (logistic regression analysis; P < 0.05) (Fig7C). Complementing the observations in Tlr3−/− mice (Fig6A), CHIKV-specific antibody neutralizing assays performed from the plasma of these 69 patients revealed that patients with GG genotype had significantly less neutralizing antibodies as compared to patients with AA or AG genotypes (Fig7D). Taken together, these results suggest that TLR3 polymorphism in humans could influence the neutralizing capacity of CHIKV-specific IgGs by modulating the recognition of CHIKV E2EP3 epitope important for virus neutralization. Specifically, SNP rs3775292 and SNP rs6552950 may be susceptibility factors for CHIKF, with SNP rs6552950 having a possible role in disease severity due to low anti-E2EP3 IgG response.
Table 1.
Association of TLR3 SNPs to CHIKV phenotype and severity.
| Information of TLR3 SNPs | Comparison of SNP allele frequency to population controlsa | Association of SNP with CHIKV disease severityb | |||||||
|---|---|---|---|---|---|---|---|---|---|
| SNPc | Chromosomed | Positione | Minor Allelef | STATg | P-valueh | OR (L95–U95)i | STAT | P-value | OR (L95–U95) |
| rs3775292 | 4 | 187003025 | C | 3.06 | 0.002* | 2.16 (1.31–3.42) | −0.63 | 0.53 | 0.80 (0.4–1.6) |
| rs6552950 | 4 | 186994856 | G | 2.11 | 0.03* | 1.54 (1.03–2.29) | 2.39 | 0.02* | 2.31 (1.16–4.57) |
| rs7657186 | 4 | 186994039 | A | 1.62 | 0.11 | 1.43 (0.93–2.21) | −1.32 | 0.19 | 0.61 (0.29–1.28) |
| rs11721827 | 4 | 186991137 | C | −1.22 | 0.22 | 0.70 (0.39–1.24) | −0.20 | 0.84 | 0.90 (0.33–2.46) |
| rs5743312 | 4 | 187000256 | T | 1.08 | 0.28 | 1.28 (0.82–2.00) | −0.91 | 0.36 | 0.71 (0.33–1.5) |
| rs7668666 | 4 | 187001292 | A | 0.92 | 0.36 | 1.20 (0.81–1.78) | 0.12 | 0.91 | 1.04 (0.54–2.01) |
| rs3775291 | 4 | 187004074 | T | 0.82 | 0.41 | 1.18 (0.79–1.76) | 0.47 | 0.64 | 1.15 (0.64–2.09) |
| rs13108688# | 4 | 186994832 | A | −0.42 | 0.68 | 0.92 (0.60–1.39) | −0.83 | 0.41 | 0.72 (0.33–1.56) |
| rs3775296 | 4 | 186997767 | A | 0.34 | 0.73 | 1.08 (0.71–1.63) | −0.89 | 0.37 | 0.74 (0.38–1.45) |
Population controls consist of 60 CEU, 60 CHBJPT and 59 YRI individuals sequenced by the 1000 Genomes Pilot Project.
‘Severe disease’ is defined as patients who had either a maximum temperature greater than 38.5°C, a maximum pulse rate greater than 100 beats/min or a nadir platelet count less than 100 × 109/l. ‘Mild disease’ is referred to patients who do not fulfill these criteria.
SNP, Single nucleotide polymorphism from TLR3 gene; SNPs rs5743316 and rs5743310 were excluded from further analysis due to failed Sequenom assay design and being monomorphic in control populations, respectively. #SNP rs13108688 was not in Hardy–Weinberg equilibrium in the population.
Chromosome, Position, Chromosome and corresponding position (in base pair) where the SNP is located.
Minor Allele, The rare allelic form of the SNP variant.
STAT, Statistic obtained for the regression analysis for the SNP.
P,P-value obtained for the regression analysis; *Significant P-value < 0.05 is indicated in bold.
OR(L95–U95), Odds ratio for the SNP as estimated from the minor allele with 95% confidence interval limits.
Discussion
The detection of PAMPs by PRRs to elicit an inflammatory response is an essential process of the host innate immune response against pathogens (Janeway & Medzhitov, 2002). TLR3-mediated immunity to natural infection in humans has been demonstrated to both limit and exacerbate viral disease progression. It has been shown that defects in TLR3 signaling axis rendered both humans and mice permissive to HSV-1 encephalitis infection (Zhang et al, 2007; Pérez de Diego et al, 2010; Reinert et al, 2012). The immunological control of HSV in the central nervous system was proposed to be mediated through astrocytes which sense HSV-2 in a TLR3-dependent manner and restricts virus replication by inducing anti-viral IFNβ response (Reinert et al, 2012). In the case of West Nile virus infection, TLR3 was either protective or deleterious to the host by limiting virus replication in neurons or promoting efficient virus entry into the brain, respectively, depending on the route of inoculation (Wang et al, 2004; Daffis et al, 2008).
Although studies have emerged demonstrating the functions of RIG-I/MDA5-mediated signaling in anti-CHIKV host response (Schilte et al, 2010; White et al, 2011; Rudd et al, 2012; Olagnier et al, 2014), the precise roles of TLRs as PRRs for CHIKV remain unknown. In this study, TLR3 was demonstrated to be a critical PRR in the control of CHIKV replication, immunity and pathology in humans and mice. The increased susceptibility of both TRIF−/− and Tlr3−/− primary fibroblasts to CHIKV infection demonstrates a role of TLR3 in controlling CHIKV replication. Furthermore, the loss of TLR3 expression in CHIKV-infected mice significantly increased viremia and exacerbated CHIKV-induced inflammation. However, these findings are in contrast to an earlier report where TLR3 was reported to play a modest role in controlling CHIKV infection in young mice (Schilte et al, 2010). This disparity could be due to the age of the animals and the different inoculation routes used. When inoculated intradermally, CHIKV triggered a strong local type I IFN response that was sufficient to locally control virus replication in WT mice and hence no effect on TLR3 signaling (Schilte et al, 2010). However, in this study, the effect of TLR3 signaling is apparent because the type I IFN response is independent of TLR3 and therefore insufficient to locally control CHIKV replication during the early phase of the infection.
By tracking virus dissemination using a recombinant FLuc-CHIKV, the loss of TLR3 clearly resulted in exacerbated CHIKV-induced pathology in mice. Moreover, a marked tropism was observed for skeletal muscle, joints and skin in WT and Tlr3−/− mice. The increased pathology in Tlr3−/− mice was mediated by an increased infiltration of Ly6G+ neutrophils into the infected joint footpad with F4/80+ macrophages, which were previously shown to be the primary cellular infiltrates (Gardner et al, 2010; Rudd et al, 2012; Teng et al, 2012). While the exact role of neutrophils in the development of CHIKV-induced inflammation remains unclear, neutrophils were recently implicated in the control of CHIKV infection in mouse (Dhanwani et al, 2014; Poo et al, 2014) and zebrafish (Palha et al, 2013) models. The increased infiltration of myeloid cells is accompanied by the reduction in CD4+ T-cell infiltration. However, depletion of CD4+ T cells prevented the pathology and abrogated neutrophils without interfering with the development of the viremia. This demonstrated that CD4+ T cells are essential for the pathology in WT and Tlr3−/− mice. One plausible explanation for the exacerbation of joint footpad inflammation in Tlr3−/− mice is that the loss of TLR3 may reduce the number of anti-inflammatory CD4+ T regulatory cells present in the infiltrate. However, this is highly unlikely as demonstrated by bone marrow reconstitution experiments. If TLR3 negatively controlled the number of CD4+ T regulatory cells, the WT mice reconstituted with Tlr3−/− bone marrow would have less CD4+ T regulatory T cells. This was not case since WT mice reconstituted with Tlr3−/− bone marrow had the same level of joint inflammation as the WT mice reconstituted with WT bone marrow.
The dissemination of CHIKV into the brains of Tlr3−/− mice is of particular interest because, unlike other organs, the brains of WT mice were not infected. CHIKV is not commonly neurotropic, but the occurrence of CHIKV-associated neurological complications has been increasingly reported in patients since the 2006 Indian Ocean outbreak (Rampal et al, 2007; Wielanek et al, 2007; Das et al, 2010; Kashyap et al, 2010). Although previous studies in mice have shown that CHIKV dissemination into the central nervous system is dependent on type I IFN signaling (Couderc et al, 2008; Abraham et al, 2013), it remains to be elucidated whether this is a bystander effect due to overwhelming CHIKV replication or whether the blood–brain barrier has been breached due to the absence of TLR3, permitting virus entry into the brain.
Infection in bone marrow chimeric mice provided evidence on how TLR3-expressing hematopoietic cells are required to elicit an anti-CHIKV innate immune response and regulate CHIKV infection and pathology. Since the role of CD4+ T cells was shown to be important for the pathology in the WT and Tlr3−/− mice via the control of neutrophils recruitment, this suggested that B-cell responses could be defective in Tlr3−/− mice. Growing evidence has also shown that activation of TLRs promotes B-cell proliferation and IgG isotype class switch (Ruprecht & Lanzavecchia, 2006; Xu et al, 2008; Sariol et al, 2011). Here, the production of CHIKV-specific IgM and IgG antibodies was not disrupted by the loss of TLR3, and the IgG response was even higher at 6 dpi. Rather, the reduced CHIKV-neutralizing capacity was due to diminished recognition for neutralizing linear B-cell epitopes located in the CHIKV E2 glycoprotein (Kam et al, 2012a,b; Lum et al, 2013). The loss of TLR3 expression could modulate CHIKV antigen (Ag) processing and presentation by APCs, particularly the immunodominant ‘E2EP3’ epitope, to result in an immunodominance shift (Siddiqui & Basta, 2011). Other virus infection models have demonstrated that TLR3 stimulation in dendritic cells decreases production of nitric oxide which in turn increases proteasomal activity and consequently increases viral antigen processing and presentation (Schwarz et al, 2000; Siddiqui et al, 2011).
Transcriptional analysis of PBMCs isolated from CHIKV-infected patients revealed that TLR3 expression was up-regulated during the acute and early convalescent phase of the disease. Transcriptional analysis of other PRRs such as RIG-I, MDA5 and IPS-1 (adaptor molecule involved in RIG-I and MDA5 mediated signaling) has shown that these molecules were similarly significantly up-regulated and associated with viral load during acute CHIKV infection (Teng et al, 2012), suggesting that the enhanced TLR3 expression is part of a general innate immunity against CHIKV. Previous genetic epidemiological studies have implicated inborn errors in TLR3 immunity and polymorphism in the pathogenesis of HSV-1 encephalitis (Zhang et al, 2007; Herman et al, 2012; Lafaille et al, 2012) and Influenza virus infection (Esposito et al, 2012). While the number of CHIKF patients in our study is too small to demonstrate any direct functional link between TLR3 gene polymorphisms and CHIKV disease outcomes, our findings suggest a possible relationship between the presence of TLR3 SNPs, rs3775292 and rs6552950 with an increased risk of CHIKV disease occurrence. In particular, the SNP rs6552950 polymorphism was demonstrated to be associated with severe CHIKV disease outcome in patients from the Singapore 2008 CHIKV cohort. Antibody response studies in these patients have demonstrated that naturally acquired neutralizing IgG response is dominated by anti-E2EP3 IgG antibodies (Kam et al, 2012b). Furthermore, the low anti-E2EP3 IgG response in the SNP rs6552950 GG genotype patients was demonstrated to have reduced neutralizing antibodies, which in turn influenced the severity of disease outcomes in these patients. SNP rs3775292 was previously reported to associate with persisting IgG concentration and serum bactericidal antibody following serogroup C meningococcal polysaccharide–protein conjugate vaccination and an increased risk of colon cancer development (Moore et al, 2011; Slattery et al, 2011). It will be insightful to assess whether these SNPs would lead to a loss of TLR3 function in larger patient cohorts, including the emergent CHIKV outbreaks in the Caribbean islands (Leparc-Goffart et al, 2014).
Collectively, we provided clear evidences for TLR3 in the control of CHIKV infection. The synergy of TLR3 with multiple host RNA sensors such as RIG-I and MDA5 is indispensable for specific interactions with viral dsRNA to restrict CHIKV replication by inducing a rapid anti-viral type I IFN response together with pro-inflammatory gene expression (Fig8). Essentially, TLR3-mediated immunity controls CHIKV-induced pathology by preventing rapid virus dissemination. The observations reported here also provide further insights on how TLR3-mediated innate responses against CHIKV infection can influence the adaptive immune response, as well as the mechanisms by which TLR3 modulates in vivo CHIKV immune recognition. These findings provide a better understanding on one of the key components that induce protective anti-CHIKV responses and will have critical implications in the future development of novel therapeutic strategies against CHIKV and other clinically important alphaviruses that have serious global health impacts.
Figure 8. Proposed model for TLR3-mediated anti-CHIKV response during infection.

Upon CHIKV infection of the target cell, TLR3 functions (blue arrows) in synergy with multiple host cytosolic RNA sensors such as RIG-I and MDA5, to vanguard the coordinated endosomal and cytoplasmic recognition of CHIKV RNA, triggering anti-viral type I IFN response and expression of pro-inflammatory genes. This concerted activation acts to restrict CHIKV replication (red arrows). In parallel, the stimulation of cells will up-regulate TLR3 expression and enhance the anti-CHIKV response. Consequently, activation of TLR3 signaling mediates protection from CHIKV-induced pathology by preventing rapid CHIKV dissemination and restricting tissue tropism (red arrows) tied in with assistance from chemokine regulation (blue arrows). TLR3 signaling can also modulate CHIKV immune recognition during the adaptive immune response to promote effective CHIKV clearance through the production of CHIKV-specific immunodominant antibodies by B cells. Therefore, a loss of TLR3 would lead to a reduction in CHIKV antibody neutralizing capacity due to an impaired production of such antibodies, resulting in the persistence of CHIKV viremia in vivo and enhanced/increased disease severity.
Materials and Methods
Study approval
Blood samples from CHIKF patients used in this study were collected by Institute of Infectious Disease and Epidemiology at Tan Tock Seng Hospital from 1 August through September 23, 2008 with approval from the National Healthcare Group's domain-specific ethics review board (DSRB Reference no. B/08/026). Written informed consent was obtained from all participants in accordance with the Declaration of Helsinki principles. All animal protocols were approved by the Institutional Animal Care and Use Committee (IACUC no. 120714) at the Biological Resource Center at Biopolis, Singapore. All studies involving animals are reported in accordance with the ARRIVE guidelines for reporting experiments involving animals (Kilkenny et al, 2010).
Study population
A total of 94 PCR-confirmed CHIKV-positive individuals were included in this study. There were 48 Chinese, 26 Malay, 10 Indians and 10 of other ethnicity. The median age was 38 with a range of 21 to 67 years of age with 77.7% male and 22.3% female. Based on the clinical parameters defined in Chow et al (2011) and Ng et al (2009), these individuals were further classified into 53 mild and 41 severe cases. Illness was defined as ‘severe’, if a patient had either a maximum temperature greater than 38.5°C, a maximum pulse rate greater than 100 beats/min or a nadir platelet count less than 100 × 109/l. Patients who do not fulfill these criteria are classified as ‘mild’ (Ng et al, 2009; Chow et al, 2011).
Cell culture
African green monkey kidney epithelial cells (Vero-E6), HEK293T, and a mouse hepatocyte cell line (Hepa 1–6) were cultured in DMEM supplemented with 10% FBS (Gibco). Mouse tail fibroblasts were cultured in DMEM supplemented with 10% FBS and 1% penicillin–streptomycin. Aedes albopictus mosquito cell line (C6/36) was cultured in Leibovitz's L-15 medium (Life Technologies) supplemented with 10% FBS. All cells were maintained at 37°C with 5% CO2, except for the C6/36 cell line which was maintained at 28°C without CO2 supplementation.
Genotyping and association analysis
A total of 11 tagSNPs were identified to cover the linkage disequilibrium block for TLR3 gene. Genotyping was performed using matrix-assisted laser desorption/ionization time of flight mass spectrometry (MALDI-TOF MS) for the determination of allele-specific primer extension products using Sequenom's MassARRAY system and iPLEX technology (Sequenom Inc). One SNP (rs5743316) failed Sequenom assay design. The design of oligonucleotides was carried out according to the guidelines of Sequenom and performed using MassARRAY Assay Design software. Multiplex PCR amplification of amplicons containing the SNPs of interest was performed using QIAGEN HotStart Taq Polymerase using 5 ng of genomic DNA. Primer extension reactions were carried out according to manufacturer's instructions for iPLEX chemistry. Assay data were analyzed using the Sequenom TYPER software. Clustering of genotype calls was evaluated to determine that the clustering was sufficient for inclusion in the statistical analysis. All SNPs were tested for Hardy–Weinberg equilibrium for quality control and subjected to further statistical analysis. Population controls used for association analysis were the 179 samples sequenced by the 1000 Genomes Pilot Project (60 CEU, 60 CHB+JPT, 59 YRI) (1000 Genomes Project Consortium et al, 2010). Sequenom genotypes for SNPs in reverse strand notation (SNPs rs3775291 and rs3775292) were converted to a forward strand notation using the option –flip provided by the software PLINK v1.07 (Purcell et al, 2007). One of the 10 TLR3 SNPs (rs5743310) was monomorphic in two of the three control populations (CEU and CHBJPT) and was therefore excluded from further analysis. Association between the other 9 TLR3 SNPs and the CHIKV infection phenotype was computed using a logistic regression model. Association between TLR3 SNPs and severity (mild/severe) was computed using a logistic regression model that included gender and age as covariates. One SNP rs13108688 was not in Hardy–Weinberg equilibrium (P < 0.005) in the population; however, this SNP was not significant for association. Both association analyses were performed using the software PLINK v1.07 (Purcell et al, 2007). P-values lower than 0.05 were considered significant. The distribution of each TLR3 SNP genotype and disease severity for each SNP genotype is listed in Supplementary Table S2.
Virus stocks
CHIKV-IMT isolate used for in vitro infections of human cells was isolated from Reunion Island during the 2006 CHIKF outbreak (Bessaud et al, 2006). Virus stocks were prepared in Vero-E6 cultures, washed and pre-cleared by centrifugation before storing at −80°C. CHIKV-SGP011 isolate used for in vitro and in vivo infections in mouse studies was isolated from an outbreak in Singapore in 2008 at the National University Hospital (Her et al, 2010) and propagated in Hepa 1–6 and C6/36 cultures, respectively. CHIKV variants expressing FLuc was constructed using a full-length infectious cDNA clone of CHIKV LR2006-OPY1 isolate as described (Tsetsarkin et al, 2006; Pohjala et al, 2011; Teng et al, 2012). Infectious viruses were propagated in C6/36 cultures, washed and pre-cleared by ultracentrifugation before storing at −80°C. Virus titer of all virus stocks used was determined using standard plaque assays with Vero-E6 cells (Her et al, 2010; Kam et al, 2012b).
Virus infections
CHIKV infections on primary fibroblasts and continuous cell lines from mouse and human were performed at multiplicity of infection (MOI) 10. Each infection mix consisted of virus suspension prepared in serum-free medium. Viruses were incubated at 37°C and allowed to adsorb for 1.5 h with intermittent shaking before virus inoculum was removed and replaced with complete medium. Cells were incubated at 37°C until harvest at different hpi. Mock infections (medium only) were performed in parallel as controls.
Flow cytometry and antibodies
Detection of CHIKV Ag was carried out in a two-step indirect intracellular labeling process (Her et al, 2010; Teng et al, 2012). Data were acquired in BD FACSCanto™ II (BD Bioscience) using BD FACSDiva™ software. Dead cells and duplets were excluded in all analysis with FSC/SSC gating. Results were analyzed with FlowJo version 7.5 software (Tree Star, Inc). Antibodies against CHIKV Ag were purchased from Santa Cruz Biotechnology. Antibodies against mouse CD45 (cat# 557659) and CD8 (cat# 553035) were purchased from BD Bioscience. Antibodies against mouse CD11b (cat# 12-0112-82) was purchased from eBioscience. Antibodies against mouse CD3 (cat# 100200), CD4 (cat# 100531) and Ly6G (cat# 127612) were purchased from Biolegend. Mouse CD4-depleting antibody (cat# BE0003-1) and rat IgG2b isotype control (cat# BE0090) were purchased from Bio X cell.
Viral RNA extraction and viral load analysis
Viral RNA was extracted using QIAamp® Viral RNA Mini Kit (QIAGEN) according to manufacturer's instructions. Quantification of CHIKV non-structural protein (nsP) 1 negative-sense RNA was determined according to a quantitative real-time PCR (qRT-PCR) TaqMan assay adapted from Plaskon et al (Plaskon et al, 2009) using QuantiTect® Probe RT-PCR Kit (QIAGEN) in 12.5 μl reaction vol. All reactions were performed using 7900HT Fast Real-Time PCR System machine (Applied Biosciences) with thermal cycling conditions as described previously (Teng et al, 2012). The limit of detection was 10 RNA copies/μl.
Total RNA extraction and gene expression analysis
Total RNA was extracted using RNeasy® Mini Kit (QIAGEN) according to manufacturer's instructions. Quantification of total RNA was performed using NanoDrop 1000 Spectrophotometer (Thermo Scientific), and RNA samples were further diluted to 10 ng/μl. qRT-PCR was performed using QuantiFast™ SYBR® Green RT-PCR Kit (QIAGEN) according to manufacturer's recommendations in 12.5 μl reaction vol. All reactions were performed using 7900HT Fast Real-Time PCR System machine (Applied Biosciences) with thermal cycling conditions as described (Teng et al, 2012). The fold change for each gene between CHIKV-infected and mock-infected was calculated as 2−ΔΔCt (Teng et al, 2012). The primer sequences of the mouse genes analyzed are listed in Supplementary Table S3.
Animal studies
Three-week-old WT or Tlr3−/− C57/BL6 female mice were inoculated s.c. in the ventral side of the right-hind footpad toward the ankle with 106 PFU CHIKV in 25 μl PBS in a non-randomized and non-blinded fashion. Viral RNA extraction was performed from 10 μl of blood collected from the tail, and viremia was determined by qRT-PCR as described (Teng et al, 2012; Lum et al, 2013; Teo et al, 2013). For joint (footpad) inoculated mice, joint inflammation by the measurement of the height (thickness) and the breadth of the footpad using a vernier caliper was calculated as [height × breadth]. The degree of inflammation was expressed as relative increase compared to pre-infection (day 0; d 0) with the following formula: [(x − d 0)/d 0] where x is footpad size measurements for respective dpi as described (Kam et al, 2012b). For joint footpad extraction, mice were sacrificed by terminal anesthesia with ketamine [150 mg/kg]/xylazin [10 mg/kg] followed by intra-cardial perfusion with PBS. Joint footpads were removed and preserved in Trizol (Invitrogen) at −80°C. Tissues were homogenized using a rotor–stator homogenizer (Xiril Dispomix) at 500 g for 15 s. Homogenized tissues were transferred to clean tubes and mixed with 230 μl of chloroform. Following 2-min incubation, tissue mixtures were centrifuged at 13,523 g for 15 min at 4°C. The aqueous phase was collected, and total RNA isolated as described (Teng et al, 2012). For bone marrow chimera, 6-week-old recipient mice were irradiated twice with 600Rad (3 h apart) and i.v. injected with 106 donor bone marrow cells. Absolute CD45+ leukocyte blood count was determined at week 4–6 post-reconstitution using flow cytometry and compared to non-chimeric mice of same age. To test for successful adoptive bone marrow cell transfer, Tlr3 expression in peripheral blood leukocytes from reconstituted mice was determined 6 weeks after reconstitution using quantitative real-time PCR analysis before proceeding with infection. Depletion of CD4+ T cells was performed as described (Teo et al, 2013). Each mouse was i.p. injected with 500 μg of either CD4-depleting antibody or rat IgG2b isotype control on −2, −1 and 4 dpi. Complete CD4+ T-cell depletion was assessed before CHIKV inoculation (day 0).
In vivo imaging
Bioluminescence signals were assessed daily from 1 to 8 dpi and subsequently on every alternate day until 20 dpi using an in vivo bioluminescence imaging system (IVIS Spectrum, Xenogen) as described (Teo et al, 2013). Luciferin solution containing the luciferase substrate, D-luciferin potassium salt (Caliper Life sciences), was prepared by dissolving in PBS at a concentration of 5 mg/ml. Mice were shaved and anesthetized in an oxygen-rich induction chamber with 2% isoflurane. Bioluminescence signals were measured 2 min after s.c. injection of 100 μl of luciferin solution. Whole-body imaging was performed with the animals in a ventral position, while the feet and head were imaged with the animals in a dorsal position. Bioluminescence imaging was acquired with a field of view (FOV) of 21.7 cm for whole body (FOV-D) and 13.1 cm for foot and head (FOV-C). The mice were exposed for an initial 60 s, followed by a 4-min delay before another exposure at 60 s. When luminescence readings were above the upper detection limit of machine, the exposure time was reduced and kept consistent across groups. Bioluminescence signals of the region of interest were quantified using the Living Image 3.0 software (Caliper Life sciences) and expressed as average radiance (p/s/cm2/sr). The lowest detection limit is 0 p/s/cm2/sr.
Histology
Mice were terminally anesthetized with ketamine [150 mg/kg]/xylazin [10 mg/kg] and perfused with PBS by intra-cardial injection. Tissues were fixed in 4% paraformaldehyde (PFA), decalcified and embedded in paraffin wax before 5-μm-thick sections were cut and underwent H&E or immunohistochemical (IHC) staining against mouse Ly6G (Biolegend, cat# 127602), CD11B (AbCam, cat# ab75476) and F4/80 (DAKO, cat# K3468) using established protocols (Teng et al, 2012).
Virion-based ELISA
CHIKV-specific antibody titers were assessed by virion-based ELISA (Kam et al, 2012c). Polystyrene 96-well microtiter plates (MaxiSorp, Nunc) were coated with purified CHIKV (106 infectious units per well). Wells were blocked with PBS containing 0.05% Tween 20 and 5% non-fat milk (0.05% PBST + 5% milk) for 1.5 h at 37°C. Serum samples were diluted in 0.05% PBST + 2.5% milk before adding to wells and incubating for 1 h at 37°C. Separately, HRP-conjugated goat anti-mouse IgM (Santa Crus, cat# sc-2064) or IgG (Santa Cruz, cat# sc-2005) were used to detect mouse antibodies bound to virus-coated wells. Reactions were developed using 3,3′,5,5′-tetramethylbenzidine substrate (Sigma-Aldrich) and terminated by Stop reagent (Sigma-Aldrich). Absorbance at 450 nm was measured using a TECAN Infinite® M200 microplate reader and analyzed using Magellan™ software.
Sero-neutralization
Neutralizing capacity of antibodies from CHIKV-infected mice was analyzed by immunofluorescence-based cell infection assays using HEK 293T cells (Kam et al, 2012b). Different amounts of infectious virus required to achieve an infection of MOI 10 were mixed with diluted (1:50–1:5,000), heat-inactivated human plasma or pooled mouse sera and incubated for 2 h at 37°C with gentle agitation (350 rpm). Virus–antibody mixtures were then added to HEK 293T cells seeded on fibronectin-coated 96-well plates and incubated for 1.5 h at 37°C. Virus inoculum was removed and replaced with DMEM supplemented with 10% FBS and incubated for 6 h at 37°C before being fixed with 4% PFA and permeabilized in PBS containing 0.2% Tween 20. Cells were incubated with mouse anti-alphavirus mAb (Santa Cruz, cat# sc-58088) at 1:500 dilution in PBS followed by incubation with Alexa Fluor 488-conjugated goat anti-mouse IgG F(ab’)2 ab (Invitrogen, cat# A11017) at 1:500 dilution in PBS. Nuclei were stained with DAPI (1 μg/μl stock) at 1:10,000 dilution in PBS followed by immunofluorescence quantification using the Cellomics ArrayScan high content analysis reader (Thermo Scientific).
Peptide-based ELISA
Streptavidin-coated polystyrene 96-well microtiter plates (Pierce, Thermo Scientific) were blocked with 0.1% PBST supplemented with 1% w/v sodium caseinate (Sigma-Aldrich) for 1 h at RT before being coated with biotinylated 18-mer overlapping peptides synthesized based on consensus E2 glycoprotein sequence (Kam et al, 2012b) for 1 h at RT. Mouse serum diluted 1:500 (mouse) or human plasma diluted 1:2,000 in 0.1% PBST and 0.1% w/v sodium caseinate were added and incubated for 1 h at RT followed by the addition of relevant HRP-conjugated goat secondary IgG (Santa Cruz, cat# sc-2005) to detect bound antibodies. Reactions were developed using 3,3′,5,5′-tetramethylbenzidine substrate (Sigma-Aldrich) and terminated by Stop reagent (Sigma-Aldrich). Absorbance at 450 nm was measured using TECAN Infinite® M200 microplate reader and analyzed using Magellan™ software.
Statistical analysis
Statistics were performed using Prism 5.01 (GraphPad Software). Pairwise comparison between infected and mock-infected primary fibroblasts from human and mice was performed using two-tailed unpaired t-test. Pairwise comparison between WT and Tlr3−/− mice in animal studies was performed using two-tailed Mann–Whitney U-test. TLR3 SNPs association analysis (disease severity and anti-E2EP3 IgG response) was performed using logistic regression analysis, while CHIKV-neutralizing capacity association was performed using one-way ANOVA analysis followed by Tukey's multiple comparison test. P-values less than 0.05 are considered statistically significant.
The paper explained.
Problem
Chikungunya fever has re-emerged as an important human arboviral infection of global significance, but the factors determining host immunity and pathology are still largely unknown. Toll-like receptors (TLRs) are crucial sensors of virus infection mediated through the recognition of viral nucleic acids, although until now, their role in Chikungunya virus (CHIKV) infection has not been clearly established.
Results
The susceptibility to CHIKV infection is markedly increased in both human TRIF-deficient and mouse TLR3-deficient fibroblasts with defective TLR3 signaling. The absence of TLR3 expression in Tlr3−/− mice resulted in higher viremia and more pronounced joint inflammation due to increased pro-inflammatory myeloid cells infiltration. Mechanistically, infection in bone marrow chimeric mice showed that TLR3-expressing hematopoietic cells are required for effective CHIKV clearance and pointed toward a role for B cells. Tlr3−/− mice's impaired ability to effectively clear CHIKV was due to a shift in anti-virus antibody specificity that led to a reduced recognition of virus-neutralizing B-cell epitopes by anti-CHIKV IgG. The clinical relevance of TLR3 was further investigated in CHIKV-infected patients, where the level of TLR3 transcripts was increased in PBMCs of patients. Single nucleotide polymorphism (SNP) genotyping analysis on TLR3 from 94 patients identified SNP rs6552950 as associated with disease severity and as in mice, a reduced antibody response.
Impact
This is the first direct evidence on how TLR3-mediated innate responses against CHIKV infection can influence the adaptive immune response, as well as the mechanisms by which TLR3 modulates in vivo CHIKV immune recognition. It is timely, relevant and significant to the field.
Acknowledgments
We thank Jean-Laurent Casanova and his team (Shen-Ying Zhang, Vanessa Sancho-Shimizu, Michael J. Ciancanelli) from Rockefeller University for providing the human primary TRIF−/− fibroblasts. We thank Anis Larbi and the SIgN Flow Cytometry core for assistance with cytometry analysis. We are grateful to Michael Poidinger for assistance with genotyping analysis and to Ruo-Yan Ong, Irina Shalova and Hong-Rong Loh from SIgN for technical assistance. We also thank the Advanced Molecular Pathology Laboratory (IMCB, A*STAR) for performing the histology work. We acknowledge Kai-Er Eng from SIgN and Lucy Robinson of Insight Editing London for assistance with manuscript editing. This research was funded by SIgN, A*STAR and supported by the Biomedical Research Council, A*STAR, and European Union FP7 project ‘Integrated Chikungunya Research’ (ICRES; Grant no. 261202). Zhisheng Her and Fok-Moon Lum are supported by the President's Graduate Fellowship from the Yong Loo Lin School of Medicine, National University of Singapore. Teck-Hui Teo is supported by the A*STAR postgraduate scholarship. Wendy W.L. Lee is supported by the postgraduate scholarship from the NUS Graduate School for Integrative Science and Engineering. The funders had no role in study design, data collection and analysis, decision to publish, or preparation of the manuscript.
Author contributions
ZH, T-ST, JJLT, T-HT, F-ML, WWLL, CG, RM, AKA, Y-WK, VL, AL, MKW, AC, SKB, Y-SL and AM performed the experiments, provided the clinical and experimental reagents and analyzed the data. ZH, T-ST, JJLT, T-HT, ML, LR and LFPN conceptualized the study, analyzed the data and wrote the manuscript. All authors read and approved the manuscript.
Conflict of interest
The authors declare that they have no conflict of interest.
Supporting Information
Supplementary Tables and Figures
Supplementary Video S1
Supplementary Video S2
Supplementary Video S3
Supplementary Video S4
Review Preocess File
References
- 1000 Genomes Project Consortium. Abecasis GR, Altshuler D, Auton A, Brooks LD, Durbin RM, Gibbs RA, Hurles ME, McVean GA. A map of human genome variation from population-scale sequencing. Nature. 2010;467:1061–1073. doi: 10.1038/nature09534. [DOI] [PMC free article] [PubMed] [Google Scholar]
- Abraham R, Mudaliar P, Padmanabhan A, Sreekumar E. Induction of cytopathogenicity in human glioblastoma cells by Chikungunya virus. PLoS One. 2013;8:e75854. doi: 10.1371/journal.pone.0075854. [DOI] [PMC free article] [PubMed] [Google Scholar]
- AbuBakar S, Sam IC, Wong PF, MatRahim N, Hooi PS, Roslan N. Reemergence of endemic Chikungunya, Malaysia. Emerg Infect Dis. 2007;13:147–149. doi: 10.3201/eid1301.060617. [DOI] [PMC free article] [PubMed] [Google Scholar]
- Ansumana R, Jacobsen KH, Leski TA, Covington AL, Bangura U, Hodges MH, Lin B, Bockarie AS, Lamin JM, Bockarie MJ, et al. Reemergence of Chikungunya virus in Bo, Sierra Leone. Emerg Infect Dis. 2013;19:1108–1110. doi: 10.3201/eid1907.121563. [DOI] [PMC free article] [PubMed] [Google Scholar]
- Arpaia N, Barton GM. Toll-like receptors: key players in antiviral immunity. Curr Opin Virol. 2011;1:447–454. doi: 10.1016/j.coviro.2011.10.006. [DOI] [PMC free article] [PubMed] [Google Scholar]
- Bessaud M, Peyrefitte CN, Pastorino BA, Tock F, Merle O, Colpart JJ, Dehecq JS, Girod R, Jaffar-Bandjee MC, Glass PJ, et al. Chikungunya virus strains, Reunion Island outbreak. Emerg Infect Dis. 2006;12:1604–1606. doi: 10.3201/eid1210.060596. [DOI] [PMC free article] [PubMed] [Google Scholar]
- Borgherini G, Poubeau P, Jossaume A, Gouix A, Cotte L, Michault A, Arvin-Berod C, Paganin F. Persistent arthralgia associated with Chikungunya virus: a study of 88 adult patients on Reunion Island. Clin Infect Dis. 2008;47:469–475. doi: 10.1086/590003. [DOI] [PubMed] [Google Scholar]
- Centers for Disease Control and Prevention. Chikungunya outbreak—Cambodia, February-March 2012. Morb Mortal Wkly Rep. 2012;61:737–740. [PubMed] [Google Scholar]
- Chow A, Her Z, Ong EKS, Chen JM, Dimatatac F, Kwek DJC, Barkham T, Yang H, Renia L, Leo YS, et al. Persistent arthralgia induced by Chikungunya virus infection is associated with IL-6 and GM-CSF. J Infect Dis. 2011;203:149–157. doi: 10.1093/infdis/jiq042. [DOI] [PMC free article] [PubMed] [Google Scholar]
- Couderc T, Chrétien F, Schilte C, Disson O, Brigitte M, Guivel Benhassine F, Touret Y, Barau G, Cayet N, Schuffenecker I, et al. A mouse model for Chikungunya: young age and inefficient Type I interferon signaling are risk factors for severe disease. PLoS Pathog. 2008;4:e29. doi: 10.1371/journal.ppat.0040029. [DOI] [PMC free article] [PubMed] [Google Scholar]
- Daffis S, Samuel MA, Suthar MS, Gale MJ, Diamond MS. Toll-like receptor 3 has a protective role against West Nile virus infection. J Virol. 2008;82:10349–10358. doi: 10.1128/JVI.00935-08. [DOI] [PMC free article] [PubMed] [Google Scholar]
- Das T, Jaffar-Bandjee MC, Hoarau JJ, Krejbich Trotot P, Denizot M, Lee-Pat-Yuen G, Sahoo R, Guiraud P, Ramful D, Robin S, et al. Chikungunya fever: CNS infection and pathologies of a re-emerging arbovirus. Prog Neurobiol. 2010;91:121–129. doi: 10.1016/j.pneurobio.2009.12.006. [DOI] [PubMed] [Google Scholar]
- Deller JJ, Russell PK. Chikungunya disease. Am J Trop Med Hyg. 1968;17:107–111. doi: 10.4269/ajtmh.1968.17.107. [DOI] [PubMed] [Google Scholar]
- Dhanwani R, Khan M, Lomash V, Rao PVL, Ly H, Parida M. Characterization of Chikungunya virus induced host response in a mouse model of viral myositis. PLoS One. 2014;9:e92813. doi: 10.1371/journal.pone.0092813. [DOI] [PMC free article] [PubMed] [Google Scholar]
- Duong V, Andries AC, Ngan C, Sok T, Richner B, Asgari-Jirhandeh N, Bjorge S, Huy R, Ly S, Laurent D, et al. Reemergence of Chikungunya virus in Cambodia. Emerg Infect Dis. 2012;18:2066–2069. doi: 10.3201/eid1812.120471. [DOI] [PMC free article] [PubMed] [Google Scholar]
- Enserink M. Crippling virus set to conquer Western Hemisphere. Science. 2014;344:678–679. doi: 10.1126/science.344.6185.678. [DOI] [PubMed] [Google Scholar]
- Esposito S, Molteni C, Giliani S, Mazza C, Scala A, Tagliaferri L, Pelucchi C, Fossali E, Plebani A, Principi N. Toll-like receptor 3 gene polymorphisms and severity of pandemic A/H1N1/2009 influenza in otherwise healthy children. Virol J. 2012;9:270. doi: 10.1186/1743-422X-9-270. [DOI] [PMC free article] [PubMed] [Google Scholar]
- Gardner J, Anraku I, Le TT, Larcher T, Major L, Roques P, Schroder WA, Higgs S, Suhrbier A. Chikungunya virus arthritis in adult wild-type mice. J Virol. 2010;84:8021–8032. doi: 10.1128/JVI.02603-09. [DOI] [PMC free article] [PubMed] [Google Scholar]
- Gitlin L, Barchet W, Gilfillan S, Cella M, Beutler B, Flavell RA, Diamond MS, Colonna M. Essential role of MDA-5 in type I IFN responses to polyriboinosinic:polyribocytidylic acid and encephalomyocarditis picornavirus. Proc Natl Acad Sci USA. 2006;103:8459–8464. doi: 10.1073/pnas.0603082103. [DOI] [PMC free article] [PubMed] [Google Scholar]
- Goffic RL, Balloy V, Lagranderie M, Alexopoulou L, Escriou N, Flavell R, Chignard M, Si-Tahar M. Detrimental contribution of the Toll-like receptor (TLR)3 to Influenza A virus induced acute pneumonia. PLoS Pathog. 2006;2:e53. doi: 10.1371/journal.ppat.0020053. [DOI] [PMC free article] [PubMed] [Google Scholar]
- Gowen BB, Hoopes JD, Wong MH, Jung KH, Isakson KC, Alexopoulou L, Flavell RA, Sidwell RW. TLR3 deletion limits mortality and disease severity due to Phlebovirus infection. J Immunol. 2006;177:6301–6307. doi: 10.4049/jimmunol.177.9.6301. [DOI] [PubMed] [Google Scholar]
- Her Z, Malleret B, Chan M, Ong EKS, Wong SC, Kwek DJC, Tolou H, Lin RTP, Tambyah PA, Rénia L, et al. Active infection of human blood monocytes by Chikungunya virus triggers an innate immune response. J Immunol. 2010;184:5903–5913. doi: 10.4049/jimmunol.0904181. [DOI] [PubMed] [Google Scholar]
- Herman M, Ciancanelli M, Ou YH, Lorenzo L, Klaudel-Dreszler M, Pauwels E, Sancho-Shimizu V, Pérez de Diego R, Abhyankar A, Israelsson E, et al. Heterozygous TBK1 mutations impair TLR3 immunity and underlie herpes simplex encephalitis of childhood. J Exp Med. 2012;209:1567–1582. doi: 10.1084/jem.20111316. [DOI] [PMC free article] [PubMed] [Google Scholar]
- Janeway CA, Medzhitov R. Innate immune recognition. Annu Rev Immunol. 2002;20:197–216. doi: 10.1146/annurev.immunol.20.083001.084359. [DOI] [PubMed] [Google Scholar]
- Josseran L, Paquet C, Zehgnoun A, Caillere N, Le Tertre A, Solet JL, Ledrans M. Chikungunya disease outbreak, Reunion Island. Emerg Infect Dis. 2006;12:1994–1995. doi: 10.3201/eid1212.060710. [DOI] [PMC free article] [PubMed] [Google Scholar]
- Kam YW, Ong EKS, Rénia L, Tong JC, Ng LFP. Immuno-biology of Chikungunya and implications for disease intervention. Microb Infect. 2009;11:1186–1196. doi: 10.1016/j.micinf.2009.09.003. [DOI] [PubMed] [Google Scholar]
- Kam YW, Lee WWL, Simarmata D, Harjanto S, Teng TS, Tolou H, Chow A, Lin RTP, Leo YS, Renia L, et al. Longitudinal analysis of the human antibody response to Chikungunya virus infection: implications for serodiagnosis and vaccine development. J Virol. 2012a;86:13005–13015. doi: 10.1128/JVI.01780-12. [DOI] [PMC free article] [PubMed] [Google Scholar]
- Kam YW, Lum FM, Teo TH, Lee WWL, Simarmata D, Harjanto S, Chua CL, Chan YF, Wee JK, Chow A, et al. Early neutralizing IgG response to Chikungunya virus in infected patients targets a dominant linear epitope on the E2 glycoprotein. EMBO Mol Med. 2012b;4:330–343. doi: 10.1002/emmm.201200213. [DOI] [PMC free article] [PubMed] [Google Scholar]
- Kam YW, Simarmata D, Chow A, Her Z, Teng TS, Ong EKS, Renia L, Leo YS, Ng LFP. Early appearance of neutralizing immunoglobulin G3 antibodies is associated with Chikungunya virus clearance and long-term clinical protection. J Infect Dis. 2012c;205:1147–1154. doi: 10.1093/infdis/jis033. [DOI] [PMC free article] [PubMed] [Google Scholar]
- Kam YW, Lee WWL, Simarmata D, Le Grand R, Tolou H, Merits A, Roques P, Ng LFP. Unique epitopes recognized by antibodies induced in Chikungunya virus-infected non-human primates: implications for the study of immunopathology and vaccine development. PLoS One. 2014;9:e95647. doi: 10.1371/journal.pone.0095647. [DOI] [PMC free article] [PubMed] [Google Scholar]
- Kashyap RS, Morey SH, Chandak NH, Purohit HJ, Taori GM, Daginawala HF. Detection of viral antigen, IgM and IgG antibodies in cerebrospinal fluid of Chikungunya patients with neurological complications. Cerebrospinal Fluid Res. 2010;7:12. doi: 10.1186/1743-8454-7-12. [DOI] [PMC free article] [PubMed] [Google Scholar]
- Kaur P, Ponniah M, Murhekar MV, Ramachandran V, Ramachandran R, Raju HK, Perumal V, Mishra AC, Gupte MD. Chikungunya outbreak, South India, 2006. Emerg Infect Dis. 2008;14:1623–1625. doi: 10.3201/eid1410.070569. [DOI] [PMC free article] [PubMed] [Google Scholar]
- Kilkenny C, Browne WJ, Cuthill IC, Emerson M, Altman DG. Improving bioscience research reporting: the ARRIVE guidelines for reporting animal research. PLoS Biol. 2010;8:e1000412. doi: 10.1371/journal.pbio.1000412. [DOI] [PMC free article] [PubMed] [Google Scholar]
- Lafaille FG, Pessach IM, Zhang SY, Ciancanelli MJ, Herman M, Abhyankar A, Ying SW, Keros S, Goldstein PA, Mostoslavsky G, et al. Impaired intrinsic immunity to HSV-1 in human iPSC-derived TLR3-deficient CNS cells. Nature. 2012;491:769–773. doi: 10.1038/nature11583. [DOI] [PMC free article] [PubMed] [Google Scholar]
- Laras K, Sukri NC, Larasati RP, Bangs MJ, Kosim R, Djauzi WandraT, Master J, Kosasih H, Hartati S, et al. Tracking the re-emergence of epidemic Chikungunya virus in Indonesia. Trans R Soc Trop Med Hyg. 2005;99:128–141. doi: 10.1016/j.trstmh.2004.03.013. [DOI] [PubMed] [Google Scholar]
- Leo YS, Chow AL, Tan LK, Lye DC, Lin L, Ng LC. Chikungunya outbreak, Singapore, 2008. Emerg Infect Dis. 2009;15:836–837. doi: 10.3201/eid1505.081390. [DOI] [PMC free article] [PubMed] [Google Scholar]
- Leparc-Goffart I, Nougairede A, Cassadou S, Prat C, de Lamballerie X. Chikungunya in the Americas. Lancet. 2014;383:514. doi: 10.1016/S0140-6736(14)60185-9. [DOI] [PubMed] [Google Scholar]
- Lum FM, Teo TH, Lee WWL, Kam YW, Rénia L, Ng LFP. An essential role of antibodies in the control of Chikungunya virus infection. J Immunol. 2013;190:6295–6302. doi: 10.4049/jimmunol.1300304. [DOI] [PMC free article] [PubMed] [Google Scholar]
- Moore CE, Hennig BJ, Perrett KP, Hoe JC, Lee SJ, Fletcher H, Brocklebank D, O'Connor D, Snape MD, Hall AJ, et al. Single nucleotide polymorphisms in the Toll-like receptor 3 and CD44 genes are associated with persistence of vaccine-induced immunity to the Serogroup C Meningococcal conjugate vaccine. Clin Vaccine Immunol. 2011;19:295–303. doi: 10.1128/CVI.05379-11. [DOI] [PMC free article] [PubMed] [Google Scholar]
- Nasirudeen AMA, Wong HH, Thien P, Xu S, Lam K-P, Liu DX. RIG-I, MDA5 and TLR3 synergistically play an important role in restriction of Dengue virus infection. PLoS Negl Trop Dis. 2011;5:e926. doi: 10.1371/journal.pntd.0000926. [DOI] [PMC free article] [PubMed] [Google Scholar]
- Neighbours LM, Long K, Whitmore AC, Heise MT. Myd88-dependent TLR7 signaling mediates protection from severe Ross River virus-induced disease in mice. J Virol. 2012;86:10675–10685. doi: 10.1128/JVI.00601-12. [DOI] [PMC free article] [PubMed] [Google Scholar]
- Ng LFP, Chow A, Sun YJ, Kwek DJC, Lim PL, Dimatatac F, Ng LC, Ooi EE, Choo KH, Her Z, et al. IL-1β, IL-6, and RANTES as biomarkers of Chikungunya severity. PLoS One. 2009;4:e4261. doi: 10.1371/journal.pone.0004261. [DOI] [PMC free article] [PubMed] [Google Scholar]
- Nikonov A, Mölder T, Sikut R, Kiiver K, Männik A, Toots U, Lulla A, Lulla V, Utt A, Merits A, et al. RIG-I and MDA-5 detection of viral RNA-dependent RNA polymerase activity restricts positive-strand RNA virus replication. PLoS Pathog. 2013;9:e1003610. doi: 10.1371/journal.ppat.1003610. [DOI] [PMC free article] [PubMed] [Google Scholar]
- Olagnier D, Scholte FEM, Chiang C, Albulescu IC, Nichols C, He Z, Lin R, Snijder EJ, van Hemert MJ, Hiscott J. Inhibition of Dengue and Chikungunya virus infection by RIG-I-mediated type I IFN-independent stimulation of the innate antiviral response. J Virol. 2014;88:4180–4194. doi: 10.1128/JVI.03114-13. [DOI] [PMC free article] [PubMed] [Google Scholar]
- Palha N, Guivel-Benhassine F, Briolat V, Lutfalla G, Sourisseau M, Ellett F, Wang CH, Lieschke GJ, Herbomel P, Schwartz O, et al. Real-time whole-body visualization of Chikungunya virus infection and host interferon response in zebrafish. PLoS Pathog. 2013;9:e1003619. doi: 10.1371/journal.ppat.1003619. [DOI] [PMC free article] [PubMed] [Google Scholar]
- Pérez de Diego R, Sancho-Shimizu V, Lorenzo L, Puel A, Plancoulaine S, Picard C, Herman M, Cardon A, Durandy A, Bustamante J, et al. Human TRAF3 adaptor molecule deficiency leads to impaired Toll-like receptor 3 response and susceptibility to Herpes Simplex encephalitis. Immunity. 2010;33:400–411. doi: 10.1016/j.immuni.2010.08.014. [DOI] [PMC free article] [PubMed] [Google Scholar]
- Pettersen EF, Goddard TD, Huang CC, Couch GS, Greenblatt DM, Meng EC, Ferrin TE. UCSF Chimera—A visualization system for exploratory research and analysis. J Comput Chem. 2004;25:1605–1612. doi: 10.1002/jcc.20084. [DOI] [PubMed] [Google Scholar]
- Plaskon NE, Adelman ZN, Myles KM. Accurate strand-specific quantification of viral RNA. PLoS One. 2009;4:e7468. doi: 10.1371/journal.pone.0007468. [DOI] [PMC free article] [PubMed] [Google Scholar]
- Pohjala L, Utt A, Varjak M, Lulla A, Merits A, Ahola T, Tammela P. Inhibitors of Alphavirus entry and replication identified with a stable Chikungunya replicon cell line and virus-based assays. PLoS One. 2011;6:e28923. doi: 10.1371/journal.pone.0028923. [DOI] [PMC free article] [PubMed] [Google Scholar]
- Poo YS, Nakaya H, Gardner J, Larcher T, Schroder WA, Le TT, Major LD, Suhrbier A. CCR2 deficiency promotes exacerbated chronic erosive neutrophil-dominated Chikungunya virus arthritis. J Virol. 2014;88:6862–6872. doi: 10.1128/JVI.03364-13. [DOI] [PMC free article] [PubMed] [Google Scholar]
- Purcell S, Neale B, Todd-Brown K, Thomas L, Ferreira MAR, Bender D, Maller J, Sklar P, de Bakker PIW, Daly MJ, et al. PLINK: a tool set for whole-genome association and population-based linkage analyses. Am J Hum Genet. 2007;81:559–575. doi: 10.1086/519795. [DOI] [PMC free article] [PubMed] [Google Scholar]
- Queyriaux B, Armengaud A, Jeannin C, Couturier E, Peloux Petiot F. Chikungunya in Europe. Lancet. 2008;371:723–724. doi: 10.1016/S0140-6736(08)60337-2. [DOI] [PubMed] [Google Scholar]
- Rampal, Sharda M, Meena H. Neurological complications in Chikungunya fever. J Assoc Physicians India. 2007;55:765–769. [PubMed] [Google Scholar]
- Reinert LS, Harder L, Holm CK, Iversen MB, Horan KA, Dagnæs-Hansen F, Ulhøi BP, Holm TH, Mogensen TH, Owens T, et al. TLR3 deficiency renders astrocytes permissive to Herpes Simplex virus infection and facilitates establishment of CNS infection in mice. J Clin Invest. 2012;122:1368–1376. doi: 10.1172/JCI60893. [DOI] [PMC free article] [PubMed] [Google Scholar]
- Rudd PA, Wilson J, Gardner J, Larcher T, Babarit C, Le TT, Anraku I, Kumagai Y, Loo YM, Gale M, et al. Interferon response factors 3 and 7 protect against Chikungunya virus hemorrhagic fever and shock. J Virol. 2012;86:9888–9898. doi: 10.1128/JVI.00956-12. [DOI] [PMC free article] [PubMed] [Google Scholar]
- Ruprecht CR, Lanzavecchia A. Toll-like receptor stimulation as a third signal required for activation of human naive B cells. Eur J Immunol. 2006;36:810–816. doi: 10.1002/eji.200535744. [DOI] [PubMed] [Google Scholar]
- Sancho-Shimizu V, Pérez de Diego R, Lorenzo L, Halwani R, Alangari A, Israelsson E, Fabrega S, Cardon A, Maluenda J, Tatematsu M, et al. Herpes simplex encephalitis in children with autosomal recessive and dominant TRIF deficiency. J Clin Invest. 2011;121:4889–4902. doi: 10.1172/JCI59259. [DOI] [PMC free article] [PubMed] [Google Scholar]
- Sariol CA, Martínez MI, Rivera F, Rodríguez IV, Pantoja P, Abel K, Arana T, Giavedoni L, Hodara V, White LJ, et al. Decreased Dengue replication and an increased anti-viral humoral response with the use of combined Toll-Like Receptor 3 and 7/8 agonists in Macaques. PLoS One. 2011;6:e19323. doi: 10.1371/journal.pone.0019323. [DOI] [PMC free article] [PubMed] [Google Scholar]
- Schilte C, Couderc T, Chretien F, Sourisseau M, Gangneux N, Guivel-Benhassine F, Kraxner A, Tschopp J, Higgs S, Michault A, et al. Type I IFN controls Chikungunya virus via its action on nonhematopoietic cells. J Exp Med. 2010;207:429–442. doi: 10.1084/jem.20090851. [DOI] [PMC free article] [PubMed] [Google Scholar]
- Schilte C, Buckwalter MR, Laird ME, Diamond MS, Schwartz O, Albert ML. Cutting edge: independent roles for IRF-3 and IRF-7 in hematopoietic and nonhematopoietic cells during host response to Chikungunya infection. J Immunol. 2012;188:2967–2971. doi: 10.4049/jimmunol.1103185. [DOI] [PubMed] [Google Scholar]
- Schwarz K, de Giuli R, Schmidtke G, Kostka S, van den Broek M, Kim KB, Crews CM, Kraft R, Groettrup M. The selective proteasome inhibitors Lactacystin and Epoxomicin can be used to either up- or down-regulate antigen presentation at nontoxic doses. J Immunol. 2000;164:6147–6157. doi: 10.4049/jimmunol.164.12.6147. [DOI] [PMC free article] [PubMed] [Google Scholar]
- Siddiqui S, Alatery A, Kus A, Basta S. TLR engagement prior to virus infection influences MHC-I antigen presentation in an epitope-dependent manner as a result of nitric oxide release. J Leukoc Biol. 2011;89:457–468. doi: 10.1189/jlb.0610357. [DOI] [PubMed] [Google Scholar]
- Siddiqui S, Basta S. CD8+ T cell immunodominance in Lymphocytic Choriomeningitis virus infection is modified in the presence of Toll-like receptor agonists. J Virol. 2011;85:13224–13233. doi: 10.1128/JVI.05996-11. [DOI] [PMC free article] [PubMed] [Google Scholar]
- Slattery ML, Herrick JS, Bondurant KL, Wolff RK. Toll-like receptor genes and their association with colon and rectal cancer development and prognosis. Int J Cancer. 2011;130:2974–2980. doi: 10.1002/ijc.26314. [DOI] [PMC free article] [PubMed] [Google Scholar]
- Soulaphy C, Souliphone P, Phanthavong K, Phonekeo D, Phimmasine S, Khamphaphongphane B, Kitthiphong V, Lewis HC. Emergence of Chikungunya in Moonlapamok and Khong Districts, Champassak province, the Lao People's Democratic Republic, May to September 2012. Western Pac Surveill Response J. 2013;4:46–50. doi: 10.5365/WPSAR.2012.3.4.017. [DOI] [PMC free article] [PubMed] [Google Scholar]
- Suh HS, Zhao ML, Rivieccio M, Choi S, Connolly E, Zhao Y, Takikawa O, Brosnan CF, Lee SC. Astrocyte indoleamine 2,3-dioxygenase is induced by the TLR3 ligand Poly(I:C): mechanism of induction and role in antiviral response. J Virol. 2007;81:9838–9850. doi: 10.1128/JVI.00792-07. [DOI] [PMC free article] [PubMed] [Google Scholar]
- Tabeta K, Georgel P, Janssen E, Du X, Hoebe K, Crozat K, Mudd S, Shamel L, Sovath S, Goode J, et al. Toll-like receptors 9 and 3 as essential components of innate immune defense against mouse Cytomegalovirus infection. Proc Natl Acad Sci USA. 2004;101:3516–3521. doi: 10.1073/pnas.0400525101. [DOI] [PMC free article] [PubMed] [Google Scholar]
- Teng TS, Foo SS, Simamarta D, Lum FM, Teo TH, Lulla A, Yeo NKW, Koh EGL, Chow A, Leo YS, et al. Viperin restricts Chikungunya virus replication and pathology. J Clin Invest. 2012;122:4447–4460. doi: 10.1172/JCI63120. [DOI] [PMC free article] [PubMed] [Google Scholar]
- Teo TH, Lum FM, Claser C, Lulla V, Lulla A, Merits A, Renia L, Ng LFP. A pathogenic role for CD4+ T cells during Chikungunya virus infection in mice. J Immunol. 2013;190:259–269. doi: 10.4049/jimmunol.1202177. [DOI] [PubMed] [Google Scholar]
- Tsetsarkin K, Higgs S, McGee CE, De Lamballerie X, Charrel RN, Vanlandingham DL. Infectious clones of Chikungunya virus (La Réunion isolate) for vector competence studies. Vector Borne Zoonotic Dis. 2006;6:325–337. doi: 10.1089/vbz.2006.6.325. [DOI] [PubMed] [Google Scholar]
- Wang T, Town T, Alexopoulou L, Anderson JF, Fikrig E, Flavell RA. Toll-like receptor 3 mediates West Nile virus entry into the brain causing lethal encephalitis. Nat Med. 2004;10:1366–1373. doi: 10.1038/nm1140. [DOI] [PubMed] [Google Scholar]
- White L, Sali T, Alvarado D, Gatti E, Pierre P, Streblow D, DeFilippis VR. Chikungunya virus induces IPS-1-dependent innate immune activation and PKR-independent translational shutoff. J Virol. 2011;85:606–620. doi: 10.1128/JVI.00767-10. [DOI] [PMC free article] [PubMed] [Google Scholar]
- Wielanek AC, De Monredon J, El Amrani M, Roger JC, Serveaux JP. Guillain-Barre syndrome complicating a Chikungunya virus infection. Neurology. 2007;69:2105–2107. doi: 10.1212/01.wnl.0000277267.07220.88. [DOI] [PubMed] [Google Scholar]
- Willmann O, Ahmad-Nejad P, Neumaier M, Hennerici MG, Fatar M. Toll-like receptor 3 immune deficiency may be causative for HSV-2-associated Mollaret meningitis. Eur Neurol. 2010;63:249–251. doi: 10.1159/000287585. [DOI] [PubMed] [Google Scholar]
- Xu W, Santini PA, Matthews AJ, Chiu A, Plebani A, He B, Chen K, Cerutti A. Viral double-stranded RNA triggers Ig class switching by activating upper respiratory mucosa B cells through an innate TLR3 pathway involving BAFF. J Immunol. 2008;181:276–287. doi: 10.4049/jimmunol.181.1.276. [DOI] [PMC free article] [PubMed] [Google Scholar]
- Yamamoto M, Sato S, Hemmi H, Hoshino K, Kaisho T, Sanjo H, Takeuchi O, Sugiyama M, Okabe M, Takeda K, et al. Role of adaptor TRIF in the MyD88-independent Toll-like receptor signaling pathway. Science. 2003;301:640–643. doi: 10.1126/science.1087262. [DOI] [PubMed] [Google Scholar]
- Yoneyama M, Kikuchi M, Natsukawa T, Shinobu N, Imaizumi T, Miyagishi M, Taira K, Akira S, Fujita T. The RNA helicase RIG-I has an essential function in double-stranded RNA-induced innate antiviral responses. Nat Immunol. 2004;5:730–737. doi: 10.1038/ni1087. [DOI] [PubMed] [Google Scholar]
- Yoneyama M, Kikuchi M, Matsumoto K, Imaizumi T, Miyagishi M, Taira K, Foy E, Loo YM, Gale M, Akira S, et al. Shared and unique functions of the DExD/H-box helicases RIG-I, MDA5, and LGP2 in antiviral innate immunity. J Immunol. 2005;175:2851–2858. doi: 10.4049/jimmunol.175.5.2851. [DOI] [PubMed] [Google Scholar]
- Zhang SY, Jouanguy E, Ugolini S, Smahi A, Elain G, Romero P, Segal D, Sancho-Shimizu V, Lorenzo L, Puel A, et al. TLR3 deficiency in patients with Herpes Simplex encephalitis. Science. 2007;317:1522–1527. doi: 10.1126/science.1139522. [DOI] [PubMed] [Google Scholar]
- Zhang SY, Herman M, Ciancanelli MJ, Pérez de Diego R, Sancho-Shimizu V, Abel L, Casanova JL. TLR3 immunity to infection in mice and humans. Curr Opin Immunol. 2013;25:19–33. doi: 10.1016/j.coi.2012.11.001. [DOI] [PMC free article] [PubMed] [Google Scholar]
Associated Data
This section collects any data citations, data availability statements, or supplementary materials included in this article.
Supplementary Materials
Supplementary Tables and Figures
Supplementary Video S1
Supplementary Video S2
Supplementary Video S3
Supplementary Video S4
Review Preocess File