

Abstract
Due to sampling difficulties, little is known about microbial communities associated with sinking marine snow in the twilight zone. A drifting sediment trap was equipped with a viscous cryogel and deployed to collect intact marine snow from depths of 100 and 400 m off Cape Blanc (Mauritania). Marine snow aggregates were fixed and washed in situ to prevent changes in microbial community composition and to enable subsequent analysis using catalyzed reporter deposition fluorescence in situ hybridization (CARD-FISH). The attached microbial communities collected at 100 m were similar to the free-living community at the depth of the fluorescence maximum (20 m) but different from those at other depths (150, 400, 550, and 700 m). Therefore, the attached microbial community seemed to be “inherited” from that at the fluorescence maximum. The attached microbial community structure at 400 m differed from that of the attached community at 100 m and from that of any free-living community at the tested depths, except that collected near the sediment at 700 m. The differences between the particle-associated communities at 400 m and 100 m appeared to be due to internal changes in the attached microbial community rather than de novo colonization, detachment, or grazing during the sinking of marine snow. The new sampling method presented here will facilitate future investigations into the mechanisms that shape the bacterial community within sinking marine snow, leading to better understanding of the mechanisms which regulate biogeochemical cycling of settling organic matter.
INTRODUCTION
The formation of macroscopic organic aggregates such as marine snow is an important process for the removal of photosynthetically fixed carbon from the surface ocean to the deep sea (1). The export of organic matter is the main driver for the oceanic sequestering of atmospheric carbon dioxide on long time scales (2).
Settling marine snow aggregates harbor diverse microbial communities that play an important role in the degradation of the organic compounds and release of dissolved nutrients and organic matter to the water column (3–5). Therefore, the attached microbial communities may play an important role in the regulation of the magnitude and efficiency of the biological carbon pump. However, little is known about bacterial community composition and dynamics within marine snow collected below the depths reached by scuba divers. This is because the fragile nature of marine snow makes the collection of individual, intact marine snow particles nearly impossible.
Previous investigations have relied on size fractionation of water samples to observe and compare clustering of free-living bacteria to that of bacteria associated with particles (5–8). These studies observed that the composition of the microbial communities associated with particles differed from that of free-living communities in the surrounding water column. However, other studies have found similarities between the free-living and attached microbial communities (9–11), potentially indicating methodological pitfalls in the separation of free-living and attached fractions of the microbial communities by fractionated filtration. Further, fractionated filtration does not select for sinking particles but includes both suspended and sinking particles above a certain size.
Until now, most studies on attached microbial communities from depths below scuba range were done not directly on aggregates collected in situ but through artificial aggregate formation using roller tanks (12–14), through size fractions collected by filtration of water samples to differentiate between free-living and aggregate-associated bacteria (6, 15), or by investigations of bulk material collected using sediment traps (16). Though these methods provide very good model aggregates, the scientific community still needs a method to sample individual, intact, in situ-formed marine snow aggregates at any depth throughout the water column.
This study presents a new method using gel sediment traps to fix, wash, and collect intact sinking marine snow at any depth in situ. This method was used to analyze the bacterial community of individually collected marine snow from 100- and 400-m depths. The microbial communities were analyzed using catalyzed reporter deposition fluorescence in situ hybridization (CARD-FISH) and confocal laser scanning microscopy (CLSM). Additionally, a biovolume approach was used to estimate the abundances of different bacterial groups within the aggregates.
MATERIALS AND METHODS
Sampling.
The free-living and aggregate-associated bacterial communities were sampled during RV Maria S. Merian cruise 18-1 (MSM 18-1) in the area off Cape Blanc (Mauritania) (Fig. 1). The free-living bacterial communities were investigated from water samples collected with a CTD Rosette sampler at depths of 20, 150, 400, 550, and 700 m on 1 May 2011 at station GeoB15704 (20°35′N, 18°03′W), which was at the continental slope and had a total water depth of ∼780 m. At each depth, one liter of water was fixed with formaldehyde (1% final concentration) for 1 to 3 h at room temperature. Thereafter, the samples were size fractionated, and only the size fraction between 3 and 0.22 μm was used for the investigations of the free-living bacteria. Triplicate filtrations of 0.05 to 0.2 liters of seawater were made for each depth and stored frozen at −20°C.
FIG 1.
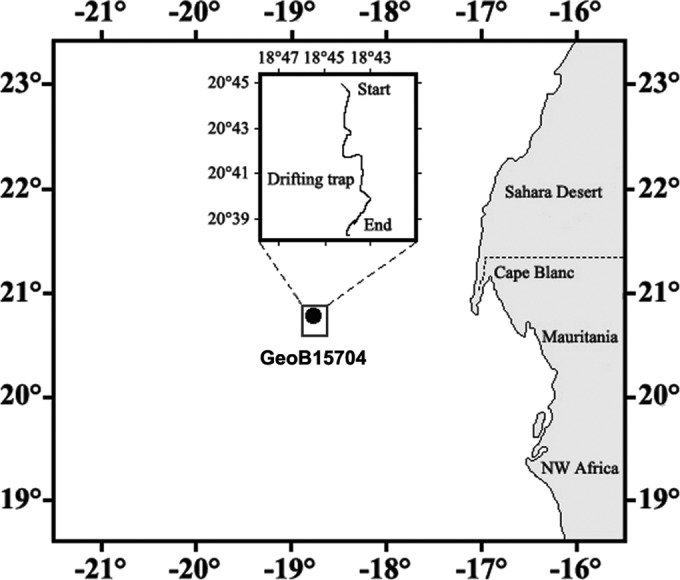
Map of the study area off Cape Blanc, Mauritania. Water samples were collected at depths of 20, 150, 400, 550, and 700 m at station GeoB15704 to quantify the free-living microbial community. Additionally, a surface-tethered freely drifting sediment trap was deployed at station GeoB15704 to collect intact, settling marine snow at 100 and 400 m. The inset shows the track of the surface-tethered drifting sediment trap.
Intact marine snow was collected with a free-drifting sediment trap at depths of 100 and 400 m (Fig. 2). At each collection depth, two 1-m-long trap cylinders with an inner diameter of 10.4 cm were equipped with ∼200 ml of a viscous cryogel (Tissue-Tek OCT [optimum cutting temperature] compound cryogel; Sakura Finetek, Alphen aan den Rijn, Netherlands) to intercept and preserve settling particles without destroying their original size and structure. Previous studies did not show any differences between fresh samples of microbial communities and those embedded in Tissue-Tek cryogel (19). Additionally, visual inspections of laboratory-formed aggregates did not show any changes in their shape and volume after they had been allowed to settle into the gel. The shape and sizes of the aggregates were also preserved after freezing and thawing of the gels. The cryogel was placed in a tight-fitting collection jar at the bottom of each trap cylinder (Fig. 2). The two trap cylinders were attached to the trap array gyroscopically to ensure a vertical position of the cylinders during the entire deployment. This prevented the aggregates coming into contact with the cylinder walls while they settled through the trap cylinders. Twelve small buoyancy balls placed at the surface line of the trap array served as wave breakers to reduce the hydrodynamic effects on the sediment traps. The sediment trap was deployed on 30 April 2011 at 20°45′N, 18°44′W and recovered after 3 days at 20°38′N, 18°43′W (Fig. 1). Upon trap recovery, the gel-filled collection jars from 100- and 400-m depths were removed from the trap and stored at −20°C until further processing (Fig. 2).
FIG 2.

(Top) Drawing of one of the collection cylinders deployed on the sediment trap. The cylinder was filled with the different densities of GF/F-filtered seawater. The lower layer was denser than the layers above. This created three distinct density layers. By adding formaldehyde to the middle layer, we were able to fix the microbial community within marine snow and other aggregates sinking through this layer. The bottom density layer did not contain any formaldehyde and served to wash the fixed marine snow and other aggregates to avoid overfixation of the attached microbes, which prevents the use of fluorescence in situ hybridization. A collection cup filled with a viscous cryogel was placed at the very bottom of the sediment trap cylinder. The viscous gel collected the fixed and washed marine snow and other aggregates and preserved their size and structure. (Bottom) Images of the aggregates collected in the cryogel at 100 m (left) and 400 m (right).
During identification of bacterial groups with CARD-FISH, it is important to fix the bacteria in 1% formaldehyde (final concentration). However, overfixation can prevent staining with the CARD-FISH probe; therefore, the fixed material needs to be washed. To enable both fixing and washing of the bacterial community within the settling aggregates as they sank through the trap cylinders, three density layers, each ∼30 cm high, were made in the cylinders above the gel collection jar. This was done by adding different amounts of sea salt to Whatman glass microfiber filter (GF/F)-sieved seawater collected from the surface with the ship's seawater pump (Fig. 2). The bottom layer had a salinity of ∼42. The middle layer had a salinity of ∼38 and a 1% final concentration of formaldehyde, while the top layer (salinity, ∼34) had only a slightly higher density than the surrounding seawater. No formaldehyde was added to the top and bottom layers, and hence, the latter functioned as the washing layer (Fig. 2). Due to the changes in water density for the different layers, the sinking velocities of the aggregates were slowed when they entered the denser water layers in the traps. Simple estimations using Navier-Stokes drag equation (20) suggested that the residence time of a 1-mm aggregate within each density layer in the trap was ∼4 to 5 h for both depths. This residence time is sufficient for both fixation and washing. Inspection of the three-layer density gradient in the sediment cylinders after trap retrieval showed that each of the three layers had remained intact during the deployment, suggesting that both fixing and washing of the settling aggregates were successful.
Aggregate isolation, filtration, and volume determination.
The water in the sediment cylinders was siphoned out after 12 h sedimentation, and the gel collection jars were removed from the trap cylinders. Around 30 diatom-dominated marine snow aggregates of similar sizes (0.5 to 1 mm in diameter) were isolated from the gel trap deployments at both 100 and 400 m. The individual aggregates were photographed from above and the side before they were removed from the gels. This was done with a Canon EOS 550D digital camera equipped with a Sigma 105-mm macro-zoom objective. The total volume of each aggregate was calculated assuming an ellipsoid shape, and the equivalent spherical diameters (ESD) were then calculated from the volumes. Thereafter, 20 aggregates from each collection depth were individually washed in 1× phosphate-buffered saline (PBS) buffer solution overnight and then broken apart by shaking before they were filtered individually onto 0.22-μm-pore-size polycarbonate filters (Millipore, Billerica, MA, USA) to be used for CARD-FISH analyses.
CARD-FISH.
Quantification of the free-living bacterial and archaeal community was done using CARD-FISH according to Thiele et al. (21) with specific oligonucleotide probes (Table 1). Triplicate filters from water depths of 20, 150, 400, 550, and 700 m were stained with 4′,6-diamidino-2-phenylindole (DAPI) subsequently to the CARD-FISH procedure, and the DAPI and CARD-FISH counts were done with a Zeiss AxioImager.Z2 microscope (Carl Zeiss AG, Jena, Germany) with an automated stage. Image acquisition was done using the software package AxioVision, release 7.6 (Carl Zeiss AG, Jena, Germany), comprising an automated focusing routine, an automated sample area definition using the macro MPISYS, and a manual image quality assessment (22–24). The software took pictures of the DAPI channel (350 nm) and the FISH channel (488 nm) at different fields of view along a track on the sample. These picture pairs were used for the quantification of microbial cells. Only samples with a minimum of 15 picture pairs were taken into account and evaluated using the software ACMEtool 0.76 (www.technobiology.ch).
TABLE 1.
List of oligonucleotides used in this study
| Oligonucleotide | Target organism(s) | Sequence (5′→3′) | E. coli position | FA (%)a | Reference |
|---|---|---|---|---|---|
| EUB 338b | Most Bacteria | GCTGCCTCCCGTAGGAGT | 338–355 | 35 | 55 |
| EUB IIb | Planctomycetales | GCAGCCACCCGTAGGTGT | 338–355 | 35 | 56 |
| EUB IIIb | Verrucomicrobiales | GCTGCCACCCGTAGGTGT | 338–355 | 35 | 56 |
| NON338 | Control | ACTCCTACGGGAGGCAGC | 338–355 | 35 | 57 |
| ARCH915 | Archaea | GTGCTCCCCCGCCAATTCCT | 915–934 | 35 | 58 |
| CREN554 | Thaumarchaeota | TTAGGCCCAATAATCMTCCT | 554–573 | 0 | 59 |
| EURY806 | Euryarchaeota marine group II | CACAGCGTTTACACCTAG | 806–823 | 0 | 60 |
| SAR11 441 | SAR11 clade | AAAAAATACAGTCATTTCCTCCCCCGAC | 441–463 | 25 | 61 |
| ROS537 | Roseobacter clade | CAACGCTAACCCCCTCC | 537–553 | 35 | 62 |
| GAM42ac | Gammaproteobacteria | GCCTCCCCACATCGTTT | 1027–1043 | 35 | 63 |
| ALT1413 | Alteromonas/Colwellia | TTTGCATCCCACTCCCAT | 1413–1430 | 40 | 64 |
| PSA184 | Pseudoalteromonas | CCCCTTTGGTCCGTAGAC | 184–201 | 30 | 64 |
| SAR324 1412 | SAR324 clade | GCCCCTGTCAACTCCCAT | 1412–1429 | 35 | 65 |
| CF319a | Bacteroidetes | TGGTCCGTGTCTCAGTAC | 319–336 | 35 | 66 |
| PLA46 | Planctomycetes | GACTTGCATGCCTAATCC | 46–63 | 30 | 67 |
| SYN405 | Synechococcus | AGAGGCCTTCATCCCTCA | 405–422 | 30 | 68 |
| PRO405 | Prochlorococcus | AGAGGCCTTCGTCCCTCA | 405–422 | 30 | 68 |
FA, formamide concentration of the hybridization buffer.
Used in a mix.
Used in a mix with unlabeled BET42a as competitor.
Analyses of the bacterial communities within marine snow were done using CARD-FISH as described above. Filters containing individual aggregates were cut into one half and two quarters and subjected to CARD-FISH. The half-filters were used for hybridization with a specific probe, while one quarter of the filter was hybridized with the EUB I-III probe mix (Table 1). For each probe, three aggregates were used, and counts were determined relative to the EUB I-III counts from the same filter.
Confocal laser scanning microscopy.
Single aggregates were analyzed using a confocal laser scanning microscope (CLSM) (Zeiss LSM 780; Carl Zeiss AG, Jena, Germany) and the software ZEN2011 (Carl Zeiss AG, Jena, Germany). Three aggregates were analyzed with every probe by selecting two random fragments from each aggregate for the scanning, using single scans of ∼30 to 40 s per focal plane. This resulted in a total of 6 z-stacks per probe, which were used to determine biovolumes of the specific bacterial clade hybridized with this probe, and a total of 38 (100 m) and 39 (400 m) z-stacks of EUB I-III-stained cells, which were used to determine total cell numbers.
Specific biovolume calculation.
Due to the three-dimensional structure of the aggregate, direct cell counting is difficult. Autofluorescence of the aggregate matrix often quenches CARD-FISH signals and hence hinders cell detection and a precise enumeration of cells. Furthermore, cells in close proximity to or overlying one another cannot be distinguished, thus leading to underestimations of total cell numbers. Therefore, the use of biovolume estimations to calculate cell numbers on aggregates circumvented these difficulties and obtained higher precision than tests using manual cell counting. PHLIP (Phobia laser scanning microscopy image processor, v4.0.) was used to obtain biovolumes for each channel of the z-stacks (25) in Matlab R2010b (Mathworks Inc., Natick, MA, USA) using manual threshold settings optimized for each sample.
Biovolume measurements and total bacterial cell count calculation.
A single representative picture was made from each z-stack for each probe to calculate the total cell counts per sample. To do this, the average biovolume of single CARD-FISH-stained bacterial cells was measured from each of the extracted representative single pictures using the YABBA software (22). The total cell counts were calculated by dividing the total cell biovolume with the average biovolume of a single cell. The total cell numbers for each specific probe were divided by the total EUB I-III cell numbers to estimate the abundance of each specific probe relative to the total bacterial abundance. Different intensities of the CARD-FISH signals could lead to errors in the calculation of cell abundance. However, these errors were circumvented by the use of a CLSM. The excitation of the fluorescent dye by a laser with a specific wavelength resulted in CARD-FISH signals with rather uniform intensities, while the confocal technique of the CLSM reduced the problems of halo formation. Hence, these error sources had only minor influences on the calculation of cell counts.
In addition to the probe channel, one channel with a broad detection range was scanned to measure the autofluorescence of each analyzed aggregate fragment for the calculation of its total volume. Total bacterial abundance per volume aggregate was obtained by dividing the total cell numbers by the volume of the analyzed aggregate fragment. However, the filtration of the fragmented aggregates caused the fragments to lose their pore water and collapse on the filters. Therefore, the measured volumes of the investigated fragments must be considered much smaller than they would be in their hydrated state, since marine snow components typically have porosities of ∼99% (26, 27) with the pore space mainly consisting of exchangeable pore water (89 to 98%) and transparent exopolymer particles (28). Therefore, an underestimation of the aggregate volume by excluding the pore water and allowing the aggregate to collapse on the filter is likely. Hence, the bacterial cell numbers per aggregate volume might be overestimated due to the loss of aggregate pore space after filtration, whereby the measured aggregate volumes potentially were <100 times smaller than the in situ volumes of the aggregates. Thus, the measured volumes of the investigated aggregate fragments were corrected by multiplying with a factor of 100 to estimate the minimum total bacterial abundances per aggregate volume.
RESULTS
In situ sampling and facilitation of marine snow aggregates.
Several particle types, including diatom aggregates and fecal pellets, were captured and preserved in their original form and structure within the gel at both trap depths (Fig. 2). Only individual diatom dominated aggregates with similar sizes were picked from the gel traps. The average ESD was 0.70 ± 0.22 mm (n = 31) at 100 m and 0.63 ± 0.19 mm (n = 31) at 400 m, and there were no significant differences between the two depths (Student's t test; P > 0.05).
Bacterial abundances on aggregates.
The total corrected bacterial abundances per volume aggregate were not significantly different (P = 0.053; Mann-Whitney rank sum test) between the aggregates collected at the two depths. However, a tendency toward a higher abundance per volume aggregate and more variability in in situ-collected marine snow at 400 m in comparison to that at 100 m was observed. Cell numbers ranged from 1.4 × 10⁸ cells cm−3 to 6.3 × 10⁹ cells cm−3, with a median of 3.8 × 10⁸ cells cm−3 at a depth of 100 m, compared to a range of 4.2 × 10⁶ cells cm−3 to 1.5 × 10¹⁰ cells cm−3 with a median of 8.9 × 10⁹ cells cm−3 at 400 m (Table 2). The abundance of free-living bacteria in the bulk water was 3.4 × 10⁵ at 150 m and 1.0 × 10⁵ cells ml−1 at 400 m (Table 2).
TABLE 2.
Microbial numbers and relative abundances for aggregate-attached and free-living organismsa
| Organism(s) | 100 m |
400 m |
||||||||
|---|---|---|---|---|---|---|---|---|---|---|
| Attached |
Free-living (150 mb) |
EF (103) | Attached |
Free-living |
EF (103) | |||||
| No. (107 cells cm−3) | Abundance (% of total cells) | No. (103 cells ml−1) | Abundance (% of total cells) | No. (107 cells cm−3) | Abundance (% of total cells) | No. (103 cells ml−1) | Abundance (% of total cells) | |||
| Total bacteria | 38 | 340 | 1.1 | 890 | 100 | 89 | ||||
| Roseobacter | 3.7 | 9.7 ± 11.8 | 6.5 | 1.5 ± 0.4 | 5.9 | 71 | 7.6 ± 10.2 | 1.5 | 1 ± 0.3 | 474.7 |
| Bacteroidetes | 16 | 42.4 ± 28.2 | 16 | 3.7 ± 0.6 | 10 | 62 | 6.6 ± 3.3 | 4.1 | 2.8 ± 0.2 | 152 |
| Gammaproteobacteria | 5.2 | 13.7 ± 10.5 | 13 | 2.9 ± 0.1 | 4.1 | 98 | 10.6 ± 3.8 | 4.9 | 3.3 ± 0.4 | 199.8 |
| Alteromonas | 5.2 | 13.6 ± 12.2 | 7 | 1.6 ± 0.6 | 7.6 | 8.9 | 0.3 ± 0.3 | 3.2 | 2.2 ± 0.6 | 27.8 |
| Pseudoalteromonas | 1.4 | 3.8 ± 4.4 | 11 | 2.6 ± 2 | 1.3 | 43 | 4.8 ± 7.4 | 2.8 | 1.9 ± 0.9 | 152.6 |
| Planctomycetes | 0.95 | 2.5 ± 1.6 | 6 | 1.4 ± 0.7 | 1.6 | 8.9 | 0.6 ± 0.6 | 2.3 | 1.6 ± 0.4 | 38.7 |
| Synechococcus | 15 | 40.4 ± 12.2 | 9.7 | 2.3 ± 1.3 | 15.7 | 440 | 49.2 ± 36.8 | 7.4 | 5 ± 1.3 | 589.3 |
| SAR11 | 63 | 14.5 ± 6.5 | 25 | 16.6 ± 7.4 | ||||||
| Thaumarchaeota | 90 | 20.9 ± 4.7 | 32 | 21.4 ± 2.5 | ||||||
The microbial numbers are given as cells per cm3 aggregate (attached) or cells per ml seawater (free living). The relative abundance is calculated against the EUB probe and presented as an average of counts within three aggregates (attached) or three filter counts (free living). Values are averages and standard deviations. The enrichment factor (EF) is presented as the percent of microbes attached per cm3 aggregate relative to microbes found per ml seawater.
No samples for free-living microbial communities were collected at 100 m, and therefore the 150-m samples were used.
The cyanobacterial genus Synechococcus accounted for the majority of the microorganisms within the collected aggregates at both depths, with a relative abundance of 40.4% ± 12.2% at 100 m and 49.2% ± 36.8% at 400 m (Table 2; Fig. 3). Cells of Synechococcus were also present in the surrounding water column, but with a much lower relative abundance (2.3% ± 1.3% at 150 m and 5% ± 1.3% at 400 m) (Table 2). The relative abundance of Bacteroidetes within the aggregates was significantly higher at 100 m (42.4% ± 28.2%) than at 400 m (6.6% ± 3.3%), while the abundance of Bacteroidetes in the free-living community was only 3.7% ± 0.6% at 150 m and 2.8% ± 0.2% at 400 m (Table 2). The relative abundance of Gammaproteobacteria within the aggregates was 13.7% ± 10.5% at 150 m and 10.6% ± 3.8% at 400 m and these organisms comprised only ∼3% of the free-living community at both 150 m and 400 m (Table 2). Alteromonas accounted for the majority of Gammaproteobacteria within the aggregates collected at 100 m, while it contributed significantly less to the Gammaproteobacteria (P = 0.022; Student's t test) at 400 m (Table 2; Fig. 3). At both depths, the free-living Alteromonas strains had a relative abundance of ∼2%. Pseudoalteromonas organisms showed a stable relative abundance of ∼2 to 3% in the free-living fraction, while the value was ∼4 to 5% within aggregates at both depths (Table 2). Roseobacter organisms had a relative abundance of ∼1% at both depths for the free-living fraction, while within aggregates they comprised 9.7% ± 11.8% at 100 m and 7.6% ± 10.2% at 400 m (Table 2; Fig. 3). The relative abundance of Planctomycetes within the aggregates was 2.5% at 100 m but was significantly lower, <1%, at 400 m (Student's t test; P = 0.02) (Table 2; Fig. 3). The free-living Planctomycetes fraction had a stable relative abundance of ∼1.5% at both depths (Table 2). Thaumarchaeota, Euryarchaea marine group II, and the SAR324 clade were too scarce to account for significant fractions of the bacterial community within the aggregates but were observed in the free-living fraction (Table 2).
FIG 3.
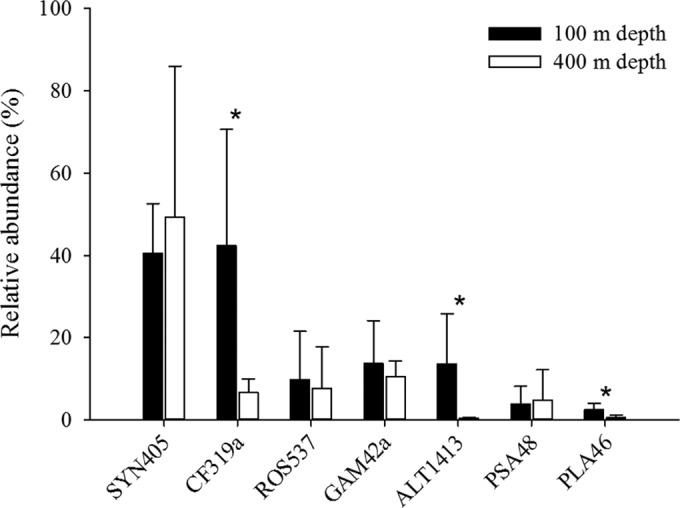
Comparison of relative abundances of the attached bacterial community found within marine snow aggregates collected at 100 m and 400 m. Abundances of Synechococcus (SYN405), Bacteroidetes (CF319a), Roseobacter (ROS537), Gammaproteobacteria (GAM42a), Alteromonas (ALT1413), Pseudoalteromonas (PSA184), and Planctomycetes (PLA46) cells are shown. The asterisks indicate the clades which were significantly different between 100 and 400 m.
Qualitative comparisons of the vertical distribution of attached and free-living bacteria.
To test for similarities between the attached and free-living bacterial communities at different depths, a cluster analysis on the relative abundances of free-living bacteria found at water depths of 20, 150, 400, 550, and 700 m and the relative abundances of attached bacteria from the 100- and 400-m depths was performed. Only the bacterial groups that were found within the aggregates were included when the relative abundances of the free-living bacteria were calculated (Table 3). Since Alteromonas and Pseudoalteromonas seemed to comprise the majority of the Gammaproteobacteria, the cluster analysis was done with Alteromonas and Pseudoalteromonas and without Gammaproteobacteria (Fig. 4). The distances for the dendrogram were calculated using Spearman's rank based on the relative abundances. The dendrogram clustered the attached microbial community from 100 m together with the free-living community observed at 20 m (Fig. 4).The microbial community attached to the aggregates collected at 400 m did not cluster directly together with the attached community from 100 m or with any of the free-living samples, except the free-living community from 700 m. When only bacterial groups present within the aggregates were considered, the free-living communities at 400 and 550 m were similar and to some extent were also similar to the community found at 150 m. The community observed for the free-living bacteria at 700 m did not cluster with bacteria at any of the other depths sampled (Fig. 4).
TABLE 3.
Relative abundances in percentages of attached and free-living microbesa
| Cell type | Depth (m) | Abundance (% of total cells) |
|||||
|---|---|---|---|---|---|---|---|
| Roseobacter | Bacteroidetes | Alteromonas | Pseudoalteromonas | Planctomycetes | Synechococcus | ||
| Attached | 100 | 8.6 | 37.7 | 12.1 | 3.4 | 2.2 | 35.9 |
| 400 | 11.0 | 9.6 | 0.4 | 7.0 | 0.9 | 71.2 | |
| Free-living | 20 | 15.7 | 66.2 | 4.4 | 4.0 | 3.3 | 6.5 |
| 150 | 11.6 | 28.4 | 12.5 | 19.7 | 10.6 | 17.3 | |
| 400 | 6.8 | 19.1 | 15.2 | 13.2 | 10.8 | 34.9 | |
| 550 | 9.5 | 18.5 | 17.2 | 13.4 | 13.2 | 28.2 | |
| 700 | 9.7 | 24.0 | 8.7 | 16.2 | 10.8 | 30.6 | |
Only microbial groups observed within the aggregates were used to calculate the relative abundances by dividing the microbial abundance for each group by the total number of microbes in all groups. The relative abundances were used to compare the attached microbial community structure with the free-living bacteria at different depths using a dendrogram (Fig. 4).
FIG 4.
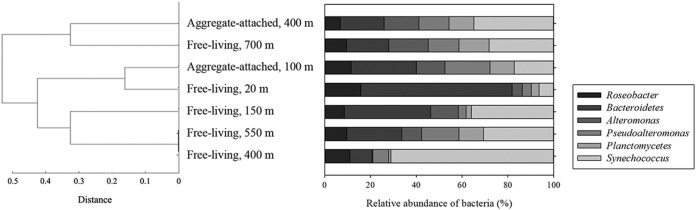
(Left) Dendrogram showing hierarchical cluster analysis using the relative abundances of only the microbial groups observed within marine snow. The dendrogram shows the distance between the attached microbial community at 100 and 400 m and the free-living community at 20, 150, 400, 550, and 700 m. Spearman's rank was used to calculate the distances. (Right) Relative abundances, in percentage of attached and free-living microbes, are shown for the groups observed within the aggregates (Table 3).
DISCUSSION
The use of drifting sediment traps equipped with gel allows settling aggregates to be washed and fixed in formaldehyde in situ while also preserving their three-dimensional shape, structure, and size. The gel trap enables studies on truly aggregate-attached microbial communities from depths where macroaggregates are scarce and easily missed when small water volumes are sampled. This experimental approach therefore offers a major advantage for studies of microbial communities within settling aggregates compared to the use of size-fractionated filtrations. These result in the destruction of aggregates and can lead to uncertainty as to the origin of microorganisms collected in the different size fractions.
The results gained from the gel trap method agree well with previous determinations of total bacterial abundance per volume aggregate (for example, see references 29, 30, and 31) and showed that bacteria were highly enriched within aggregates in comparison to a similar volume of surrounding water. This resulted in enrichment factors of >1,000-fold, as observed previously (31, 32). Despite the large enrichment factors, the relative proportion of attached to free-living bacteria was only 0.3% at 100 m and 2.4% at 400 m. This seems typical for such depths in oceanic environments (26, 33, 34) and is a result of the relative scarcity of marine snow at greater depths (35–37) (for example, during the present study, in situ particle camera deployments showed total aggregate volumes of 3.7 and 0.4 cm3 per m3 water at 100 and 400 m, respectively). The ability of free-drifting traps to collect and preserve settling aggregates is therefore an advantage when studying particle-associated microbes at depths where macroaggregates are at low concentrations and have very patchy distributions.
By collecting particles from different depths, insight into the origin of the particle-associated microbial communities could be gained. Cluster analysis showed similarities between the free-living microbial community sampled at 20 m and that attached to aggregates collected at 100 m (Fig. 4). This suggests that the microbial community within the aggregates collected at 100 m was, to a large extent, determined by bacterial colonization of particles in the photic zone, e.g., 20 m. Hence, the bacterial communities within settling aggregates were “inherited” from the chlorophyll maximum (16, 38). Interestingly, the aggregate-attached community collected at 400 m was different from the free-living communities at any depth down to 700 m and from that attached at 100 m (Fig. 4). This suggests that little de novo colonization occurred at greater depths and that the majority of aggregate colonization most likely took place in the surface ocean (i.e., 20 m), where a high abundance of microbes and suspended and slowly sinking particles persisted. It was surprising that the attached community at 400 m was similar to the free-living community at 700 m. Considering that the station sampled for free-living communities was only 780 m deep and was on the continental slope, it is possible that the surface sediment, which must be assumed to be formed by settling aggregates, was resuspended and caused the high similarity to the attached community at 400 m.
Further evidence supporting the idea that the particle-associated microbial community is recruited at the surface is provided by the high relative abundance of Synechococcus in the aggregates. The photoautotrophic Synechococcus organisms made up the majority of the attached microbes at both 100 m and 400 m, even though it is not beneficial for this organism to live at these dark depths. The high numbers of Synechococcus within the aggregates could be explained by active chemotaxis toward the aggregates while they were forming in the euphotic zone (39). Such chemotactic behavior may be triggered by nitrogenous compounds (40), which are often highly enriched within aggregates compared to the surrounding water (41).The high enrichment of attached Synechococcus at 400 m suggests that the cells were trapped within the large, rapidly sinking aggregates and thus transported to the deeper, darker region of the ocean.
Synechococcus made up the majority of the attached microbial communities at 100 and 400 m; however, there were substantial shifts in other parts of the attached microbial communities. It is of course possible that the aggregates collected at 400 m had not settled vertically from 100 m but been transported via lateral advection. Still, the facts that the aggregates at both depths were dominated by diatoms and that Synechococcus accounted for the majority of the bacteria within them support a common origin. Therefore, the differences observed in the attached microbial community at 400 m compared to the attached community at 100 m can be considered due to ecological successions over time, assuming that the deeper aggregates were older than those from shallower depths. The investigated aggregates from the two depths were of similar sizes and types, and it is therefore likely that their sinking velocities were similar, too (42). Typically, 0.7-mm aggregates sink with velocities between 50 and 100 m day−1 off Cape Blanc (36); hence, the aggregates collected at 400 m would have been 3 to 6 days older than those collected at 100 m. Ecological successions of the particle-associated community might be determined by an initial outcome of attachment and detachment (43) followed by growth of some bacterial groups within the aggregates and also by colonization of the aggregates by microbes during their descent. Additionally, grazing pressure on the attached microbes will also shape the microbial community structure within the aggregates.
Interestingly, there was a tendency toward higher abundance in both the total bacterial numbers and all the individual bacterial groups within the aggregates collected at 400 m compared to those collected at 100 m. Though not significantly different, this trend might suggest a high bacterial growth rate and/or high colonization rate on the aggregates while they settled from 100 to 400 m. To test if colonization was the dominant mechanism leading to increased abundance, the total water volume “filtered” by an aggregate as it settles from a depth of 100 m to 400 m can be estimated. The average aggregate diameter at 100 m was 0.7 mm, which means that an aggregate will sweep an area of 3.9 × 10⁻³ cm2 clear of particles while it sinks. Thus, a settling distance of 300 m in a vertical direction will result in 115.5 ml of water being “filtered.” The abundances of free-living bacteria found at 400 m for the aggregate-attached dominant groups Roseobacter, Gammaproteobacteria, and Synechococcus (Table 2; Fig. 3) suggest that the aggregate potentially encountered 1.7 × 10⁵, 5.7 × 10⁵, and 8.5 × 10⁵ bacterial cells during its descent, respectively. This suggests that if colonization was the only mechanism responsible for increased aggregate-associated microbial cell numbers at 400 m compared to 100 m, every Synechococcus and Roseobacter cell encountered during the descent would need to attach and remain within the aggregates, while one in three Gammaproteobacteria cells encountered would need to attach and remain attached to the aggregates. Previous studies of mechanisms of attachment/detachment by marine snow-associated bacteria have shown that the bacteria have a residence time on the aggregates of only approximately 3 h (43). Therefore, colonization alone cannot explain the attached bacterial abundance at 400 m being higher than that observed at 100 m.
Generally, the structure of pelagic microbial communities are controlled by growth and top down control mechanisms, such as grazing (44) and viral lysis (45). Of course, for attached microbial communities, attachment and detachment play an additional role (46). Since colonization seems to have had little influence on the regulation of the microbial community structure in this study and since viral lysis usually leads to a decrease of one species (45) and not several clades (Fig. 3), growth and/or grazing might have been the major regulating mechanisms. Assuming aggregate settling velocities between 50 and 100 m day−1, it would take between 3 and 6 days to settle vertically from 100 to 400 m. When these values are compared to typical bacterial generation times between 0.4 and 2 day−1 for attached bacteria (e.g., see references 13 and 47), it seems realistic that growth could have sustained the relatively high bacterial abundance observed within the aggregates collected at 400 m. This suggests that the grazing impact on the microbial community must have been rather low.
In this study, the main process determining the attached microbial community structure was the colonization in the upper photic part of the water column during aggregate formation (16). This “initial” community structure was then altered during the 4 to 8 days it took the aggregates to sink from the surface ocean to 400 m. These alterations seemed to occur primarily through growth rather than continuous colonization. This contradicts the general belief that colonization is the main mechanism determining the attached microbial community at greater depths (43, 48). It is, however, possible that other regulating factors, such as quorum sensing (49), viral infection (50), hydrostatic pressure changes (51–53), and temperature changes (54), had important influences on the outcome of the internal competition between the microbial groups attached to the aggregates, and it will be interesting to use the present method to address those questions.
The data set presented here encourages us to further develop the method of in situ fixation, washing, and collection of individual intact marine particles using drifting sediment traps deployed at various depths. This study focused on CARD-FISH analysis within individual aggregates from just two depths, but the method enables collection and preservation of aggregates from any depth and offers a way to truly separate microorganisms attached to sinking aggregates from the free-living communities. This allows much more detailed studies of the aggregate-attached communities in relation to size, type, and age of the aggregates and will thus provide a better understanding of turnover rates through the water column, which will help toward better understanding and predictions of oceanic biogeochemistry.
ACKNOWLEDGMENTS
We acknowledge the captain and crew of RV Maria S. Merian and thank Gerhard Fischer, Götz Ruhland, Marko Klann, Andreas Basse, and Nicolas Nowald for their help during sampling. Two anonymous reviewers are thanked for all their stimulating comments on an earlier version of the manuscript.
This study was supported by the Max Planck Society, the DFG Research Center/Cluster of Excellence “The Ocean in the Earth System,” and the HGF Young Investigators Group SEAPUMP “Seasonal and regional food web interactions with the biological pump,” VH-NG-1000.
REFERENCES
- 1.Volk T, Hoffert MI. 1985. Ocean carbon pumps: analysis of relative strengths and efficiencies in ocean-driven atmospheric CO2 changes, p 99-110. In Sundquist ET, Broecker WS (ed), The carbon cycle and atmospheric CO2: natural variations archean to present, vol 32 AGU, Washington, DC. [Google Scholar]
- 2.Siegenthaler U, Sarmiento JL. 1993. Atmospheric carbon dioxide and the ocean. Nature 365:119–125. doi: 10.1038/365119a0. [DOI] [Google Scholar]
- 3.Urban-Rich J. 1999. Release of dissolved organic carbon from copepod fecal pellets in the Greenland Sea. J Exp Mar Biol Ecol 232:107–124. doi: 10.1016/S0022-0981(98)00104-X. [DOI] [Google Scholar]
- 4.Simon M, Grossart HP, Schweitzer B, Ploug H. 2002. Microbial ecology of organic aggregates in aquatic ecosystems. Aquat Microb Ecol 28:175–211. doi: 10.3354/ame028175. [DOI] [Google Scholar]
- 5.DeLong EF, Franks DG, Alldredge A. 1993. Phylogenetic diversity of aggregate-attached vs. free-living marine bacteria assemblages. Limnol Oceanogr 38:924–934. doi: 10.4319/lo.1993.38.5.0924. [DOI] [Google Scholar]
- 6.Moeseneder MM, Winter C, Herndl GJ. 2001. Horizontal and vertical complexity of attached and free-living bacteria of the eastern Mediterranean Sea, determined by 16S rDNA and 16S rRNA fingerprints. Limnol Oceanogr 46:95–107. doi: 10.4319/lo.2001.46.1.0095. [DOI] [Google Scholar]
- 7.Acinas SG, Anton J, Rodriguez-Valera F. 1999. Diversity of free-living and attached bacteria in offshore western Mediterranean water as depicted by analysis of genes encoding 16S rRNA. Appl Environ Microbiol 65:514–522. [DOI] [PMC free article] [PubMed] [Google Scholar]
- 8.Acinas SG, Rodriguez-Valera F, Pedrós-Alió C. 1997. Spatial and temporal variation in marine bacterioplankton diversity as shown by RFLP fingerprinting of PCR amplified 16S rDNA. FEMS Microbiol Ecol 24:27–40. doi: 10.1111/j.1574-6941.1997.tb00420.x. [DOI] [Google Scholar]
- 9.Hollibaugh T, Wong PS, Murrell MC. 2000. Similarity of particle-associated and free-living bacterial communities in northern San Francisco Bay, California. Aquat Microb Ecol 21:102–114. [Google Scholar]
- 10.Ghiglione J-F, Mevel G, Pujo-Pay M, Mousseau L, Lebaron P, Goutx M. 2007. Diel and seasonal variations in abundance, activity, and community structure of particle-attached and free-living bacteria in NW Mediterranean Sea. Microb Ecol 54:217–231. doi: 10.1007/s00248-006-9189-7. [DOI] [PubMed] [Google Scholar]
- 11.Bižić-Ionescu M, Zeder M, Ionescu D, Orlić S, Fuchs BM, Grossart H-P, Amann R. 24 April 2014. Comparison of bacterial communities on limnic versus coastal marine particles reveals profound differences in colonization. Environ Microbiol doi: 10.1111/1462-2920.12466. [DOI] [PubMed] [Google Scholar]
- 12.Shanks AL, Edmondson EW. 1989. Laboratory-made artificial marine snow: a biological model of the real thing. Mar Biol 101:463–470. doi: 10.1007/BF00541648. [DOI] [Google Scholar]
- 13.Ploug H, Grossart HP. 2000. Bacterial growth and grazing on diatom aggregates: respiratory carbon turnover as a function of aggregate size and sinking velocity. Limnol Oceanogr 45:1467–1475. doi: 10.4319/lo.2000.45.7.1467. [DOI] [Google Scholar]
- 14.Grossart HP, Kiørboe T, Tang KW, Allgaier M, Yam EM, Ploug H. 2006. Interactions between marine snow and heterotrophic bacteria: aggregate formation and microbial dynamics. Aquat Microb Ecol 42:19–26. doi: 10.3354/ame042019. [DOI] [Google Scholar]
- 15.Eloe EA, Shulse CN, Fadrosh DW, Williamson SJ, Allen EE, Bartlett DH. 2011. Compositional differences in particle-associated and free-living microbial assemblages from an extreme deep-ocean environment. Environ Microbiol Rep 3:449–458. doi: 10.1111/j.1758-2229.2010.00223.x. [DOI] [PubMed] [Google Scholar]
- 16.Tamelander T, Reigstad M, Olli K, Slagstad D, Wassmann P. 2013. New production regulates export stoichiometry in the ocean. PLoS One 8:e54027. doi: 10.1371/journal.pone.0054027. [DOI] [PMC free article] [PubMed] [Google Scholar]
- 17.Reference deleted.
- 18.Reference deleted.
- 19.Cardinale M, Vieira de Castro J Jr, Müller H, Berg G, Grube M. 2008. In situ analysis of the bacterial community associated with the reindeer lichen Cladonia arbuscula reveals predominance of Alphaproteobacteria. FEMS Microbiol Ecol 66:63–71. doi: 10.1111/j.1574-6941.2008.00546.x. [DOI] [PubMed] [Google Scholar]
- 20.Stokes GG. 1851. On the effect of the internal friction of fluids on the motion of pendulums. Camb Phil Soc Trans 9:8–106. [Google Scholar]
- 21.Thiele S, Fuchs BM, Amann R. 2011. Identification of microorganisms using the ribosomal RNA approach and fluorescence in situ hybridization, p 171–189. In Wilderer P. (ed), Treatise on water science, vol 3 Academic Press, Oxford, United Kingdom. [Google Scholar]
- 22.Zeder M, Ellrott A, Amann R. 2011. Automated sample area definition for high-throughput microscopy. Cytometry 79A:306–310. doi: 10.1002/cyto.a.21034. [DOI] [PubMed] [Google Scholar]
- 23.Zeder M, Kohler E, Pernthaler J. 2011. A novel algorithm for the determination of bacterial cell volumes that is unbiased by cell morphology. Microsc Microanal 17:799–809. doi: 10.1017/S1431927611012104. [DOI] [PubMed] [Google Scholar]
- 24.Zeder M, Pernthaler J. 2009. Multispot live-image autofocusing for high-throughput microscopy of fluorescently stained bacteria. Cytometry 75A:781–788. doi: 10.1002/cyto.a.20770. [DOI] [PubMed] [Google Scholar]
- 25.Mueller LN, de Brouwer JF, Almeida JS, Stal LJ, Xavier JB. 2006. Analysis of a marine phototrophic biofilm by confocal laser scanning microscopy using the new image quantification software PHLIP. BMC Ecology 6:1. doi: 10.1186/1472-6785-6-1. [DOI] [PMC free article] [PubMed] [Google Scholar]
- 26.Alldredge A, Gotschalk C. 1988. In situ settling behavior of marine snow. Limnol Oceanogr 33:339–351. doi: 10.4319/lo.1988.33.3.0339. [DOI] [Google Scholar]
- 27.Ploug H, Iversen MH, Fischer G. 2008. Ballast, sinking velocity, and apparent diffusivity within marine snow and zooplankton fecal pellets: implications for substrate turnover by attached bacteria. Limnol Oceanogr 53:1878–1886. doi: 10.4319/lo.2008.53.5.1878. [DOI] [Google Scholar]
- 28.Ploug H, Passow U. 2007. Direct measurement of diffusivity within diatom aggregates containing transparent exopolymer particles. Limnol Oceanogr 52:1–6. doi: 10.4319/lo.2007.52.1.0001. [DOI] [Google Scholar]
- 29.Alldredge A, Cole JJ, Caron DA. 1986. Production of heterotrophic bacteria inhabiting macroscopic organic aggregates (marine snow) from surface waters. Limnol Oceanogr 31:68–78. doi: 10.4319/lo.1986.31.1.0068. [DOI] [Google Scholar]
- 30.Herndl GJ. 1988. Ecology of amorphous aggregations (marine snow) in the Northern Adriatic Sea. II. Microbial density and activity in marine snow and its implication to overall pelagic processes. Mar Ecol Prog Ser 48:265–275. [Google Scholar]
- 31.Turley CM, Mackie PJ. 1994. Biogeochemical significance of attached and free-living bacteria and the flux of particles in the NE Atlantic Ocean. Mar Ecol Prog Ser 115:191–203. doi: 10.3354/meps115191. [DOI] [Google Scholar]
- 32.Ploug H, Grossart HP, Azam F, Jørgensen BB. 1999. Photosynthesis, respiration, and carbon turnover in sinking marine snow from surface waters of Southern California Bight: implications for the carbon cycle in the ocean. Mar Ecol Prog Ser 179:1–11. doi: 10.3354/meps179001. [DOI] [Google Scholar]
- 33.Grossart HP, Simon M. 1998. Bacterial colonization and microbial decomposition of limnetic organic aggregates (lake snow). Aquat Microb Ecol 15:127–140. doi: 10.3354/ame015127. [DOI] [Google Scholar]
- 34.Turley CM, Stutt ED. 2000. Depth-related cell-specific bacterial leucine incorporation rates on particles and its biogeochemical significance in the Northwest Mediterranean. Limnol Oceanogr 45:419–425. doi: 10.4319/lo.2000.45.2.0419. [DOI] [Google Scholar]
- 35.Nowald N, Karakas G, Ratmeyer V, Fischer G, Schlitzer R, Davenport R, Wefer G. 2006. Distribution and transport processes of marine particulate matter off Cape Blanc (NW-Africa): results from vertical camera profiles. Ocean Sci Discuss 3:903–938. doi: 10.5194/osd-3-903-2006. [DOI] [Google Scholar]
- 36.Iversen MH, Nowald N, Ploug H, Jackson GA, Fischer G. 2010. High resolution profiles of vertical particulate organic matter export off Cape Blanc, Mauritania: degradation processes and ballasting effects. Deep Sea Res I 57:771–784. doi: 10.1016/j.dsr.2010.03.007. [DOI] [Google Scholar]
- 37.Stemmann L, Jackson GA, Gorsky G. 2004. A vertical model of particle size distributions and fluxes in the midwater column that includes biological and physical processes—part II: application to a three year survey in the NW Mediterranean Sea. Deep Sea Res I 51:885–908. doi: 10.1016/j.dsr.2004.03.002. [DOI] [Google Scholar]
- 38.Tamelander T. 2013. Community composition and extracellular enzyme activity of bacteria associated with suspended and sinking particles in contrasting arctic and sub-arctic marine environments. Aquat Microb Ecol 69:211–221. doi: 10.3354/ame01641. [DOI] [Google Scholar]
- 39.Cottrell MT, Kirchman DL. 2009. Photoheterotrophic microbes in the Arctic Ocean in summer and winter. Appl Environ Microbiol 75:4958–4966. doi: 10.1128/AEM.00117-09. [DOI] [PMC free article] [PubMed] [Google Scholar]
- 40.Willey JM, Waterbury JB. 1989. Chemotaxis toward nitrogenous compounds by swimming strains of marine Synechococcus spp. Appl Environ Microbiol 55:1888–1894. [DOI] [PMC free article] [PubMed] [Google Scholar]
- 41.Shanks AL, Trent JD. 1979. Marine snow: microscale nutrient patched. Limnol Oceanogr 24:850–854. doi: 10.4319/lo.1979.24.5.0850. [DOI] [Google Scholar]
- 42.Iversen MH, Ploug H. 2010. Ballast minerals and the sinking carbon flux in the ocean: carbon-specific respiration rates and sinking velocities of marine snow aggregates. Biogeosciences 7:2613–2624. doi: 10.5194/bg-7-2613-2010. [DOI] [Google Scholar]
- 43.Kiørboe T, Grossart HP, Ploug H, Tang K. 2002. Mechanisms and rates of bacterial colonization of sinking aggregates. Appl Environ Microbiol 68:3996–4006. doi: 10.1128/AEM.68.8.3996-4006.2002. [DOI] [PMC free article] [PubMed] [Google Scholar]
- 44.Fenchel T. 1986. The ecology of heterotrophic microflagellates. Adv Microb Ecol 9:57–97. doi: 10.1007/978-1-4757-0611-6_2. [DOI] [Google Scholar]
- 45.Suttle CA. 2007. Marine viruses—major players in the global ecosystem. Nat Rev Microbiol 5:801–812. doi: 10.1038/nrmicro1750. [DOI] [PubMed] [Google Scholar]
- 46.Kiørboe T, Tang K, Grossart H, Ploug H. 2003. Dynamics of microbial communities on marine snow aggregates: colonization, growth, detachment, and grazing mortality of attached bacteria. Appl Environ Microbiol 69:3036–3047. doi: 10.1128/AEM.69.6.3036-3047.2003. [DOI] [PMC free article] [PubMed] [Google Scholar]
- 47.Tang KW, Grossart H-P, Yam EM, Jackson GA, Ducklow HW, Kiørboe T. 2006. Mesocosm study of particle dynamics and control of particle-associated bacteria by flagellate grazing. Mar Ecol Prog Ser 325:15–27. doi: 10.3354/meps325015. [DOI] [Google Scholar]
- 48.Kiørboe T. 2001. Formation and fate of marine snow: small-scale processes with large-scale implications. Sci Mar 65(Suppl 2):57–71. [Google Scholar]
- 49.Gram L, Grossart HP, Schlingloff A, Kiørboe T. 2002. Possible quorum sensing in marine snow bacteria: production of acylated homoserine lactones by Roseobacter strains isolated from marine snow. Appl Environ Microbiol 68:4111–4116. doi: 10.1128/AEM.68.8.4111-4116.2002. [DOI] [PMC free article] [PubMed] [Google Scholar]
- 50.Proctor LM, Fuhrman JA. 1991. Roles of virus infection in organic particle flux. Mar Ecol Prog Ser 69:133–142. doi: 10.3354/meps069133. [DOI] [Google Scholar]
- 51.Tamburini C, Garcin J, Bianchi A. 2003. Role of deep-sea bacteria in organic matter mineralization and adaptation to hydrostatic pressure conditions in the NW Mediterranean Sea. Aquat Microb Ecol 32:209–218. doi: 10.3354/ame032209. [DOI] [Google Scholar]
- 52.Tamburini C, Goutx M, Guigue C, Garel M, Lefevre D, Charrière B, Sempere R, Pepa S, Peterson M, Wakeham SG, Lee C. 2009. Effects of hydrostatic pressure on microbial alteration of sinking fecal pellets. Deep Sea Res II 56:1533–1546. doi: 10.1016/j.dsr2.2008.12.035. [DOI] [Google Scholar]
- 53.Grossart H, Gust G. 2009. Hydrostatic pressure affects physiology and community structure of marine bacteria during settling to 4000 m: an experimental approach. Mar Ecol Prog Ser 390:97–104. doi: 10.3354/meps08201. [DOI] [Google Scholar]
- 54.Iversen MH, Ploug H. 2013. Temperature effects on carbon-specific respiration rate and sinking velocity of diatom aggregates—potential implications for deep ocean export processes. Biogeosciences 10:4073–4085. doi: 10.5194/bg-10-4073-2013. [DOI] [Google Scholar]
- 55.Amann R, Krumholz L, Stahl D. 1990. Fluorescent-oligonucleotide probing of whole cells for determinative, phylogenetic, and environmental studies in microbiology. J Bacteriol 172:762–770. [DOI] [PMC free article] [PubMed] [Google Scholar]
- 56.Daims H, Brühl A, Amann R, Schleifer K-H, Wagner M. 1999. The domain-specific probe EUB338 is insufficient for the detection of all bacteria: development and evaluation of a more comprehensive probe set. Syst Appl Microbiol 22:434–444. doi: 10.1016/S0723-2020(99)80053-8. [DOI] [PubMed] [Google Scholar]
- 57.Wallner G, Amann R, Beisker W. 1993. Optimizing fluorescent in situ hybridization with rRNA-targeted oligonucleotide probes for flow cytometric identification of microorganisms. Cytometry 14:136–143. doi: 10.1002/cyto.990140205. [DOI] [PubMed] [Google Scholar]
- 58.Stahl DA, Amann R. 1991. Development and application of nucleic acid probes, p 205–248. In Stackebrandt E, Goodfellow M (ed), Nucleic acid techniques in bacterial systematics. John Wiley & Sons Ltd, Chichester, United Kingdom. [Google Scholar]
- 59.Massana R, Murray AE, Preston CM, DeLong EF. 1997. Vertical distribution and phylogenetic characterization of marine planktonic archaea in the Santa Barbara Channel. Appl Environ Microbiol 63:50–56. [DOI] [PMC free article] [PubMed] [Google Scholar]
- 60.Teira E, Reinthaler T, Pernthaler A, Pernthaler J, Herndl GJ. 2004. Combining catalyzed reporter deposition-fluorescence in situ hybridization and microautoradiography to detect substrate utilization by bacteria and archaea in the deep ocean. Appl Environ Microbiol 70:4411–4414. doi: 10.1128/AEM.70.7.4411-4414.2004. [DOI] [PMC free article] [PubMed] [Google Scholar]
- 61.Rappe MS, Connon SA, Vergin KL, Giovannoni SJ. 2002. Cultivation of the ubiquitous SAR11 marine bacterioplankton clade. Nature 418:630–633. doi: 10.1038/nature00917. [DOI] [PubMed] [Google Scholar]
- 62.Eilers H, Pernthaler J, Peplies J, Glöckner FO, Gerdts G, Amann R. 2001. Isolation of novel pelagic bacteria from the German Bight and their seasonal contributions to surface picoplankton. Appl Environ Microbiol 67:5134–5142. doi: 10.1128/AEM.67.11.5134-5142.2001. [DOI] [PMC free article] [PubMed] [Google Scholar]
- 63.Manz W, Amann R, Ludwig W, Wagner M, Schleifer KH. 1992. Phylogenetic oligodeoxynucleotide probes for the major subclasses of Proteobacteria: problems and solutions. Syst Appl Microbiol 15:593–600. doi: 10.1016/S0723-2020(11)80121-9. [DOI] [Google Scholar]
- 64.Eilers H, Pernthaler K, Glöckner FO, Amann R. 2000. Culturability and in situ abundance of pelagic bacteria from the North Sea. Appl Environ Microbiol 66:3044–3051. doi: 10.1128/AEM.66.7.3044-3051.2000. [DOI] [PMC free article] [PubMed] [Google Scholar]
- 65.Schattenhofer M, Fuchs BM, Amann R, Zubkov MV, Tarran GA, Pernthaler J. 2009. Latitudinal distribution of prokaryotic picoplankton populations in the Atlantic Ocean. Environ Microbiol 11:2078–2093. doi: 10.1111/j.1462-2920.2009.01929.x. [DOI] [PubMed] [Google Scholar]
- 66.Manz W, Amann R, Ludwig W, Vancanneyt M, Schleifer KH. 1996. Application of a suite of 16S rRNA-specific oligonucleotide probes designed to investigate bacteria of the phylum cytophaga-flavobacter-bacteroides in the natural environment. Microbiology 142:1097–1106. doi: 10.1099/13500872-142-5-1097. [DOI] [PubMed] [Google Scholar]
- 67.Neef A, Amann R, Schlesner H, Schleifer KH. 1998. Monitoring a widespread bacterial group: in situ detection of planctomycetes with 16S rRNA-targeted probes. Microbiology 144:3257–3266. doi: 10.1099/00221287-144-12-3257. [DOI] [PubMed] [Google Scholar]
- 68.West NJ, Schönhuber WA, Fuller NJ, Amann R, Rippka R, Post AF, Scanlan DJ. 2001. Closely related Prochlorococcus genotypes show remarkably different depth distributions in two oceanic regions as revealed by in situ hybridization using 16S rRNA-targeted oligonucleotides. Microbiology 147:1731–1744. [DOI] [PubMed] [Google Scholar]