

Abstract
Abnormal architecture of the tumor blood network, as well as heterogeneous erythrocyte flow, leads to temporal fluctuations in tissue oxygen tension exposing tumor and stromal cells to cycling hypoxia. Inflammation is another feature of tumor microenvironment and is considered as a new enabling characteristic of tumor progression. As cycling hypoxia is known to participate in tumor aggressiveness, the purpose of this study was to evaluate its role in tumor-promoting inflammation. Firstly, we assessed the impact of cycling hypoxia in vitro on endothelial inflammatory response induced by tumor necrosis factor α. Results showed that endothelial cells exposed to cycling hypoxia displayed an amplified proinflammatory phenotype, characterized by an increased expression of inflammatory cytokines, namely, interleukin (IL)-6 and IL-8; by an increased expression of adhesion molecules, in particular intercellular adhesion molecule–1 (ICAM-1); and consequently by an increase in THP-1 monocyte adhesion. This exacerbation of endothelial inflammatory phenotype occurs through nuclear factor–κB overactivation. Secondly, the role of cycling hypoxia was studied on overall tumor inflammation in vivo in tumor-bearing mice. Results showed that cycling hypoxia led to an enhanced inflammation in tumors as prostaglandin-endoperoxide synthase 2 (PTGS2), IL-6, CXCL1 (C-X-C motif ligand 1), and macrophage inflammatory protein 2 (murine IL-8 functional homologs) mRNA expression was increased and as a higher leukocyte infiltration was evidenced. Furthermore, cycling hypoxia–specific inflammatory phenotype, characterized by a simultaneous (baculoviral inhibitor of apoptosis repeat-containing 5)low/PTGS2high/ICAM-1high/IL-6high/IL-8high expression, is associated with a poor prognosis in human colon cancer. This new phenotype could thus be used in clinic to more precisely define prognosis for colon cancer patients. In conclusion, our findings evidenced for the first time the involvement of cycling hypoxia in tumor-promoting inflammation amplification.
Introduction
During tumor uncontrolled development, some tumor cells become too distant from blood vessels and receive an insufficient oxygen supply. These cells are thus in condition of hypoxia, defined as a reduced level of oxygen. This type of hypoxia, called chronic hypoxia, results from the limited diffusion of oxygen from blood capillaries through the tumor [1]. During the avascular phase, tumor cells proliferate, but the proliferation is counterbalanced by cell death, maintaining tumor mass in a dormancy state. To grow, tumor undergoes an angiogenic switch ensuing from adaptation to hypoxia via hypoxia-inducible factor-1 (HIF-1) and/or from genetic instability [2], [3]. Thanks to the angiogenic switch, tumor develops its own blood network. However, this network is structurally abnormal and dysfunctional [4], [5]. Tumor vessels are tortuous and leaky, with an inconstant diameter, arteriovenous shunts, excessive branching, and blind ends, and they lack a conventional hierarchy [4]. Blood flow is highly irregular and sluggish and could be temporally obstructed by circulating blood cells or be restricted because of mechanical compression of microvessels by proliferating tumor cells [5], [6]. The resulting irregular flow leads to cycling hypoxia, also termed acute or intermittent [7]. Cycling hypoxia is characterized by a pattern of periodicity between hypoxia and reoxygenation periods. Dewhirst identified two overlapping time scales for temporal fluctuations in tumor pO2, which are fluctuations over days occurring from angiogenesis and vasculature remodeling and fluctuations over hours (one to three cycles per hour) resulting from fluctuations in erythrocyte flow because of the chaotic architecture of tumor blood network [6]. Interestingly, cycling hypoxia may affect more cell types than chronic hypoxia, in particular endothelial cells, one of the numerous cell types presents in the “tumor ecosystem.” Even if cancer has long been defined as a disease involving transformed cells, it is now clear that it must be considered as a disease implicating multiple heterotypic interactions between malignant cells and stromal cells [3], [8]. The proliferation of tumor cells alone cannot lead to cancer, but a suitable microenvironment for this proliferation promotes tumor growth and metastasis. Furthermore, the notion of inherent inflammation in tumor microenvironment has emerged [9]. Studies on the immune system have highlighted innate and adaptive immune responses supporting tumor growth instead of its rejection. Indeed, immune system components may be hijacked by tumor cells to favor tumor growth and metastasis. Mantovani firstly suggested that cancer-related inflammation could emerge as the seventh hallmark of cancer, joining the six hallmarks previously defined in 2000 [3], [10]. Hanahan and Weinberg, in their new description of hallmarks of cancer, integrated tumor-promoting inflammation as a new enabling characteristic, contributing to the acquisition of multiple hallmark capabilities by supplying bioactive molecules to the tumor microenvironment including growth or survival factors, proangiogenic factors, and matrix-modifying enzymes [11], [12]. Tumor necrosis factor (TNF) α has been considered as a major early mediator of cancer-related inflammation [12].
Here, the role of cycling hypoxia in tumor-related inflammation was explored in vitro in endothelial cells and in vivo in tumor-bearing mice. Then, cycling hypoxia–amplified inflammation was evaluated for its use as a prognosis marker of poor outcome in human colon cancer.
Material and Methods
Cell Culture and Hypoxia Incubation
Certified EAhy926 endothelial cells (ATCC) were grown in DHG-L1 medium (DMEM high glucose, low NaHCO3, without sodium pyruvate) (Gibco) containing 10% fetal bovine serum (FBS). Human umbilical vein endothelial cells (HUVEC) (pooled cells, Lonza) were maintained in EGM (Lonza) until passage 4.
For hypoxia experiments, cells were incubated as described in [13], with or without TNFα (R&D Systems) at 0.1 or 1 ng/ml. Normoxic cells (N) were incubated in the same conditions but in normal atmosphere. For chronic hypoxia (chH), cells were exposed to a continued period of 6 hours under 1% O2. For cycling hypoxia (cyH), cells were exposed to four consecutive cycles of 1-hour hypoxia (1% O2) followed by 30-minute reoxygenation (air).
Mouse Model
C57BL6 mice (Elevage Janvier, Le Genest-St-Isle) received an i.m. injection of 106 Lewis lung carcinoma (LLc) tumor cells (ATCC) in the posterior left leg. When the tumor diameter reached 10 ± 0.5 mm, mice were randomly assigned to a treatment group (three mice per group). Tumor-bearing mice were exposed either to normal air (control) or to cyH, or were injected i.p. with LPS (#L6386, Sigma) (1 mg/kg) for 44h30 hours (LPS group). Procedure of cyH was performed as in [14]. The local authorities approved each procedure according to animal care regulations.
Human Samples
Healthy and tumor tissues from seven patients suffering from colon cancer (Biobank, CHU Dinant Godinne, UCL) were used for RNA extraction to compare relative mRNA abundance by reverse transcription quantitative polymerase chain reaction (RT-qPCR). The study was approved by the local ethics committee (no. 73/2012).
RT-qPCR
Total RNA was extracted from cells using the QIAcube system with RNeasy Mini kit (QIAGEN). For murine and human tissues, RNA extraction was performed using TRIZOL reagent (Invitrogen). RT-qPCR was performed as in [13]. RPL13A was used as the housekeeping gene.
Immunofluorescence Staining
EAhy926 cells were seeded at 100,000 cells/well (24-well plate) on glass coverslips. After incubation, immunofluorescence staining was performed as described in [15] using anti–intercellular adhesion molecule-1 (ICAM-1) antibody (#BBA3, R&D Systems) (1:100) and Alexa Fluor 488–conjugated goat anti-mouse IgG antibody (Molecular Probes) (1:1000). Observations were performed with a constant photomultiplier gain value and a constant laser power using a confocal microscope SP5 (Leica). Tumors were cryosliced, probed with a monoclonal antibody against CD11b (#550282, BD Pharmingen) (1:50), and revealed with Alexa Fluor 488 anti-rat IgG (1:300) [14]. Observations were performed using a Zeiss Axioskop microscope equipped for fluorescence.
ELISA
Secreted interleukin (IL)-6 and IL-8 concentrations were assayed using specific ELISA kits (Quantikine, R&D Systems) according to supplier’s recommendations. For EAhy926 cells, concentrations were normalized by total protein (μg proteins/ml) determined by the Folin method.
Western Blot Analysis
Total protein extraction for ICAM-1 was performed using 10 mM Tris pH 7.5, 0.1 mM EDTA, 0.1 mM EGTA, 0.5% SDS, 0.1 mM β-mercaptoethanol, Protease Inhibitor Cocktail (Roche), and Phosphatase Inhibitor Buffer 25 × (25 mM Na3VO4, 250 mM PNPP, 250 mM β-glycerophosphate, 125 mM NaF). Nuclear protein extraction was performed as described in [16]. Total protein extraction for p65 phosphorylated (Ser536) was performed using 25 mM Tris pH 7.4, 150 mM NaCl, 1 mM EDTA, 1% NP-40, 5% glycerol, Protease Inhibitor Cocktail, and Phosphatase Inhibitor Buffer 25 ×. Protein extracts were separated on 10% SDS-PAGE gels and transferred onto a low–fluorescence background PVDF blotting membrane (Millipore). Quantitative LI-COR technology was used for Western blot analyses (Odyssey Infrared Imaging System v3.0.16, LI-COR, Biosciences). Procedure is described in [13], and antibodies used are listed in Supplementary Table S1. Full-length blots are available in Supplementary Figure S5.
Plasmid Transfection and Luciferase Reporter Assay
EAhy926 cells (100,000 cells/well of 24-well plate) were transiently co-transfected with 0.225 μg of pNF-κB-Firefly luciferase reporter plasmid (Stratagene) and 0.025 μg of pRenilla luciferase-TK using 0.5 μl of Lipofectamine 2000 (Invitrogen), following manufacturer’s instructions. Twenty-four hours posttransfection, cells were incubated for 6 hours under N, chH, or cyH with or without TNFα (0.1 ng/ml and 1 ng/ml). Four hours later, cells were lysed, and luciferase activities were measured using Dual Luciferase Reporter Assay Kit (Promega). Firefly luciferase activity was normalized to Renilla luciferase activity.
siRNA Transfection
EAhy926 cells were seeded at 250,000 cells/well (six-well plate). After 24 hours, medium was replaced by 2 ml DHG-L1 medium containing 20 nM human HIF-1α siRNA (mixture of 4 siRNA, #M-00401805, Dharmacon) or human RelA siRNA (mixture of 4 siRNA, #L-003533-00, Dharmacon) or Non-Targeting siRNA (#D-001810-10, Dharmacon) and INTERFERin (Polyplus Transfection) diluted 1:250. After 24 hours, 2 ml DHG-L1 medium containing 10% FBS were added to the transfection mix. Twenty-four hours after medium change, cells were trypsinized and seeded at 2,000,000 cells/T25. Seventy-two hours after transfection, cells were used for the appropriate experiments.
Monocyte Adhesion on HUVEC
HUVEC were seeded at 150,000 cells/well in 24-well plates coated with 0.2 % PBS-gelatin (#G9391, Sigma). Forty-eight hours after seeding, cells were incubated as previously described for 6 hours. Incubation medium was supplemented by 4 mM l-glutamine and 0.5% BSA (#A8806, Sigma). Thereafter, medium was replaced by 1 ml medium containing 600,000 calcein-labeled THP-1 monocytes, and cells were incubated for 1 hour at 37°C. After incubation, wells were rinsed three times with PBS. One milliliter of PBS was added, and the fluorescence associated to the adherent leukocytes was determined (485 nm/520 nm, Fluoroskan Ascent).
Kaplan-Meier Curves
An Affymetrix dataset containing gene expression data from 177 colon cancer patients, for whom complete demographic, histologic grade, stage, and differentiation information are available, was used for survival studies (downloaded from GEO, GSE17536). Procedures of RNA extraction and hybridization are described in [17]. It has to be noted that one patient (GSM437119) was excluded from analyses because he died a very long time after the diagnostic. Raw data in CEL files are publicly available and were processed according to the method defined by Pierre et al., by using alternative CDFs from AffyProbeMiner and GCRMA for normalization and summarization of downloaded data in the R statistical environment [18]. Kaplan-Meier curves were drawn with GraphPad Prism using disease-specific survival (DSS; death from cancer) time and event (0; 1) for each subgroup. One hundred seventy-six patients were separated into two equal subgroups (n= 88, median value) according to the expression of one gene. These subgroups were then subdivided when combinations of several gene expressions were studied.
Statistical Analysis
Data are reported as mean ± 1 SD (in vitro) or mean ± 1 SEM (in vivo). Statistical analyses were performed using SigmaStat Software or GraphPad Prism. Corresponding statistical tests are outlined in figure captions.
Results
Numerous studies have evidenced different consequences of cycling hypoxia versus chronic hypoxia on cancer cell as well as on endothelial cell behavior, altering angiogenesis, tumor growth, and metastasis [14], [16], [19], [20], [21]. Nevertheless, no one until now has suggested an impact of cycling hypoxia on tumor-related inflammation.
Cycling Hypoxia-Induced Amplified Inflammatory Phenotype in Endothelial Cells
The effects of cycling hypoxia, compared to chronic hypoxia, were investigated in vitro on the endothelial cell inflammatory response induced by TNFα used at physiological concentration (0.1 ng/ml) [22]. Cycling hypoxia was mimicked by four cycles of 1-hour hypoxia followed by 30-minute reoxygenation. This protocol was based on in vivo measurements of oxygen fluctuations in tumor blood networks revealing a frequency of 0.5 to 1 cycle per hour [23]. It was demonstrated in vitro that 1-hour hypoxia causes a rapid accumulation of HIF-1α, whereas 30-minute reoxygenation is sufficient to abrogate this accumulation [14]. This protocol showed a progressive accumulation of HIF-1α along cycles in endothelial cells [24], [25] and permitted to observe an increase in endothelial cell migration, tubulogenesis and resistance towards proapoptotic stresses, and an increase in tumor cell radioresistance [14], [16]. Here, EAhy926 endothelial cells and HUVEC were exposed to 6 hours of N, chH, or cyH with or without TNFα (0.1 ng/ml). Relative mRNA expression of IL-6, IL-8, and ICAM-1 was quantified directly after the 6 hours of incubation (6h+0hR) (Figure 1). Cycling hypoxia rapidly increased TNFα-induced IL-8 (Figure 1A) and ICAM-1 (Figure 1B) mRNA level in both cell types. Interestingly, the increase in ICAM-1 mRNA expression in HUVEC by cycling hypoxia was more discernible at a later study time point, i.e., 4-hour reoxygenation after the 6 hours of incubation (6h+4hR) (Supplementary Figure S1A). A cycling hypoxia–specific increase in TNFα-induced mRNA expression of genes encoding other adhesion molecules was observed for VCAM-1 and selectin-E (SELE) in HUVEC (not expressed by EAhy926 cells) (Supplementary Figure S1, B–C). Intriguingly, this low TNFα concentration did not increase relative IL-6 mRNA abundance (Figure 1C) even at an earlier time point (tested after 3 hours) (data not shown). VEGFA mRNA expression was used as positive control for chronic hypoxia (Supplementary Figure S1D). For cycling hypoxia, we used PTGS2 mRNA expression (gene encoding cyclooxygenase-2, COX-2) as positive control. Daneau et al., described PTGS2 gene expression as part of cycling hypoxia gene signature [26]. Here, cycling hypoxia increased PTGS2 mRNA expression only in the presence of TNFα (Supplementary Figure S1E) in HUVEC (PTGS2 is not expressed in EAhy926 cells).
Figure 1.
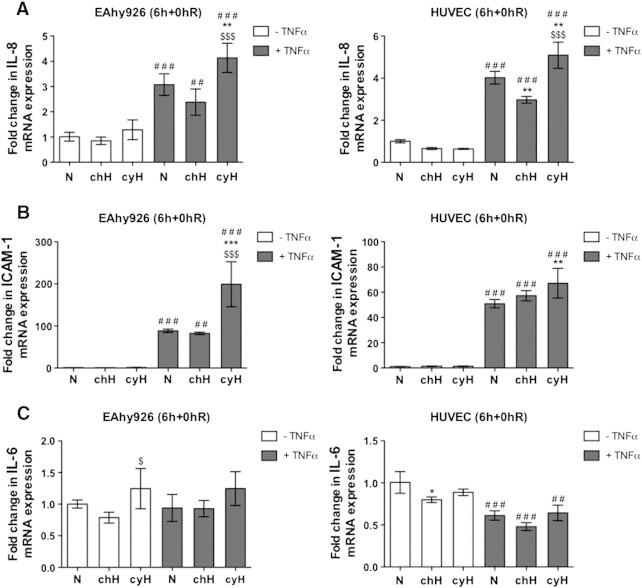
Endothelial cells exposed to cycling hypoxia display a proinflammatory phenotype that is characterized by IL-8 and ICAM-1 mRNA overexpression. EAhy926 cells and HUVEC were exposed to N, chH, or cyH with or without TNFα (0.1 ng/ml) for 6 hours. The relative abundance of IL-8 (A), ICAM-1 (B), and IL-6 (C) mRNA was evaluated directly after the incubation (6h+0hR) by RT-qPCR (n= 3, mean ± 1 SD). Statistical analysis was performed by two-way ANOVA and Holm-Sidak test as post hoc test. * chH/cyH versus corresponding N, $ cyH versus corresponding chH, # TNFα versus corresponding control. *, $, #, P < .05; **, $$, ##, P < .01; ***, $$$, ###, P < .001.
To confirm these data, IL-6 and IL-8 secretion was evaluated in media harvested either directly after the incubation (6h+0hR) or after 16-hour reoxygenation (6h+16hR) to measure cytokine accumulation. For IL-8, results showed the same trend as the one observed for gene expression, that is, a highly significant increase in TNFα-induced IL-8 secretion when endothelial cells were exposed to cycling hypoxia (Figure 2A). Surprisingly, IL-6 secretion was also increased by TNFα, which did not correspond to gene expression profile. Indeed, TNFα seemed to be needed for IL-6 secretion, as the basal level of secretion was very low. TNFα-induced IL-6 secretion was higher under cycling hypoxia than under normoxia or chronic hypoxia in EAhy926 cells and HUVEC (Figure 2B). Polotsky et al., have reported a similar discrepancy between unchanged IL-6 mRNA abundance profile and an increase in IL-6 secretion, and they suggested a posttranscriptional regulation occurring during protein synthesis or secretion process [27]. A potential role of reactive oxygen species in IL-6 secretion has been described [28]. In parallel, it was demonstrated that TNFα stimulates reactive oxygen species generation in EAhy926 cells [29]. Hence, both observations could explain the increase in IL-6 secretion under TNFα stimulation independently of an increase in mRNA level.
Figure 2.
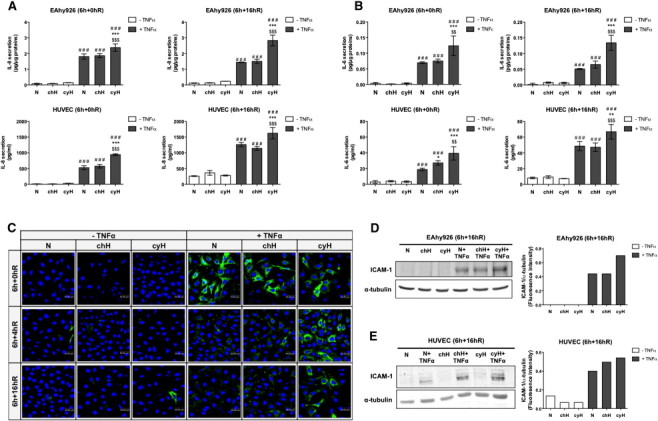
Cycling hypoxia increases IL-6 and IL-8 secretion induced by TNFα and stabilizes TNFα-induced ICAM-1 expression along reoxygenation time. (A–E) EAhy926 cells and HUVEC were exposed to N, chH, or cyH with or without TNFα (0.1 ng/ml) for 6 hours. (A–B) Conditioned media were recovered directly after the incubation (6h+0hR) or after 16-hour reoxygenation (6h+16hR) and assayed to determine IL-8 and IL-6 concentration by ELISA (n= 3, mean ± 1 SD). Statistical analysis was performed by two-way ANOVA and Holm-Sidak test as post hoc test. * chH/cyH versus corresponding N, $ cyH versus corresponding chH, # TNFα versus corresponding control. *, $, #, P < .05; **, $$, ##, P < .01; ***, $$$, ###, P < .001. (C) EAhy926 cells were fixed directly after the incubation (6h+0hR) or after 4-hour (6h+4hR) or 16-hour (6h+16hR) reoxygenation and were immunostained for ICAM-1 (green). Nuclei were labeled with TOPRO-3 (blue). (D–E) After 16-hour reoxygenation, total abundance of ICAM-1 in EAhy926 cells (D) and HUVEC (E) was detected by Western blotting (n= 1). α-Tubulin was used as loading control. ICAM-1 fluorescence intensity was quantified and was normalized for α-tubulin.
ICAM-1 protein expression was firstly evaluated by immunofluorescence staining in EAhy926 cells (Figure 2C). Neither cycling hypoxia nor chronic hypoxia influenced TNFα-induced ICAM-1 expression directly after the incubation (6h+0hR). However, after 4-hour (6h+4hR) and 16-hour (6h+16hR) reoxygenation, cycling hypoxia sustained TNFα-induced ICAM-1 expression, whereas it was strongly decreased under normoxia or chronic hypoxia. Cycling hypoxia could increase the stability or maintain ICAM-1 expression for a longer time. The higher abundance of ICAM-1 protein after 16-hour reoxygenation was confirmed in EAhy926 cells (Figure 2D) and HUVEC (Figure 2E) stimulated with TNFα and exposed to cycling hypoxia by Western blot analyses.
Role of NF-κB in the Amplification of Inflammation Induced by Cycling Hypoxia
The genes studied here are targets of NF-κB, the master transcription factor that regulates inflammation. We thus investigated whether NF-κB could be overactivated in response to cycling hypoxia. Firstly, p65 activation was evaluated by assessing its nuclear translocation and its phosphorylation on serine 536. Results showed that cycling hypoxia, and to a lower extent chronic hypoxia, in the presence of TNFα increased the nuclear localization of p65 (Figure 3A) as well as the abundance of Ser536 phosphorylated p65 (Figure 3B). Finally, NF-κB transcriptional activity was studied using a luciferase reporter assay. Results showed that cycling hypoxia led to a significant increase in TNFα-induced NF-κB transcriptional activity (Figure 3C). As previously described [16], cycling hypoxia alone was not able to affect NF-κB activation in endothelial cells.
Figure 3.
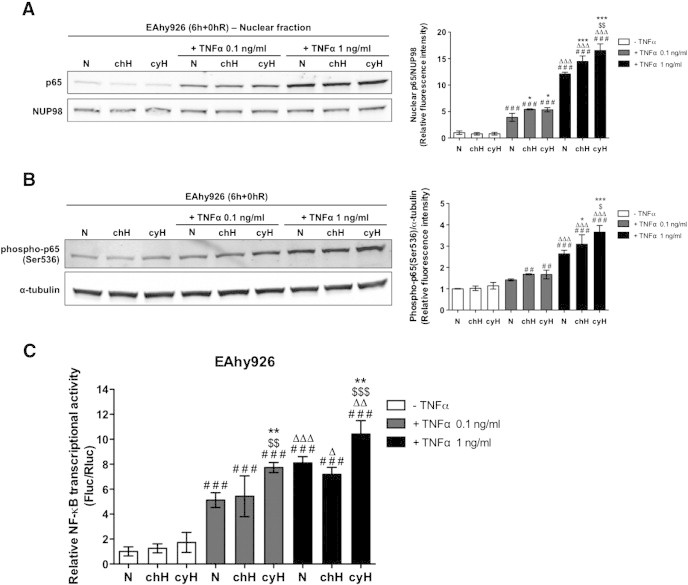
Cycling hypoxia increases the nuclear abundance of p65, the abundance of p65 phosphorylated on serine 536, and the transcriptional activity of NF-κB, induced by TNFα. (A–B) EAhy926 cells were exposed to N, chH, or cyH with or without TNFα (0.1 ng/ml or 1 ng/ml) for 6 hours. (A) Representative immunoblots and the relative quantification bar graph represent p65 nuclear abundance normalized by NUP98 (n= 3, mean ± 1 SD). (B) Representative immunoblots and the relative quantification bar graph represent the total abundance of p65 phosphorylated on serine 536 normalized for α-tubulin (n= 3, mean ± 1 SD). (C) EAhy926 cells were transiently co-transfected with the pNFκB-Fluc reporter plasmid encoding firefly luciferase and the pRL-TK normalization plasmid encoding renilla luciferase. Twenty-four hours posttransfection, cells were exposed to N, chH, or cyH with or without TNFα (0.1 ng/ml or 1 ng/ml) for 6 hours. Luciferase activities were measured 4 hours after the incubation using dual luciferase reporter assay. Results are expressed as mean of the ratio between firefly and renilla luciferase activity ± 1 SD (n= 3). (A–C) Statistical analysis was performed by two-way ANOVA and Holm-Sidak test as post hoc test. * chH/cyH versus corresponding N, $ cyH versus corresponding chH, # TNFα versus corresponding control, Δ TNFα 1 ng/ml versus corresponding TNFα 0.1 ng/ml. *, $, #, Δ, P < .05; **, $$, ##, ΔΔ, P < .01; ***, $$$, ###, ΔΔΔ, P < .001.
The mechanism behind the overactivation of TNFα-stimulated NF-κB by cycling hypoxia was then investigated. In unstimulated cells, inhibitor of NF-κB (IκB) family inhibitors sequester nuclear factor of kappa light chain enhancer of activated B cells (NF-κB) dimers in the cytoplasm, avoiding transcription of NF-κB target genes. Under NF-κB–activating stresses, IκB kinase (IKK) is activated by the phosphorylation of catalytic subunits, IKKα and IKKβ. Activated IKK then phosphorylates IκBα, leading to IκBα ubiquitination and degradation by the proteasome, enabling active NF-κB to translocate to the nucleus and to activate transcription. As NF-κB pathway is known to be rapidly activated [30], we followed the abundance of phospho-IKKα/β, phospho-IκBα, and total IκBα proteins at each step, i.e., hypoxia or reoxygenation, for the 6 hours of incubation under cycling hypoxia or normoxia (Figure 4A). To facilitate the understanding of the mechanistic behind this overactivation, experiments were performed with 1 ng/ml TNFα because a more marked effect of cycling hypoxia could be observed on p65 nuclear localization and phosphorylation abundance (Figure 3, A–B) at this concentration. Without TNFα (Figure 4B), no phosphorylation of IκBα was observed, and the total amount of IκBα did not vary under cycling hypoxia. However, when endothelial cells were stimulated with TNFα, important changes in NF-κB pathway were observed under cycling hypoxia (Figure 4C). After the first hour of TNFα stimulation (H1), IκBα was phosphorylated and total IκBα was almost undetectable, suggesting IκBα proteasomal degradation. This massive degradation occurred to the same extent under normoxia and cycling hypoxia. But at this step, a higher amount of phosphorylated IKK under cycling hypoxia was already highlighted, reflecting a higher IKK activity. Later on, after 1 hour and 30 minutes of incubation (R1), a high amount of total IκBα was detected under normoxia but not under cycling hypoxia. This phenomenon was observed until R2 step (3 hours of incubation). In parallel, the amount of phosphorylated IKK stayed higher under cycling hypoxia until R2 step as well. After R2 step, no more difference between normoxia and cycling hypoxia was evidenced. These results denoted that for longer incubation durations under normoxia, phosphorylated IκBα rapidly decreased and IκBα seemed restored, whereas under cycling hypoxia, the level of phosphorylated IκBα was kept higher over time and the increase in the amount of total IκBα was slower than in normoxia. The prolonged phosphorylation state of IκBα could be associated with an increased phosphorylation of IKKα/β, which is required for its activation, in cells incubated under cycling hypoxia in comparison to normoxia. Therefore, the persistent phosphorylation and thus degradation of IκBα as well as the slowing down of the neosynthesis of IκBα induced by cycling hypoxia could explain the increased NF-κB transcriptional activity.
Figure 4.
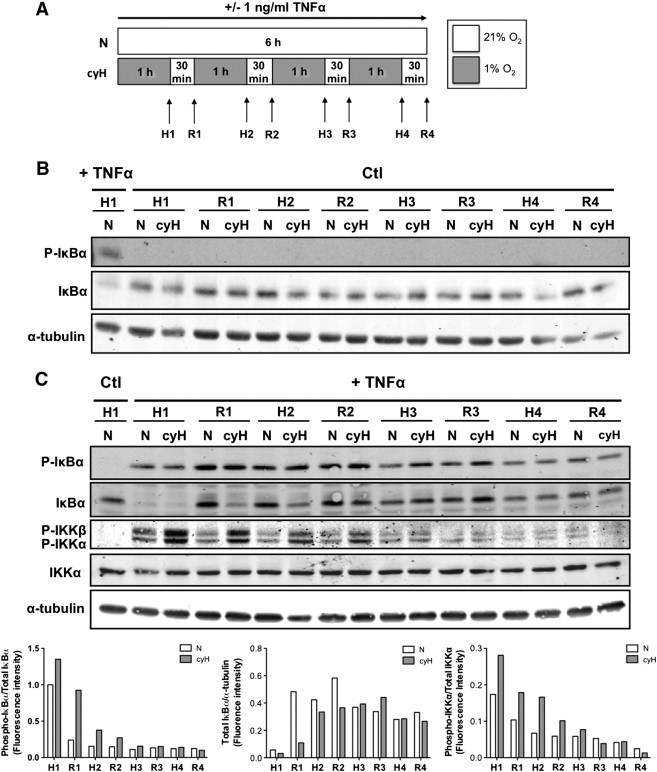
Cycling hypoxia prolongs TNFα-induced NF-κB activation by increasing IKKα/β phosphorylation state, IκBα phosphorylation, and thus its degradation and by slowing down the neosynthesis of IκBα. EAhy926 cells were exposed to N or cyH with or without TNFα (1 ng/ml) for 6 hours. Experimental model is depicted in (A). Phosphorylation of IκBα and IKKα/β and total abundance of IκBα and IKKα were assessed by Western blotting after each step of hypoxia (H1-H2-H3-H4) and reoxygenation (R1-R2-R3-R4) in comparison to N, without (B) or with TNFα (C) (n= 1). α-Tubulin was used as loading control. Bars represent phospho-IκBα fluorescence intensity normalized for total IκBα (left), total IκBα fluorescence intensity normalized for α-tubulin (center) and phospho-IKKα fluorescence intensity normalized for IKKα (right) in the presence of TNFα.
We then examined the involvement of NF-κB in the increase in IL-8 and IL-6 secretion and in the overexpression of ICAM-1 in EAhy926 cells by knocking down p65 using siRNA (Figure 5). Silencing efficacy was checked at the protein level by Western blot analyses (Figure 5A). Results showed that IL-8 (Figure 5B) and IL-6 (Figure 5C) secretion induced by TNFα and its further increase by cycling hypoxia were completely abrogated by p65 silencing. In addition, p65 silencing abolished the effect of cycling hypoxia in the presence of TNFα on ICAM-1 mRNA expression (Figure 5D). The involvement of HIF-1 was also studied by knocking down HIF-1α expression, but no inhibition of the expression of these inflammatory markers was observed (Supplementary Figure S2). Together, these findings confirmed the central role of NF-κB in the amplified proinflammatory phenotype of endothelial cells in response to cycling hypoxia.
Figure 5.
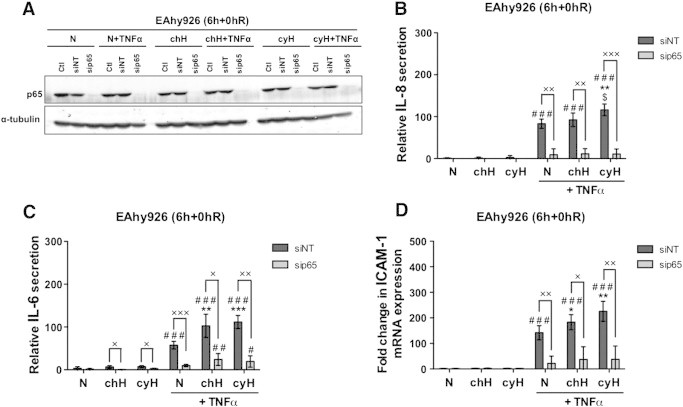
NF-κB is involved in the increase in TNFα-induced IL-6 and IL-8 secretion when cells are exposed to cycling hypoxia and in the increase in TNFα-induced ICAM-1 mRNA expression. EAhy926 cells transfected or not (Ctl) with nontargeting siRNA (siNT) or p65 siRNA (sip65) were exposed to N, chH, or cyH with or without TNFα (0.1 ng/ml) for 6 hours. (A) Total abundance of p65 was assessed by Western blotting to verify p65 silencing. α-Tubulin was used as loading control. (B–C) Directly after the incubation, conditioned media were recovered for IL-6 or IL-8 secretion quantification by ELISA. (D) The relative abundance of ICAM-1 mRNA was evaluated by RT-qPCR. (B–D) Results are expressed as mean ± 1 SD (n= 3). Statistical analysis was performed by two-way ANOVA and Holm-Sidak as post hoc test. t test was used to compare siNT versus sip65 in the same condition. * chH/cyH versus corresponding N, $ cyH versus corresponding chH, # TNFα versus corresponding control,× sip65 versus siNT. *, $, #, ×, P < .05; **, $$, ##, ××, P < .01; ***, $$$, ###, ×××, P < .001.
Cycling Hypoxia-Induced Activated Phenotype in Endothelial Cells
Finally, we wanted to analyze a physiological consequence of this cycling hypoxia–amplified inflammatory phenotype. Therefore, we evaluated monocyte adhesion to endothelial cells. Results showed that cycling hypoxia increased THP-1 monocyte adhesion to HUVEC stimulated by TNFα (Figure 6) and thus validated a biological consequence of cycling hypoxia on endothelial cell function.
Figure 6.
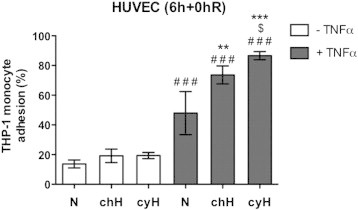
Cycling hypoxia amplifies THP-1 monocyte adhesion on HUVEC induced by TNFα. EAhy926 cells were exposed to N, chH, or cyH with or without TNFα (0.1ng/ml) for 6 hours. Directly after the incubation, calcein-labeled THP-1 monocytes were added on HUVEC for 1 hour. Endothelial cells were then rinsed to remove nonadherent monocytes. Results are expressed as the percentage of THP-1 monocyte adhesion (n= 3, mean ± 1 SD). Fluorescence from 600,000 calcein-labeled THP-1 monocytes was used to determine 100%. Statistical analysis was performed by two-way ANOVA and Holm-Sidak test as post hoc test. * chH/cyH versus corresponding N, $ cyH versus corresponding chH, # TNFα versus corresponding control. $, P < .05; ** P < .01; ***, ###, P < .001.
Cycling Hypoxia-Induced Overall Tumor Inflammation In Vivo
To attest that cycling hypoxia could account for global tumor inflammation in vivo, tumor-bearing mice were exposed for 4 hours and 30 minutes to either normal air (control) or three cycles of 1-hour 7% O2 breathing interrupted by 30 minutes of normal air breathing (cycling hypoxia), according to [14]. Tumors were collected 16 hours later (Figure 7). RNA extraction was performed on whole tumors and not specifically on endothelial cells. mRNA level studies thus reflected the overall effect of cycling hypoxia on the tumor. Firstly, we confirmed that cycling hypoxia, by itself, increased PTGS2 (COX-2 coding gene) expression, used as positive control for cycling hypoxia (Figure 7A). VEGF mRNA expression was also significantly increased in murine tumors by cycling hypoxia (Supplementary Figure S3). In addition, cycling hypoxia increased mRNA levels of IL-6 as well as of KC and MIP-2, which are two functional IL-8 murine homologs. On the other hand, no increase in ICAM-1 mRNA level was detected under cycling hypoxia. This could be explained by the very low proportion of endothelial cells in the tumor mass. Furthermore, tumor imperfect neovasculature in control/cyH mouse tumors probably exists and could lead to a basal level of inflammation already up linked to the occurrence of cycling hypoxia events. Thus, it could be very tricky to demonstrate an increase in adhesion molecule expression. This remark emphasizes the limitation of our cycling hypoxia study model where we artificially amplified a phenomenon naturally occurring in tumors. We also assayed VCAM-1 and SELE mRNA expression to try to discriminate the endothelial impact of cycling hypoxia on tumor inflammation (Supplementary Figure S3). Both their mRNA expression tended to be increased in cycling hypoxic tumors, but results were not significant. Therefore, we performed a functional test to appreciate cycling hypoxia effects on endothelial cells by immunostaining CD11b (Figure 7B). CD11b is expressed by all myeloid lineage cells and is required for firm adhesion of leukocytes to the endothelium by binding to ICAM-1. The abundance of CD11b was higher in cryosections from cycling hypoxic tumors than from normoxic tumors, suggesting an increase in leukocyte infiltration into tumors of mice exposed to cycling hypoxia. Tumors of mice injected with LPS were used as positive control for specific CD11b immunostaining. All together, these findings suggest that cycling hypoxia leads to an amplification of tumor-related inflammation.
Figure 7.
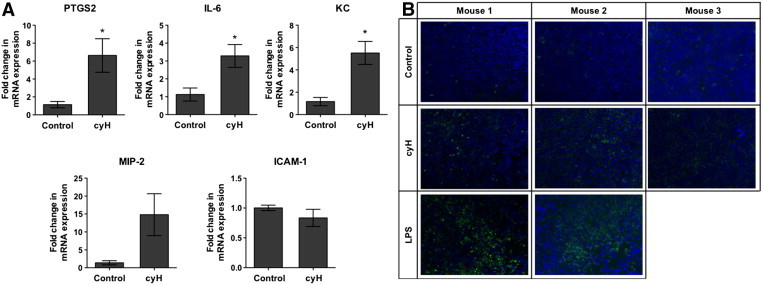
Cycling hypoxia enhances proinflammatory gene expression and leads to an increase in leukocyte infiltration in tumors in mice. (A–B) LLc tumor-bearing C57BL/6 mice were exposed to normal air (control) or cyH (4h30) (three cycles of 1-hour hypoxia [7% O2 breathing] followed by 30-minute reoxygenation (21% O2]), or were injected with LPS (1 mg/kg) 44 hours and 30 minutes before being killed. Tumors were collected 16 hours later. (A) The relative abundance of PTGS2, IL-6, KC, MIP-2, and ICAM-1 mRNA into tumors was evaluated by RT-qPCR (n= 3, mean ± 1 SEM). t test was performed as statistical analysis. *, P < .05 cyH versus Control. (b) Cryosections of tumors were immunostained for CD11b (green) and were counterstained with DAPI (blue).
Cycling Hypoxia-Induced Amplified Inflammatory Phenotype and Poor Prognosis in Human Colon Cancer
Finally, we sought to determine whether the inflammatory gene expression profile amplified by cycling hypoxia could be of clinical interest for cancer prognosis. We focused on colon cancer for three reasons: studies have already related the importance in cancer progression of the genes encoding COX-2 (PTGS2), IL-6, and IL-8 taken separately [31], [32], [33]; abnormal morphology of tumor blood network has been shown in human colon carcinoma [34]; and the presence of cycling hypoxic areas was evidenced in human colorectal adenocarcinomas [35]. Firstly, gene expression was quantified in colon tumor tissue. Results showed that PTGS2, IL-6, and IL-8 mRNA expression was significantly upregulated in tumors versus corresponding healthy tissues (Figure 8A). Carbonic anhydrase 9 (a specific marker of hypoxia) gene expression was significantly increased in tumors, indicating that these tumors contained hypoxic areas (Supplementary Figure S4A). ICAM-1 mRNA level was increased in six patients out of seven, but this was not statistically significant. SELE mRNA expression was increased in seven patients out of seven, whereas VCAM-1 mRNA expression was not significantly dysregulated (Supplementary Figure S4A). Secondly, we analyzed gene expression data of a public Affymetrix dataset (GSE17536) involving 176 patients with colon cancer [17]. To know if the cycling hypoxia–amplified inflammatory phenotype identified in this work could be used as a prognosis biomarker, survival analyses using the Kaplan-Meier method were performed. Patients were primarily stratified into two equal subgroups, based on the median value, according to the expression of one gene (i.e., PTGS2, IL-6, IL-8, ICAM-1), and the probability of DSS for patients with lower or higher gene expression was compared (Supplementary Figure S4B). None of the genes, by their own expression, demonstrated a significant influence on the probability of survival, even for PTGS2 already well known to have an increased expression in colon cancer (Supplementary Figure S4B). Patients were then subdivided as a function of the expression of several genes taken simultaneously. We paralleled the probability of specific cancer survival between patients displaying a simultaneous high expression of ICAM-1, IL-6, and IL-8 and patients with all the other expression phenotypes (Figure 8B). Patients with ICAM-1high/IL-6high/IL-8high phenotype had a significantly lower survival probability than others (P < .05). This was not the case if we only considered the expression of IL-6 and IL-8 taken together (data not shown). Finally, we integrated all the criteria evidenced in the previous results, a simultaneous PTGS2high, ICAM-1high, IL-6high, and IL-8high expression, to subdivide patients into two groups (Figure 8C). Patients with this inflammatory expression phenotype had a significant probability of colon cancer specific survival, with 2.4-fold more risk of cancer death. Thus, results demonstrated that inflammation amplified by cycling hypoxia is protumoral. Afterwards, we wanted to highlight an inflammatory expression phenotype specifically associated to cycling hypoxia and not just an inflammatory phenotype. For that, we added a cycling hypoxia–specific expression marker described by Boidot et al., [36] to the inflammatory signature. Indeed, these authors generated a very robust transcriptomic cycling hypoxia signature from Affymetrix analyses on mRNA extracts of 20 tumor cell lines exposed during 24 hours under cycling hypoxia (30-minute normoxia [21% O2] followed by 30-minute hypoxia [1% O2]) or 24 hours under normoxia. Thanks to these analyses, they identified the 100 first most differentially expressed genes in cells exposed to cycling hypoxia in comparison to cells maintained under normoxia. For our analysis, we just took in consideration the first top gene that is the most differentially expressed, BIRC5, characterized by a lower expression under cycling hypoxia. Firstly, we stratified patients into two equal groups according to the expression of BIRC5 alone (Supplementary Figure S4C). Results showed that patients with a lower expression of BIRC5 had a significant lower probability of survival. So, BIRC5, by its own expression, is able to significantly separate survival curves for patients with colon cancer. Finally, we compared survival curves between patients expressing the inflammatory phenotype specifically associated to cycling hypoxia, defined by a simultaneous expression of BIRC5low, PTGS2high, ICAM-1high, IL-6high, and IL-8high, and patients with another phenotype. This specific signature is able to discriminate patients with a very low probability of cancer survival (5.5-fold more risk of death). This new and original phenotype could thus be used as a biomarker of poor prognosis in colon cancer.
Figure 8.
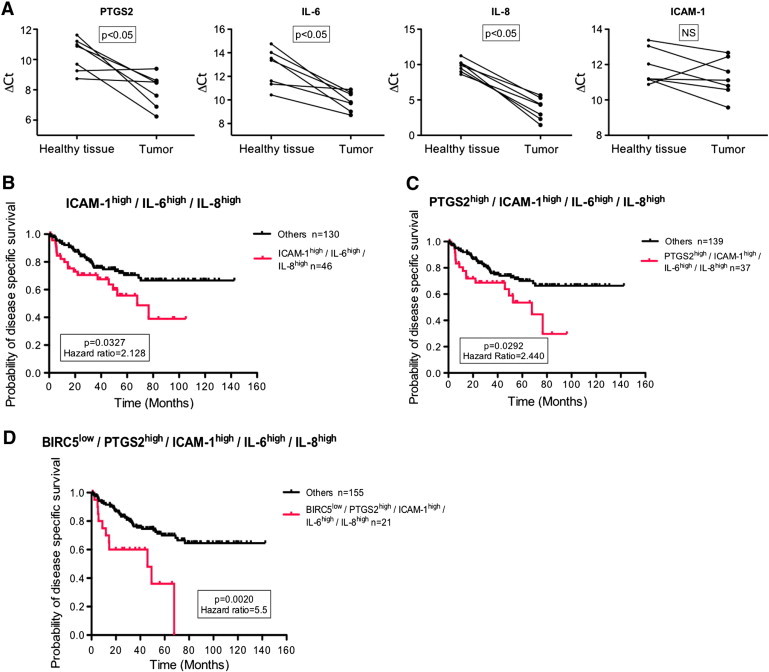
Cycling hypoxia-specific proinflammatory phenotype is associated with poor prognosis in human colon cancer. (A) Healthy and tumor biopsies from seven patients with colon cancer were collected and were used to evaluate PTGS2, IL-6, IL-8, and ICAM-1 mRNA expression by RT-qPCR. ΔCt of tumor is compared to ΔCt of healthy tissue for each patient. Statistical analysis was performed by Wilcoxon test. (B–C) Public Affymetrix array data of 176 colon cancer patients (GSE17536) for whom cancer-specific survival time is known were reanalyzed. Patients were stratified into two subgroups for each presented graph according to the median value, and Kaplan-Meier plots were drawn. The first graph (B) represents the probability of DSS for patients who display ICAM-1high/IL-6high/IL-8high expression phenotype (red) versus patients with other phenotypes (black), the second graph (C) patients with PTGS2high/ICAM-1high/IL-6high/IL-8high expression phenotype (red) versus patients with other phenotypes (black), and the third graph (D) patients with BIRC5low/PTGS2high/ICAM-1high/IL-6high/IL-8high expression phenotype (red) versus patients with other phenotypes (black). Gehan-Breslow-Wilcoxon test was used for statistical analysis. Hazard ratio (ratio of instant risk of death between groups) is also denoted.
Discussion
As suggested by Rofstad et al., [37], cycling hypoxia may constitute a more serious problem for cancer patient treatment than chronic hypoxia. Indeed, the fraction of cycling hypoxic cells is generally larger than the one of chronic hypoxic cells. Moreover, cycling hypoxic tumor cells have a higher metastatic potential than chronic tumor cells. This could be related to their close localization to blood vessels, as well as to their higher energetic status [37]. Furthermore, cycling hypoxia, in contrast to chronic hypoxia, also promotes endothelial cell survival and increases their capacity to migrate and to form tubes, hence favoring tumor angiogenesis [14], [16]. But, until now, nobody studied the possible relationship between cycling hypoxia and tumor inflammation.
Endothelial cells, key regulators of tumor growth, differentially respond to changes in tumor microenvironment [38], as exemplified during inflammation when TNFα targets endothelial cells, leading to the upregulation of some cell surface receptors and facilitating leukocyte transmigration [39]. We therefore hypothesized that endothelial cells could be a perceptive sensor of cycling hypoxia and inflammation simultaneously. Results showed that endothelial cells exposed to cycling hypoxia displayed an amplified inflammatory phenotype, characterized by an increase in TNFα-induced IL-8, ICAM-1, PTGS2, SELE, and VCAM-1 mRNA levels and TNFα-induced IL-6 and IL-8 secretion. Furthermore, cycling hypoxia sustained ICAM-1 protein expression enhanced by TNFα. Effects of cycling hypoxia were already clear after 6 hours, which is a relatively short duration, but we could probably expect an inflammatory amplification loop if this phenomenon happens on a longer time scale as it is pathophysiologically the case in vivo. Besides, analyses were performed on a relatively low number of inflammatory genes. It is highly probable that other inflammatory markers have a TNFα-induced expression increased by cycling hypoxia.
In parallel, cycling hypoxia efficiently increased NF-κB transcriptional activity. Indeed, cycling hypoxia prolonged the phosphorylation and degradation of IκBα induced by TNFα and slowed down its resynthesis in the following cycles of incubation. Cycling hypoxia could thus delay the negative feedback loop ending the NF-κB response. The involvement of NF-κB overactivation in the increase in IL-6, IL-8, and ICAM-1 expression in endothelial cells exposed to cycling hypoxia was demonstrated using siRNA. Interestingly, NF-κB is considered as a key molecular link between inflammation and cancer, and has been shown to be dysregulated in many cancers [40], [41]. Here, we showed in vitro that overactivation of NF-κB could also participate to the amplification of inflammation through the induction of endothelial cell proinflammatory phenotype. The inflammatory phenotype of endothelial cells induced by cycling hypoxia was biologically confirmed by an increase in THP-1 monocyte adhesion.
The role of cycling hypoxia in cancer-related inflammation in vivo in tumor-bearing mice was validated, as an increase in IL-6, KC, and MIP-2 gene expression was also observed. This amplification of inflammation is probably not only mediated by endothelial cells but by several other cell types of tumor microenvironment. Nonetheless, results suggested that a part of the exacerbation of tumor inflammation by cycling hypoxia could proceed through its effect on tumor endothelium, as we observed an increase in leukocyte infiltration. An increased influx of leukocytes into tumors is known to be an amplificatory mechanism of tumor inflammation with the continuous secretion of inflammatory mediators [42]. Our in vivo model confirmed the effects of cycling hypoxia not especially on the endothelial inflammatory phenotype but on the overall tumor inflammation.
To determine if the specific subset of genes induced by cycling hypoxia could be pathophysiologically relevant in human cancer, we examined whether these genes are upregulated in colon tumor tissue. IL-6, IL-8, and PTGS2 expression was significantly increased. We finally demonstrated that cycling hypoxia–specific inflammatory phenotype, characterized by a simultaneous BIRC5low, PTGS2high, ICAM-1high, IL-6high, and IL-8high expression, is associated with a low probability of colon cancer specific survival. We thus highlighted a new phenotypic biomarker that could be used in clinic to identify more precisely colon tumors associated with a poor prognosis. As this inflammatory phenotype may influence cancer growth and metastasis, it could suggest that cycling hypoxia–amplified inflammation is protumoral. A good demonstration that the inflammation may support tumor development came from the data showing that long-term users of nonsteroidal anti-inflammatory drugs presented a diminished cancer risk, up to 40% to 50% for colon cancer [43]. Our results are in line with previous reports, as most of the genes outlined in this work are already known targets for cancer treatment. Indeed, as PTGS2 (COX-2 encoding gene) expression is well described to be increased in colon cancer, COX-2 specific inhibitors, like celecoxib, were tested in trials as a prevention or therapeutic option in this cancer. Although COX-2 inhibitors reduced the incidence in colonic adenomas, they might encounter cause cardiovascular and gastrointestinal side effects, preventing their routine use in cancer management [44]. Likewise, several clinical studies using anti–IL-6 antibodies for cancer treatment have been reported, but they are still in clinical trials [45]. The novelty of our results is that cycling hypoxia simultaneously increases the expression of a subset of inflammatory genes, which accounts for tumor aggressiveness. Because of drug side effects, it could be more efficient to target this mechanism rather than each candidate gene independently. Hence, a new approach to reduce tumor-promoting inflammation could be to specifically prevent cycling hypoxia occurrence, as for instance by “vasculature normalization treatment” [46]. All together, our findings suggest that preventing cycling hypoxia to occur could be an ingenious way by which colon cancer treatment would be improved.
In conclusion, our results evidenced a new mechanism that accounts for the amplification of tumor-related inflammation, initiated by cycling hypoxia, which favors tumor aggressiveness.
The following are the supplementary data related to this article.
(A–C) Cycling hypoxia increases TNFα-induced mRNA expression of genes encoding adhesion molecules, namely, ICAM-1, VCAM-1, and SELE, in HUVEC. Cells were exposed to N, chH, or cyH with or without TNFα (0.1 ng/ml) for 6 hours. (A) The relative abundance of ICAM-1 mRNA was evaluated after 4-hour reoxygenation (6h+4hR) by RTqPCR (n= 3, mean ± 1 SD). (B–C) The relative abundance of VCAM-1 (B) and SELE (C) mRNA was evaluated directly after the incubation (6h+0hR) by RT-qPCR (n= 3, mean ± 1 SD). (D) Endothelial cells exposed to chronic hypoxia evidence VEGF mRNA overexpression. EAhy926 cells (left) and HUVEC (right) were exposed to N, chH, or cyH with or without TNFα (0.1 ng/ml) for 6 hours. The relative abundance of VEGF mRNA was evaluated directly after the incubation (6h+0hR) by RT-qPCR (n= 3, mean ± 1 SD). (E) Cycling hypoxia increases PTGS2 mRNA expression induced by TNFα in HUVEC. Cells were exposed to N, chH, or cyH with or without TNFα (0.1 ng/ml) for 6 hours. The relative abundance of PTGS2 mRNA was evaluated after the incubation (6h+0hR) by RT-qPCR (n= 3, mean ± 1 SD).
Statistical analysis was performed by two-way ANOVA and Holm-Sidak test as post hoc test. * chH/cyH versus corresponding N, $ cyH versus corresponding chH, # TNFα versus corresponding control. *, $, #, P < .05; **, $$, ##, P < .01; ***, $$$, ###, P < .001.
HIF-1 is not involved in the increase in TNFα-induced IL-6 and IL-8 secretion when cells are exposed to cycling hypoxia or in the increase in TNFα-induced ICAM-1 mRNA expression. EAhy926 cells transfected or not (Ctl) with nontargeting siRNA (siNT) or HIF-1α siRNA (siHIF1α) were exposed to N, chH, or cyH with or without TNFα (0.1 ng/ml) for 6 hours. (A) Total abundance of HIF-1α was assessed by Western blotting to verify HIF-1α silencing. α-Tubulin was used as loading control. (B–C) Directly after the incubation, conditioned media were recovered for IL-6 or IL-8 secretion quantification by ELISA. (D) The relative abundance of ICAM-1 mRNA was evaluated by RT-qPCR. (B–D) Results are expressed as mean ± 1 SD (n= 3). Statistical analysis was performed by two-way ANOVA and Holm-Sidak as post hoc test. t test was used to compare siNT versus siHIF-1α in the same condition. * chH/cyH versus corresponding N, $ cyH versus corresponding chH, # TNFα versus corresponding control, • siHIF-1α versus siNT. *, $, #, •, P < .05; **, $$, ##, ••, P < .01; ***, $ $$, ###, •••, P < .001.
LLc tumor-bearing C57BL/6 mice were exposed to normal air (control), cycling hypoxia (cyH; 4h30) (three cycles of 1-hour hypoxia [7% O2 breathing] followed by 30-minute reoxygenation [21% O2]). Tumors were collected 16 hours later. The relative abundance of VEGF, VCAM-1, and SELE mRNA into tumors was evaluated by RT-qPCR (n= 3, mean ± 1 SEM). t test was performed as statistical analysis. **, P < .01 cyH versus control.
(A) Healthy and tumor biopsies from seven patients with colon cancer were collected and were used to evaluate carbonic anhydrase 9, VCAM-1, and SELE mRNA expression by RT-qPCR. ΔCt of tumor is compared to ΔCt of healthy tissue for each patient. Statistical analysis was performed by Wilcoxon test.
(B–C) Public Affymetrix array data of 176 colorectal cancer patients (GSE17536) for whom cancer specific survival time is known were reanalyzed. Patients were stratified into two subgroups for each presented graph according to the median value, and Kaplan-Meier plots were drawn. Graphs represent the probability of DSS along the time for patients with high expression (red) versus patients with low expression (black) of PTGS2, ICAM-1, IL-6, IL-8, and BIRC-5 genes. Gehan-Breslow-Wilcoxon test was used for statistical analysis. Hazard ratio (ratio of instant risk of death between groups) is also denoted.
Full-length Western blot analyses.
References of primary and secondary antibodies used for Western blot analyses
Acknowledgements
The authors thank Fabienne George (University Hospital Center-Catholic University of Louvain Dinant Godinne hospital) for the scientific charge of the Biobank, Caroline Bouzin (Unit of Pharmacology and Therapeutics, UCL-Woluwé) for the observation of IHC studies, and Noëlle Ninane (“Morphology” technological platform, UNamur) for confocal analysis. Céline Tellier is a research fellow of FNRS (National Funds for Scientific Research, Brussels), and Déborah Desmet was a recipient of an FRIA Grant (FNRS, Brussels). The financial support of FRFC and FRSM (FNRS) is acknowledged.
Footnotes
Conflict of interest: The authors declare no conflict of interest.
The financial support of Fonds de la Recherche Fondamentale Collective and Fonds de la Recherche Scientifique Médicale (National Funds for Scientific Research) is acknowledged.
References
- 1.Thomlinson RH, Gray LH. The histological structure of some human lung cancers and the possible implications for radiotherapy. Br J Cancer. 1955;9:539–549. doi: 10.1038/bjc.1955.55. [DOI] [PMC free article] [PubMed] [Google Scholar]
- 2.Semenza GL. HIF-1: using two hands to flip the angiogenic switch. Cancer Metastasis Rev. 2000;19:59–65. doi: 10.1023/a:1026544214667. [DOI] [PubMed] [Google Scholar]
- 3.Hanahan D, Weinberg RA. The hallmarks of cancer. Cell. 2000;100:57–70. doi: 10.1016/s0092-8674(00)81683-9. [DOI] [PubMed] [Google Scholar]
- 4.McDonald DM, Choyke PL. Imaging of angiogenesis: from microscope to clinic. Nat Med. 2003;9:713–725. doi: 10.1038/nm0603-713. [DOI] [PubMed] [Google Scholar]
- 5.Brown JM, Giaccia AJ. The unique physiology of solid tumors: opportunities (and problems) for cancer therapy. Cancer Res. 1998;58:1408–1416. [PubMed] [Google Scholar]
- 6.Dewhirst MW. Intermittent hypoxia furthers the rationale for hypoxia-inducible factor–1 targeting. Cancer Res. 2007;67:854–855. doi: 10.1158/0008-5472.CAN-06-4744. [DOI] [PubMed] [Google Scholar]
- 7.Brown JM. Evidence for acutely hypoxic cells in mouse tumours, and a possible mechanism of reoxygenation. Br J Radiol. 1979;52:650–656. doi: 10.1259/0007-1285-52-620-650. [DOI] [PubMed] [Google Scholar]
- 8.Lorusso G, Ruegg C. The tumor microenvironment and its contribution to tumor evolution toward metastasis. Histochem Cell Biol. 2008;130:1091–1103. doi: 10.1007/s00418-008-0530-8. [DOI] [PubMed] [Google Scholar]
- 9.Balkwill F, Mantovani A. Inflammation and cancer: back to Virchow? Lancet. 2001;357:539–545. doi: 10.1016/S0140-6736(00)04046-0. [DOI] [PubMed] [Google Scholar]
- 10.Mantovani A. Cancer: inflaming metastasis. Nature. 2009;457:36–37. doi: 10.1038/457036b. [DOI] [PubMed] [Google Scholar]
- 11.Hanahan D, Weinberg RA. Hallmarks of cancer: the next generation. Cell. 2011;144:646–674. doi: 10.1016/j.cell.2011.02.013. [DOI] [PubMed] [Google Scholar]
- 12.Balkwill F. Tumour necrosis factor and cancer. Nat Rev Cancer. 2009;9:361–371. doi: 10.1038/nrc2628. [DOI] [PubMed] [Google Scholar]
- 13.Sermeus A, Genin M, Maincent A, Fransolet M, Notte A, Leclere L, Riquier H, Arnould T, Michiels C. Hypoxia-induced modulation of apoptosis and BCL-2 family proteins in different cancer cell types. PLoS One. 2012;7:e47519. doi: 10.1371/journal.pone.0047519. [DOI] [PMC free article] [PubMed] [Google Scholar]
- 14.Martinive P, Defresne F, Bouzin C, Saliez J, Lair F, Grégoire V, Michiels C, Dessy C, Feron O. Preconditioning of the tumor vasculature and tumor cells by intermittent hypoxia: implications for anticancer therapies. Cancer Res. 2006;66:11736–11744. doi: 10.1158/0008-5472.CAN-06-2056. [DOI] [PubMed] [Google Scholar]
- 15.Flamant L, Toffoli S, Raes M, Michiels C. Hypoxia regulates inflammatory gene expression in endothelial cells. Exp Cell Res. 2009;315:733–747. doi: 10.1016/j.yexcr.2008.11.020. [DOI] [PubMed] [Google Scholar]
- 16.Toffoli S, Roegiers A, Feron O, Van Steenbrugge M, Ninane N, Raes M, Michiels C. Intermittent hypoxia is an angiogenic inducer for endothelial cells: role of HIF-1. Angiogenesis. 2009;12:47–67. doi: 10.1007/s10456-009-9131-y. [DOI] [PubMed] [Google Scholar]
- 17.Smith JJ, Deane NG, Wu F, Merchant NB, Zhang B, Jiang A, Lu P, Johnson JC, Schmidt C, Bailey CE. Experimentally derived metastasis gene expression profile predicts recurrence and death in patients with colon cancer. Gastroenterology. 2010;138:958–968. doi: 10.1053/j.gastro.2009.11.005. [DOI] [PMC free article] [PubMed] [Google Scholar]
- 18.Pierre M, DeHertogh B, Gaigneaux A, DeMeulder B, Berger F, Bareke E, Michiels C, Depiereux E. Meta-analysis of archived DNA microarrays identifies genes regulated by hypoxia and involved in a metastatic phenotype in cancer cells. BMC Cancer. 2010;10:176. doi: 10.1186/1471-2407-10-176. [DOI] [PMC free article] [PubMed] [Google Scholar]
- 19.Bayer C, Vaupel P. Acute versus chronic hypoxia in tumors: controversial data concerning time frames and biological consequences. Strahlenther Onkol. 2012;188:616–627. doi: 10.1007/s00066-012-0085-4. [DOI] [PubMed] [Google Scholar]
- 20.Cairns RA, Kalliomaki T, Hill RP. Acute (cyclic) hypoxia enhances spontaneous metastasis of KHT murine tumors. Cancer Res. 2001;61:8903–8908. [PubMed] [Google Scholar]
- 21.Rofstad EK, Gaustad JV, Egeland TA, Mathiesen B, Galappathi K. Tumors exposed to acute cyclic hypoxic stress show enhanced angiogenesis, perfusion and metastatic dissemination. Int J Cancer. 2010;127:1535–1546. doi: 10.1002/ijc.25176. [DOI] [PubMed] [Google Scholar]
- 22.Takagi K, Tomita K, Fukushima Y, Chikamoto A, Kanou J, Honda T, Yoshimura H, Nozaki R, Tashiro K, Soma G. Endogenous TNF inducibility and prognosis of colorectal cancer. Anticancer Res. 1998;18:4141–4146. [PubMed] [Google Scholar]
- 23.Baudelet C, Cron GO, Ansiaux R, Crokart N, DeWever J, Feron O, Gallez B. The role of vessel maturation and vessel functionality in spontaneous fluctuations of T2*-weighted GRE signal within tumors. NMR Biomed. 2006;19:69–76. doi: 10.1002/nbm.1002. [DOI] [PubMed] [Google Scholar]
- 24.Martinive P, Defresne F, Quaghebeur E, Daneau G, Crokart N, Gregoire V, Gallez B, Dessy C, Feron O. Impact of cyclic hypoxia on HIF-1alpha regulation in endothelial cells—new insights for anti-tumor treatments. FEBS J. 2009;276:509–518. doi: 10.1111/j.1742-4658.2008.06798.x. [DOI] [PubMed] [Google Scholar]
- 25.Toffoli S, Feron O, Raes M, Michiels C. Intermittent hypoxia changes HIF-1alpha phosphorylation pattern in endothelial cells: unravelling of a new PKA-dependent regulation of HIF-1alpha. Biochim Biophys Acta. 2007;1773:1558–1571. doi: 10.1016/j.bbamcr.2007.06.002. [DOI] [PubMed] [Google Scholar]
- 26.Daneau G, Boidot R, Martinive P, Feron O. Identification of cyclooxygenase-2 as a major actor of the transcriptomic adaptation of endothelial and tumor cells to cyclic hypoxia: effect on angiogenesis and metastases. Clin Cancer Res. 2010;16:410–419. doi: 10.1158/1078-0432.CCR-09-0583. [DOI] [PubMed] [Google Scholar]
- 27.Polotsky VY, Savransky V, Bevans-Fonti S, Reinke C, Li J, Grigoryev DN, Shimoda LA. Intermittent and sustained hypoxia induce a similar gene expression profile in human aortic endothelial cells. Physiol Genomics. 2010;41:306–314. doi: 10.1152/physiolgenomics.00091.2009. [DOI] [PMC free article] [PubMed] [Google Scholar]
- 28.Ali MH, Schlidt SA, Chandel NS, Hynes KL, Schumacker PT, Gewertz BL. Endothelial permeability and IL-6 production during hypoxia: role of ROS in signal transduction. Am J Physiol. 1999;277:L1057–L1065. doi: 10.1152/ajplung.1999.277.5.L1057. [DOI] [PubMed] [Google Scholar]
- 29.Drabarek B, Dymkowska D, Szczepanowska J, Zablocki K. TNFalpha affects energy metabolism and stimulates biogenesis of mitochondria in EA.hy926 endothelial cells. Int J Biochem Cell Biol. 2012;44:1390–1397. doi: 10.1016/j.biocel.2012.05.022. [DOI] [PubMed] [Google Scholar]
- 30.Nelson G, Paraoan L, Spiller DG, Wilde GJ, Browne MA, Djali PK, Unitt JF, Sullivan E, Floettmann E, White MR. Multi-parameter analysis of the kinetics of NF-kappaB signalling and transcription in single living cells. J Cell Sci. 2002;115:1137–1148. doi: 10.1242/jcs.115.6.1137. [DOI] [PubMed] [Google Scholar]
- 31.Greenhough A, Smartt HJ, Moore AE, Roberts HR, Williams AC, Paraskeva C, Kaidi A. The COX-2/PGE2 pathway: key roles in the hallmarks of cancer and adaptation to the tumour microenvironment. Carcinogenesis. 2009;30:377–386. doi: 10.1093/carcin/bgp014. [DOI] [PubMed] [Google Scholar]
- 32.Choi I, Lee YS, Chung HK, Choi D, Ecoiffier T, Lee HN, Kim KE, Lee S, Park EK, Maeng YS. Interleukin-8 and its receptor CXCR2 in the tumour microenvironment promote colon cancer growth, progression and metastasis. Br J Cancer. 2012;106:1833–1841. doi: 10.1038/bjc.2012.177. [DOI] [PMC free article] [PubMed] [Google Scholar]
- 33.Knupfer H, Preiss R. Serum interleukin-6 levels in colorectal cancer patients–a summary of published results. Int J Color Dis. 2010;25:135–140. doi: 10.1007/s00384-009-0818-8. [DOI] [PubMed] [Google Scholar]
- 34.Vaupel P. Tumor microenvironmental physiology and its implications for radiation oncology. Semin Radiat Oncol. 2004;14:198–206. doi: 10.1016/j.semradonc.2004.04.008. [DOI] [PubMed] [Google Scholar]
- 35.Goethals L, Debucquoy A, Perneel C, Geboes K, Ectors N, De Schutter H, Penninckx F, McBride WH, Begg AC, Haustermans KM. Hypoxia in human colorectal adenocarcinoma: comparison between extrinsic and potential intrinsic hypoxia markers. Int J Radiat Oncol Biol Phys. 2006;65:246–254. doi: 10.1016/j.ijrobp.2006.01.007. [DOI] [PubMed] [Google Scholar]
- 36.Boidot R, Branders S, Helleputte T, Rubio LI, Dupont P, Feron O. A generic cycling hypoxia-derived prognostic gene signature: application to breast cancer profiling. Oncotarget. 2014;5:6947–6963. doi: 10.18632/oncotarget.2285. [DOI] [PMC free article] [PubMed] [Google Scholar]
- 37.Rofstad EK, Galappathi K, Mathiesen B, Ruud EB. Fluctuating and diffusion-limited hypoxia in hypoxia-induced metastasis. Clin Cancer Res. 2007;13:1971–1978. doi: 10.1158/1078-0432.CCR-06-1967. [DOI] [PubMed] [Google Scholar]
- 38.Franses JW, Edelman ER. The evolution of endothelial regulatory paradigms in cancer biology and vascular repair. Cancer Res. 2011;71:7339–7344. doi: 10.1158/0008-5472.CAN-11-1718. [DOI] [PMC free article] [PubMed] [Google Scholar]
- 39.Mocellin S, Rossi CR, Pilati P, Nitti D. Tumor necrosis factor, cancer and anticancer therapy. Cytokine Growth Factor Rev. 2005;16:35–53. doi: 10.1016/j.cytogfr.2004.11.001. [DOI] [PubMed] [Google Scholar]
- 40.Mantovani A, Allavena P, Sica A, Balkwill F. Cancer-related inflammation. Nature. 2008;454:436–444. doi: 10.1038/nature07205. [DOI] [PubMed] [Google Scholar]
- 41.Karin M. Nuclear factor-kappaB in cancer development and progression. Nature. 2006;441:431–436. doi: 10.1038/nature04870. [DOI] [PubMed] [Google Scholar]
- 42.Le Bitoux MA, Stamenkovic I. Tumor-host interactions: the role of inflammation. Histochem Cell Biol. 2008;130:1079–1090. doi: 10.1007/s00418-008-0527-3. [DOI] [PubMed] [Google Scholar]
- 43.Coussens LM, Werb Z. Inflammation and cancer. Nature. 2002;420:860–867. doi: 10.1038/nature01322. [DOI] [PMC free article] [PubMed] [Google Scholar]
- 44.Bertagnolli MM, Eagle CJ, Zauber AG, Redston M, Solomon SD, Kim K, Tang J, Rosenstein RB, Wittes J, Corle D. Celecoxib for the prevention of sporadic colorectal adenomas. N Engl J Med. 2006;355:873–884. doi: 10.1056/NEJMoa061355. [DOI] [PubMed] [Google Scholar]
- 45.Baay M, Brouwer A, Pauwels P, Peeters M, Lardon F. Tumor cells and tumor-associated macrophages: secreted proteins as potential targets for therapy. Clin Dev Immunol. 2011;2011:873–884. doi: 10.1155/2011/565187. [DOI] [PMC free article] [PubMed] [Google Scholar]
- 46.Jain RK. Normalizing tumor vasculature with anti-angiogenic therapy: a new paradigm for combination therapy. Nat Med. 2001;7:987–989. doi: 10.1038/nm0901-987. [DOI] [PubMed] [Google Scholar]
Associated Data
This section collects any data citations, data availability statements, or supplementary materials included in this article.
Supplementary Materials
(A–C) Cycling hypoxia increases TNFα-induced mRNA expression of genes encoding adhesion molecules, namely, ICAM-1, VCAM-1, and SELE, in HUVEC. Cells were exposed to N, chH, or cyH with or without TNFα (0.1 ng/ml) for 6 hours. (A) The relative abundance of ICAM-1 mRNA was evaluated after 4-hour reoxygenation (6h+4hR) by RTqPCR (n= 3, mean ± 1 SD). (B–C) The relative abundance of VCAM-1 (B) and SELE (C) mRNA was evaluated directly after the incubation (6h+0hR) by RT-qPCR (n= 3, mean ± 1 SD). (D) Endothelial cells exposed to chronic hypoxia evidence VEGF mRNA overexpression. EAhy926 cells (left) and HUVEC (right) were exposed to N, chH, or cyH with or without TNFα (0.1 ng/ml) for 6 hours. The relative abundance of VEGF mRNA was evaluated directly after the incubation (6h+0hR) by RT-qPCR (n= 3, mean ± 1 SD). (E) Cycling hypoxia increases PTGS2 mRNA expression induced by TNFα in HUVEC. Cells were exposed to N, chH, or cyH with or without TNFα (0.1 ng/ml) for 6 hours. The relative abundance of PTGS2 mRNA was evaluated after the incubation (6h+0hR) by RT-qPCR (n= 3, mean ± 1 SD).
Statistical analysis was performed by two-way ANOVA and Holm-Sidak test as post hoc test. * chH/cyH versus corresponding N, $ cyH versus corresponding chH, # TNFα versus corresponding control. *, $, #, P < .05; **, $$, ##, P < .01; ***, $$$, ###, P < .001.
HIF-1 is not involved in the increase in TNFα-induced IL-6 and IL-8 secretion when cells are exposed to cycling hypoxia or in the increase in TNFα-induced ICAM-1 mRNA expression. EAhy926 cells transfected or not (Ctl) with nontargeting siRNA (siNT) or HIF-1α siRNA (siHIF1α) were exposed to N, chH, or cyH with or without TNFα (0.1 ng/ml) for 6 hours. (A) Total abundance of HIF-1α was assessed by Western blotting to verify HIF-1α silencing. α-Tubulin was used as loading control. (B–C) Directly after the incubation, conditioned media were recovered for IL-6 or IL-8 secretion quantification by ELISA. (D) The relative abundance of ICAM-1 mRNA was evaluated by RT-qPCR. (B–D) Results are expressed as mean ± 1 SD (n= 3). Statistical analysis was performed by two-way ANOVA and Holm-Sidak as post hoc test. t test was used to compare siNT versus siHIF-1α in the same condition. * chH/cyH versus corresponding N, $ cyH versus corresponding chH, # TNFα versus corresponding control, • siHIF-1α versus siNT. *, $, #, •, P < .05; **, $$, ##, ••, P < .01; ***, $ $$, ###, •••, P < .001.
LLc tumor-bearing C57BL/6 mice were exposed to normal air (control), cycling hypoxia (cyH; 4h30) (three cycles of 1-hour hypoxia [7% O2 breathing] followed by 30-minute reoxygenation [21% O2]). Tumors were collected 16 hours later. The relative abundance of VEGF, VCAM-1, and SELE mRNA into tumors was evaluated by RT-qPCR (n= 3, mean ± 1 SEM). t test was performed as statistical analysis. **, P < .01 cyH versus control.
(A) Healthy and tumor biopsies from seven patients with colon cancer were collected and were used to evaluate carbonic anhydrase 9, VCAM-1, and SELE mRNA expression by RT-qPCR. ΔCt of tumor is compared to ΔCt of healthy tissue for each patient. Statistical analysis was performed by Wilcoxon test.
(B–C) Public Affymetrix array data of 176 colorectal cancer patients (GSE17536) for whom cancer specific survival time is known were reanalyzed. Patients were stratified into two subgroups for each presented graph according to the median value, and Kaplan-Meier plots were drawn. Graphs represent the probability of DSS along the time for patients with high expression (red) versus patients with low expression (black) of PTGS2, ICAM-1, IL-6, IL-8, and BIRC-5 genes. Gehan-Breslow-Wilcoxon test was used for statistical analysis. Hazard ratio (ratio of instant risk of death between groups) is also denoted.
Full-length Western blot analyses.
References of primary and secondary antibodies used for Western blot analyses