

Abstract
Succinate dehydrogenase gene (SDHx) mutations increase susceptibility to develop pheochromocytomas/paragangliomas (PHEOs/PGLs). In the present study, we evaluate the performance and clinical applications of 1H high-resolution magic angle spinning (HRMAS) nuclear magnetic resonance (NMR) spectroscopy–based global metabolomic profiling in a large series of PHEOs/PGLs of different genetic backgrounds. Eighty-seven PHEOs/PGLs (48 sporadic/23 SDHx/7 von Hippel-Lindau/5 REarranged during Transfection/3 neurofibromatosis type 1/1 hypoxia-inducible factor 2α), one SDHD variant of unknown significance, and two Carney triad (CTr)–related tumors were analyzed by HRMAS-NMR spectroscopy. Compared to sporadic, SDHx-related PHEOs/PGLs exhibit a specific metabolic signature characterized by increased levels of succinate (P < .0001), methionine (P = .002), glutamine (P = .002), and myoinositol (P < .0007) and decreased levels of glutamate (P < .0007), regardless of their location and catecholamine levels. Uniquely, ATP/ascorbate/glutathione was found to be associated with the secretory phenotype of PHEOs/PGLs, regardless of their genotype (P < .0007). The use of succinate as a single screening test retained excellent accuracy in distinguishing SDHx versus non–SDHx-related tumors (sensitivity/specificity: 100/100%). Moreover, the quantification of succinate could be considered a diagnostic alternative for assessing SDHx-related mutations of unknown pathogenicity. We were also able, for the first time, to uncover an SDH-like pattern in the two CTr-related PGLs. The present study demonstrates that HRMAS-NMR provides important information for SDHx-related PHEO/PGL characterization. Besides the high succinate–low glutamate hallmark, SDHx tumors also exhibit high values of methionine, a finding consistent with the hypermethylation pattern of these tumors. We also found important levels of glutamine, suggesting that glutamine metabolism might be involved in the pathogenesis of SDHx-related PHEOs/PGLs.
Abbreviations: GSH, glutathione; HRMAS, 1H high-resolution magic angle spinning; NMR, nuclear magnetic resonance; PGL, paraganglioma; PHEO, pheochromocytoma; SDH, succinate dehydrogenase
Introduction
Pheochromocytomas/paragangliomas (PHEOs/PGLs) are characterized by high genetic heterogeneity—more than 14 different well-studied genes have been linked to the development of these tumors. Current genetic testing identifies pathogenic mutations in one third or more of cases. Of all the known genetic mutations, deleterious mutations in any of the succinate dehydrogenase (SDH) genes (collectively named SDHx-associated tumors) are currently the leading genetic cause of head and neck PGLs and account for more than 30% of all hereditary cases. The four SDHx genes encode the four subunits of the SDH enzyme (also named mitochondrial complex II). This membrane complex catalyzes the oxidation of succinate to fumarate in the tricarboxylic acid (TCA) cycle and the respiratory chain. In SDHx mutation carriers, tumorigenesis requires a second hit process (biallelic inactivation) that invariably results in decreased SDH activity and/or a significant reduction or complete absence of its protein. For the index cases, genetic testing is often needed to implement personalized medical approaches [1]. A great benefit of genetic testing also comes from evaluating family members since they are potentially at risk of developing tumors, often multiple and metastatic ones.
Until present, the choice of which genes to be tested has been guided by clinical presentation and ex vivo biomarkers. Immunohistochemistry can be very well used to show the presence or absence of protein products [2], [3]. Metabolomics, or global metabolite profiling, which is a new technology of functional genomics, can be used for investigating metabolite changes associated with some gene mutations [4]. Currently, well-recognized tools for metabolomics are nuclear magnetic resonance (NMR) spectroscopy and gas chromatography–mass spectrometry (GC-MS) or liquid chromatography (LC)–MS. GC-MS and LC-MS are more widely represented in the technical platforms referred to as metabolomics, mainly due to their high sensitivity [5]. These technologies generate massive amounts of data that can be interpreted and used for building predictive models. For this purpose, machine-learning algorithms represent potent and useful instruments to reduce the complexity of the data analysis. Among NMR techniques, 1H high-resolution magic angle spinning (HRMAS) NMR spectroscopy technology is especially suited to analyze a small volume of intact tissue samples while avoiding any chemical extraction procedures or sample manipulation, which are necessary for both MS and liquid-state NMR or well-established immunohistochemistry. HRMAS NMR enables rapid (3-4 minutes for tissue sample preparation followed by 10 minutes of spectra acquisition) and reliable identification and quantification of several metabolites from spectra with excellent resolution and signal-to-noise ratio. Recently, metabolomics has proven to be a promising tool in the characterization PHEO/PGL [6], [7], [8], [9], [10].
The aim of the present study was to investigate the HRMAS NMR-based metabolomic profiling of PHEOs/PGLs to 1) confirm the accuracy of the previously described metabotype pattern based on four selected metabolites [i.e., succinate, glutamate, glutathione (GSH), and ATP] in the diagnosis of SDH-related PHEO/PGL in a large cohort of tumors with different genetic backgrounds, 2) define the global metabolomic profile of the SDH-related PHEOs/PGLs in comparison to sporadic tumors, and 3) identify metabolites that could be used as clinical predictors of SDH deficiency even in PHEOs/PGLs without any germline or somatic susceptibility gene mutations.
Materials and Methods
Patients and Tumors
Eighty-seven specimens of PHEOs and PGLs of sympathetic origin obtained from 79 unrelated patients were retrospectively selected in this study according to the following criteria:
-
1.
Histologic diagnosis of PGL/PHEO
-
2.
Genetic screening for germline mutations in the SDH subunits B/C/D (SDHB/C/D) (including large gene rearrangements of all the SDH genes), von Hippel-Lindau (VHL) (including large gene rearrangements), neurofibromatosis type 1 (NF1) (in the presence of clinical features), REarranged during Transfection (RET) (in the presence of hypercalcitoninemia), transmembrane-encoding gene TMEM127, and MYC-associated factor X genes
-
3.
Absence of systemic anticancer therapy before surgery
-
4.
Tissue specimens collected during surgery just after tumor removal and snap-frozen in liquid nitrogen before storage at − 80°C.
The tumors were obtained from three different institutions in France (Strasbourg, Marseille, and Nancy University Hospitals) and were distributed as follows: 48 sporadic (42 PHEOs, 6 sympathetic PGLs), 23 SDHx (5 PHEOs, 18 sympathetic PGLs), 7 VHL (5 PHEOs, 2 sympathetic PGLs), 5 RET (PHEOs), 3 NF1 (PHEOs), and 1 hypoxia-inducible factor 2α (EPAS1/HIF2A) (sympathetic PGL). The 23 samples of SDHx tumors were obtained from 23 distinct tumors belonging to 15 patients and were distributed as follows: 9 SDHB and 14 SDHD.
Data were acquired under regular clinical care conditions, with Ethics Committee approval obtained for the use of these data for scientific purposes. Written informed consent was obtained from all patients included in the present study.
HRMAS NMR Spectroscopy
HRMAS NMR spectra were recorded on a Bruker Avance III 500 spectrometer operating at a proton frequency of 500.13 MHz, installed at the Pathological Department of Strasbourg University Hospital. The amount of frozen tissue used for NMR analysis ranged from 15 to 20 mg. A one-dimensional (1D) proton spectrum using a Carr-Purcell-Meiboom-Gill (CPMG) pulse sequence with presaturation of the water signal was acquired for each sample. 1D HRMAS NMR spectra were bucketed into integral regions 0.01 ppm wide (ppm range, 1-8.65) using AMIX 3.8 software (Bruker GmbH, Rheinstetten, Germany) and exported into SIMCA P (version 11.0; Umetrics AB, Umeå, Sweden).
To confirm resonance assignments, two-dimensional (2D) heteronuclear (1H-13C) experiments were also recorded immediately after the end of 1D spectra acquisition. Because the duration of these experiments is long and tissue degradation occurs during NMR acquisition, only a few representative samples were analyzed by 2D experiments. Metabolites were assigned using standard metabolite chemical shift tables available in the literature [11], [12].
Metabolite quantification has been previously described [6]. Briefly, quantification was performed using an external reference standard of sodium lactate, scanned under the same analytical conditions. Spectra were normalized according to sample weight. Peaks of interest were automatically defined by an in-house program using MATLAB 7.0 (Mathworks, Natick, MA). Peak integration was then compared to the one obtained with the lactate reference and was corrected according to the number of protons. For our experiments, only peaks that were well resolved in 1D CPMG spectra were quantified. Quantification results were expressed as nmol/mg of tissue.
Statistical Analysis
A combination of principal component analysis (PCA) and orthogonal partial least square discriminant analysis (OPLS-DA) was herein adopted. The PCA was performed to evaluate the quality of the data and to identify possible outliers [13]. Then, the OPLS-DA was employed to optimize the separation between tumor subgroups. The following two-class models of OPLS-DA were built in this study:
-
1.
SDHx (n = 23) versus non-SDHx PHEOs/PGLs (n = 64) including sporadic, VHL, RET, NF1, and HIF2A tumors. This analysis was performed to confirm our previous results achieved in a smaller cohort of patients [7] and obtained from the analysis of spectral intervals corresponding exclusively to four selected metabolites with a possible key role in tumoral development. Accordingly, succinate, glutamate, GSH, and ATP were identified and used in the model. Succinate amount was estimated by integrating the area comprised between 2.39 and 2.43 ppm, glutamate quantity between 2.32 and 2.38 ppm, GSH amount between 2.93 and 2.98 ppm, and ATP amount within the range of 6.07 to 6.11 ppm.
-
2.
SDHx (n = 23) versus sporadic PHEOs/PGLs (n = 48). Seventy-one selected tumor samples were included in this model to assess the global metabolic fingerprint of SDHx-related PHEOs/PGLs in an exploratory and untargeted manner. Accordingly, the full spectrum that ranged from 1 to 8.65 ppm was analyzed and considered in the statistical model. In this case, the OPLS-DA was performed on the whole set of metabolites (variables) to select those with a real discriminating power. Metabolites corresponding to variable importance for projection (VIP) value ≥ 1 were selected and labeled VIP metabolites. Two measurements of model quality were reported for OPLS-DA: R2Y and Q2 representing, respectively, the goodness of fit (i.e., data variation) and the goodness of prediction, as estimated by cross-validation. Q2 ≥ 0.5 can be considered as a good predictor [14].
Cross-validation was used in each OPLS-DA model to determine the number of components and to avoid overfitting the data. A cross-validation embedded in a Monte Carlo resampling approach [15], [16] was used during the construction of the model to build a confusion matrix that allowed a direct visualization of the performances of the model in terms of classification power [sensitivity (Se), specificity (Sp), positive predictive value (PPV), negative predictive value (NPV), and global accuracy]. The SIMCA P (version 11.0; Umetrics AB) package was used for statistical data analysis.
Continuous variables are expressed as mean ± SD. Statistical analysis was performed using IBM SPSS Statistics version 20 (IBM SPSS Inc, Chicago, IL). The Spearman non-parametric test was performed to determine the correlation between metabolites. Comparisons of tumor metabolite concentrations between SDHx-related and sporadic tumors were performed using a Mann-Whitney U test. The receiver operating characteristic (ROC) curves were used to evaluate the clinical utility of metabolite quantification in the diagnosis of SDHx mutation. Areas under the ROC curve, sensitivity, and specificity were determined using MedCalc version 13.2.2 (MedCalc Software, Ostend, Belgium). According to the ROC curve, values exhibiting the best accuracies were chosen as the threshold for a screening test. Linear regression model was used to examine the association between metabolite levels and genetic status with adjustment for tumor location and total catecholamine levels as explanatory variables. For multiple testings, adjusted P values were calculated using the false discovery rate (FDR) procedure with the SAS PROC MULTTEST statement [17]. PCA was performed to visualize and analyze correlations between metabolite concentrations and SDHx status. PCA was done using the package FactoMiner (Multivariate Exploratory Data Analysis and Data Mining with R). Values of P < .05 were considered to be statistically significant.
Network Analysis
The Algorithm to Determine Expected Metabolite Level Alterations Using Mutual Information (ADEMA) has been applied [18]. Instead of analyzing metabolites one by one, the algorithm assesses the changes in groups of metabolites, between the case and the control. It incorporates the metabolic network topology to determine the groups of metabolites. ADEMA uses mutual information to 1) find out if those metabolites are biomarkers when considered together and 2) predict the expected direction of change per metabolite, when metabolic network topology is considered.
Figure 2 shows the simplified metabolic subnetwork we have used to relate metabolites. The network was constructed using Kyoto Encyclopedia of Genes and Genomes (KEGG) [19], [20] and the work of Selway et al. [21] On the basis of the network, the following metabolite groups were obtained:
-
•
aspartate, succinate, glutamate, glutamine, ATP
-
•
methionine, myoinositol, ascorbate, noradrenaline, adrenaline, ATP
-
•
myoinositol, ascorbate, methionine, taurine, ATP
-
•
noradrenaline, adrenaline, total catecholamines, ATP
-
•
myoinositol, ascorbate, noradrenaline, adrenaline, total catecholamines, ATP.
Figure 2.
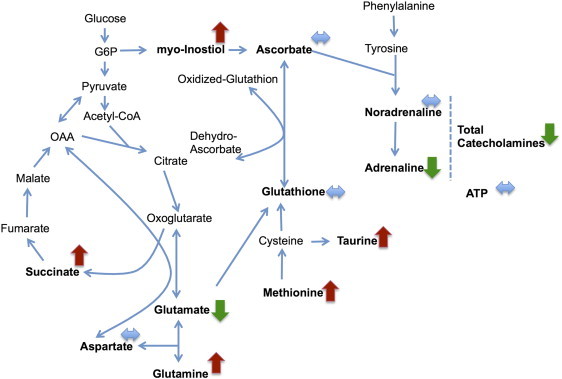
Metabolic subnetwork showing the results of the ADEMA analysis that compares SDHx (n = 23) versus sporadic PHEOs/PGLs (n = 64). Red arrows show metabolites that are predicted to increase, green arrows show metabolites that are predicted to decrease, and blue arrows show metabolites that are expected to stay the same, between two groups, respectively.
For discretization of metabolite observations, we have set number of levels (M) as 6 and number possible levels an observation assigned to (k) as 4. Missing metabolite observations were amputated using the average measurement value for that metabolite. Using the abovementioned metabolite groups and parameters, an expected metabolite level for case and for control is obtained per metabolite. The direction of the expected change is obtained by comparing expected levels (e.g., SDHx vs sporadic PHEOs/PGLs).
Results
SDHx versus Non-SDHx PHEOs/PGLs
At visual inspection, all the spectra obtained from the 87 analyzed tumor samples were of good quality without any prominent hallmarks of tissue necrosis or cystic components. The generated multivariate one-component OPLS-DA based on succinate, glutamate, GSH, and ATP allowed a clear separation of SDHx from non-SDHx PHEOs/PGLs showing accurate representation of the data and a good cumulative confidence criterion of fit (R2Y = 0.65) and prediction (Q2 = 0.64). These results are graphically represented in Figure 1.
Figure 1.
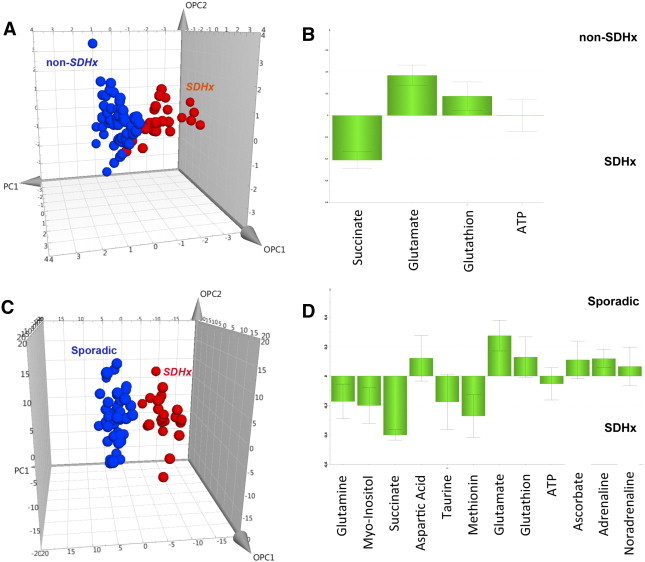
Results of three-component OPLS-DA models and the corresponding loading plots according to the patient’s genotypes: (A and B) SDHx (n = 23) versus non-SDHx PHEOs/PGLs (n = 64), including sporadic, VHL, RET, NF1, and HIF2 tumors, and based on succinate, glutamate, GSH, and ATP; (C and D) SDHx (n = 23) versus sporadic PHEOs/PGLs (n = 48) and based on the whole tumoral metabolome. For this OPLS-DA model, the loading plot represents only the 12 metabolites with the higher discriminant power (VIP metabolites). A clear distinction between the different classes of tumors is shown in both models.
Nineteen of 23 patients with SDHx-related PHEOs/PGLs were correctly identified. Moreover, all 64 patients with non–SDHx-related PHEOs/PGLs were accurately classified. To detect patients with SDHx germline mutations, the Se and Sp of the established model were 83% and 100%, respectively. PPV, NPV, and global accuracy were 100%, 94%, and 95%, respectively.
No significant spectrum overlap that prevented quantification of succinate, glutamate, GSH, and ATP was found. All NMR spectra from the SDHx-related PHEOs/PGLs showed significantly high levels of succinate (4.01 ± 2.45 nmol/mg vs 0.06 ± 0.06 nmol/mg, P < .00001) and lower concentration of glutamate (0.70 ± 0.41 nmol/mg vs 1.60 ± 0.76 nmol/mg, P < .00001) compared to those of sporadic tumors and PHEOs/PGLs related to VHL, RET, NF1, and HIF2 mutations. Neither GSH nor ATP amount was significantly different between the SDHx- and non–SDHx-related PHEOs/PGLs (Figure 1). Interestingly, the four SDHx-related tumor samples, which were incorrectly classified by the previous OPLS-DA model, showed significantly lower amounts of succinate (P = .003) and higher concentrations of glutamate (P = .003) than the remaining 19 SDHx-related PHEOs/PGLs [7].
SDHx versus Sporadic PHEOs/PGLs
Twenty-three SDHx-related PHEOs/PGLs and 48 sporadic tumors were included in the analysis. A total of 24 metabolites was recognized from the spectra obtained from all 71 tumor samples within the range of 1 to 8.65 ppm (Supplementary Table 1). Besides peaks due to small water-soluble molecules, the acquired spectra display consistent broad resonances, which were attributed to three different fatty acid moieties defined as a, b, and c [22]. A two-component OPLS-DA showed a very clear separation of the two sets of samples, a faithful representation of the Y data (R2Y = 0.82) and a good cumulative confidence criterion of prediction (Q2 = 0.7). These results are graphically represented in Figure 1. When comparing sporadic to SDHx-related tumors, the OPLS-DA model accurately classified all samples. Examples of 1D HRMAS CPMG spectra obtained from sporadic and SDHD-related PGL are represented in Supplementary Figure 2.
According to the results of the OPLS-DA model, 12 VIP metabolites were identified. A higher level of succinate, myoinositol, methionine, glutamine, taurine, and ATP characterized SDHx-related PHEOs/PGLs, while sporadic tumors contained a larger amount of adrenaline, noradrenaline, glutamate, GSH, ascorbate, and aspartic acid (Figure 1). The quantity of the 12 metabolites previously listed was assessed and used for tumor comparison according to the genetic background. When compared to sporadic phenotypes, the metabolomic profile of SDHx-related tumors exhibits statistical significance in the following areas:
-
1.
Increased levels of succinate (4.01 ± 2.45 nmol/mg vs 0.06 ± 0.06 nmol/mg, P < .0001), taurine (2.59 ± 1.35 nmol/mg vs 1.66 ± 1.43 nmol/mg, P = .002), methionine (0.09 ± 0.04 nmol/mg vs 0.04 ± 0.04 nmol/mg, P < .0001), glutamine (0.37 ± 0.24 nmol/mg vs 0.23 ± 0.16 nmol/mg, P = .12), and myoinositol (3.18 ± 1.43 nmol/mg vs 1.87 ± 1.49 nmol/mg, P < .0001).
-
2.
Decreased levels of aspartate (0.32 ± 0.50 nmol/mg vs 0.50 ± 0.27 nmol/mg, P < .0001), glutamate (0.71 ± 0.41 nmol/mg vs 1.64 ± 0.78 nmol/mg, P < .0001), and adrenaline (0.10 ± 0.43 nmol/mg vs 1.17 ± 2.18, P < .001) (Supplementary Tables 2 and 3).
In spite of GSH, ATP, catecholamines, and ascorbate playing a role in tumor classification in the OPLS-DA model, their amounts were not statistically different between SDHx-related PHEOs/PGLs and sporadic tumors when compared using a standard non-parametric univariate test.
Interestingly, after adjustment for tumors, total catecholamine content, and tumor location (adrenal and extra-adrenal), succinate (P < .0001), methionine (P = .002), glutamate (P < .0007), glutamine (P = .002), and myoinositol (P < .0007) remained statistically different between the two groups (Supplementary Table 3). Correlations between variables are represented in Supplementary Table 4. The importance of the different metabolites regarding their correlations with the mutation status is illustrated in Supplementary Figures (Supplementary Figure 1).
When the data are analyzed using ADEMA, using the metabolic subnetwork depicted in Figure 2, the following results were obtained. ADEMA has predicted a higher level of succinate, myoinositol, methionine, glutamine, and taurine in SDHx-related PHEOs/PGLs, while sporadic tumors contained a higher amount of adrenaline, glutamate, GSH, and total catecholamines (Figure 2). ATP, noradrenaline, ascorbate, GSH, and aspartate are predicted to be equivalent among cases and controls. Results show that network and mutual information-based analysis is in accordance with the statistical significance of changes shown above (Supplementary Table 3), with the exception of aspartate. Aspartate is predicted to be same in both groups by ADEMA.
Quantification of Succinate Concentration as a Screening Method for SDH Mutation
The use of succinate as a single screening test showed higher accuracy when compared to other metabolites and a combination of metabolites for distinguishing SDHx versus non–SDHx-related tumors (including sporadic, VHL, MEN2, and HIF2A tumors; Figure 3 and Table 1) and SDHx-related tumors versus sporadic ones (Figure 3 and Table 1). As shown in Figure 4, tumors with high succinate levels had a high probability of belonging to an SDHx patient. The optimal succinate cutoff was 0.253 nmol/mg for distinguishing SDHx versus any non-SDHx tumors and 0.096 nmol/mg to discriminate between SDHx and sporadic tumors. With these threshold points, Se and Sp were 100% in both situations. Interestingly, the four SDHx-related PHEOs/PGLs that were incorrectly classified by the OPLS-DA model built on the whole studied population showed a succinate value higher than the diagnostic threshold established by ROC curve analysis, leading to correct tumor identification. To discriminate SDHx-related from sporadic PHEOs/PGLs, ROC curves were also built using the quantitative values of glutamate, methionine, myoinositol, and methionine/glutamate ratio. However, the diagnostic accuracy obtained for each single metabolite was lower than the accuracy achieved by succinate as a single tumor biomarker. The cutoff of 0.742 nmol/mg for glutamate, 0.045 nmol/mg for methionine, and 2.383 nmol/mg for myoinositol provided suboptimal values of Se and Sp in both cases (Se = 86.9% and Sp = 89.5% for glutamate; Se = 95.6% and Sp = 62.5% for methionine; and Se = 73.9% and Sp = 81.2% for myoinositol). Finally, considering 0.0524 nmol/mg as the diagnostic threshold for methionine/glutamate ratio, Se and Sp were 91.3% and 89.6%, respectively (Figure 3 and Table 1).
Figure 3.
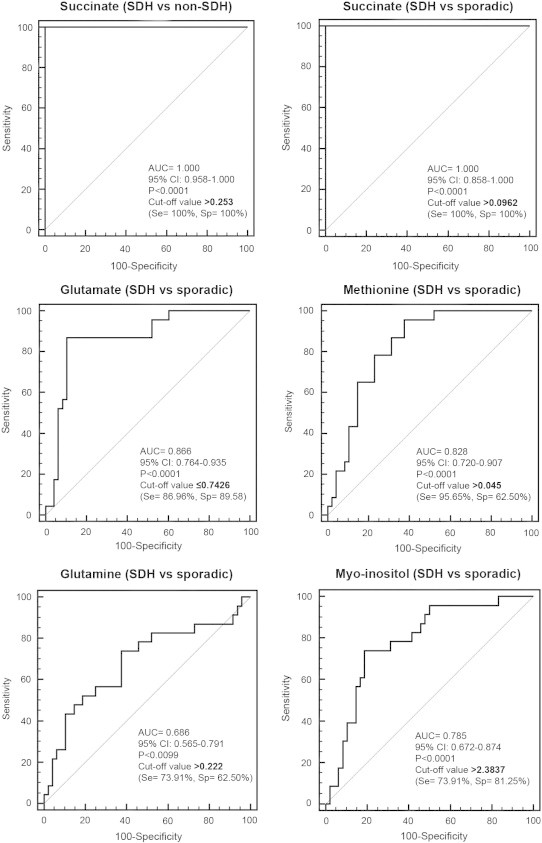
ROC curves obtained from analysis of the succinate, glutamate, methionine, glutamine, and myoinositol concentrations for the diagnosis of SDHx mutation. Detailed information about the area under the ROC curve, the cutoff values, sensitivity, and specificity are shown.
Table 1.
Performances of Succinate, Methionine, and Glutamate Concentrations in the Diagnosis of SDHx Mutation
| Se (95% CI) | Sp | PPV | NPV | Accuracy | |
|---|---|---|---|---|---|
| Succinate > 0.253 (SDHx vs non-SDHx) | 100% (85.2-100) | 100% (94.4-100) | 100% (85.2-100) | 100% (94.4-100) | 100% (95.8-100) |
| Succinate > 0.0962 (SDHx vs sporadic) | 100% (81.5-100) | 100% (54.1-100%) | 100% (81.5-100) | 100% (54.1-100) | 100% (86.2-100) |
| Glutamate ≤ 0.7426 (SDHx vs sporadic) | 86.9% (66.4-97.2) | 89.6% (77.3-96.5) | 80.0% (60.9-91.1) | 93.5 (82.5-97.8) | 88.7 (79.3-91.2) |
| Methionine > 0.045 (SDHx vs sporadic) | 95.7% (78.1-99.9) | 62.5% (47.4-76.1) | 55% (38.5-70.7) | 96.8% (83.3-99.9) | 73.2% (61.9-82.2) |
| Glutamine > 0.222 (SDHx vs sporadic) | 73.9% (51.6-89.9) | 62.5% (48.4-74.8) | 48.6% (32.9-64.4) | 83.3% (68.1-92.1) | 66.2% (54.6-76.1) |
| Myoinositol > 2.3837 (SDHx vs sporadic) | 73.9% (51.6-89.8) | 81.3% (68.1-89.9) | 65.4% (46.2-80.6) | 86.7% (73.8-93.7) | 78.9% (68.0-86.8) |
| Methionine/glutamate > 0.0524 (SDHx vs sporadic) | 91.3% (72.0-98.9) | 89.6% (77.3-96.5 | 80.8% (62.1-91.5) | 95.6% (85.2-98.8) | 90.1% (81.0-95.1) |
CI, confidence interval.
Figure 4.
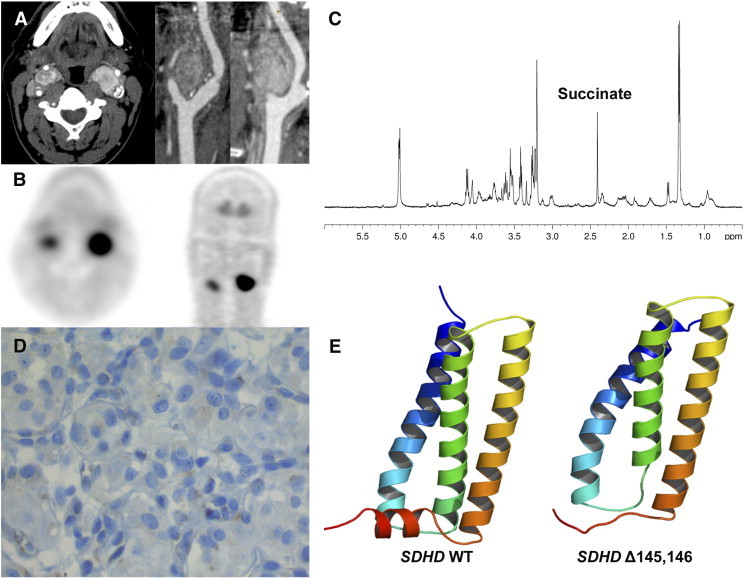
HRMAS NMR spectra from a tumor with SDHD mutation of unknown pathogenicity. Contrast-enhanced CT (A) and 18F-fluorodihydroxyphenylalanine PET/CT (B) showing a CBPGL. Succinate peak on 1D HRMAS CPMG spectrum NMR spectroscopy (C). Absence of significant SDHB immunostaining on tumor cells (D). Cartoon representation of the 3D models of Wild Type (WT) (E, left) and deleted mutant (E, right) of human SDHD. The structures are rendered using a gradient color from blue to red, at the N terminus and C terminus of the protein, respectively. The Δ145,146 deletion occurs in a small loop between H3 (yellow orange) and H4 (reddish) helices and induces a possible destructuration of C-terminal helix H4. In WT SDHD, this alpha-helix interacts with alpha-helix H3 of subunit C and corresponds to the second binding site of ubiquinone. Models were generated with Modeller v9.13 using the crystal structure of porcine mitochondrial SDH as a template (PDB code 1ZP0). Panel E was generated with PyMOL program (www.pymol.org).
Quantification of Succinate Concentration as a Functional Test for Evaluating SDHx Mutation of Unknown Pathogenicity
We report the case of a 55-year-old male who was evaluated for bilateral carotid body PGLs (CBPGLs). At the initial examination, there was no family history of any PGL. Plasma/urinary metanephrines and serum chromogranin A were normal. Both PGLs were visualized by computed tomography (CT) and 18F-fluorodihydroxyphenylalanine positron emission tomography/CT (Figure 4, A and B). Genetic testing revealed a deletion of six nucleotides in exon 4 of the SDHD gene (c.433_438del), resulting in a deletion of two amino acids (p.His145_Asp146del, Δ145,146). This allelic variant, never reported in the literature, was classified as of unknown significance according to in silico analysis. Both CBPGLs were removed and histopathology confirmed the diagnosis. Investigating the pathogenicity of this mutation, HRMAS NMR spectroscopy of an intact tissue sample showed an increased succinate concentration (0.378 nmol/mg) consistent with an SDH dysfunction (Figure 4C). Furthermore, SDHB immunohistochemistry (Figure 4D) and homology modeling with MODELLER (Figure 4E) further supported the pathogenicity of this mutation. After the diagnosis, the patient’s sister was found to have bilateral PHEOs and HNPGLs, further supporting the diagnosis of a hereditary PGL in these family members.
Quantification of Succinate Concentration in a Case of Carney Triad
We report HRMAS NMR spectroscopy findings in two extra-adrenal PGLs obtained from a single Carney triad (CTr) patient. The clinical case was previously reported [23]. Briefly, the diagnosis of CT was based on the following criteria: young female patient (18 years at diagnosis), no family history, two extra-adrenal PGLs of sympathetic origin (one thoracic and one abdominal), multiple gastric Gastrointestinal Stromal Tumor (GIST), and an absence of mutations in any of the SDH genes (including large deletions). HRMAS NMR spectra obtained from the analysis of both PGLs are represented in Figure 5 and are uniquely consistent with an SDH mutation–like pattern, showing an important succinate peak corresponding to a succinate amount of 1.91 and 4.63 nmol/mg, respectively.
Figure 5.
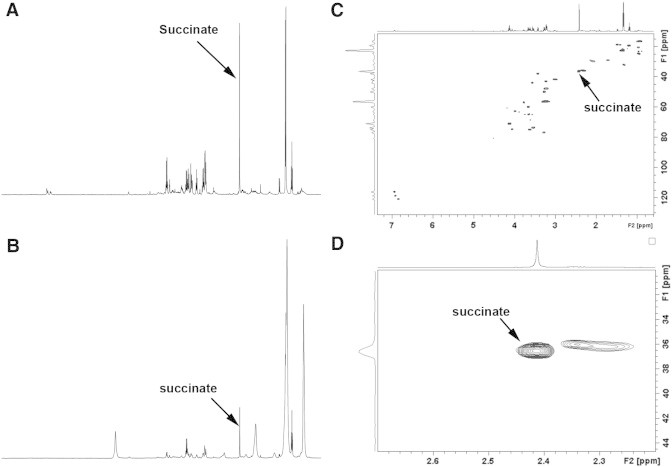
1D and 2D HRMAS NMR spectra obtained from the analysis of Carney triad–related thoracic and abdominal PGLs developed in a single patient. The metabolic content in 1D spectra (A, B) can be directly compared since the intensity of each spectrum was normalized with respect to the weight of each examined sample. The two Carney triad–related tumors show an obvious peak of succinate-like SDHx-related PGL phenotype, suggesting a dysfunction of the SDH complex in both cases. The increase of lactate and fatty acids, which is pronounced in Carney triad–related PGLs, suggests necrotic involution of tumor, probably associated with a prolonged time of ischemia after surgery and is independent from succinate accumulation. 2D spectra (C) with zoom on the succinate region (D) were obtained from the thoracic PGL and confirm the important accumulation of succinate in tumoral tissue. Succinate assignment is indicated.
Discussion
The present study shows that HRMAS NMR spectroscopy is a very reliable method for classifying various PHEOs/PGLs according to their genetic background [7]. Such a metabolomics-based approach allows for the detection of metabolic changes (biomarkers) that are specifically related to a medical condition (e.g., SDHx-related mutation), resulting in diagnostic and potential prognostic implications. In our study, HRMAS NMR spectroscopy allowed for the exploratory investigation of the global metabolic phenotype of SDHx-related PHEOs/PGLs, leading to the identification of several specific biochemical alterations.
First, we described the whole metabolome findings of SDHx-related PHEOs/PGLs and found that several metabolites do not belong to the Krebs cycle, such as methionine/taurine, glutamate/aspartate, and myoinositol.
Moreover, we found that the assessment of succinate concentration can be clinically relevant as a single metabolic biomarker for discriminating SDHx-related tumors from sporadic and other hereditary PHEOs/PGLs. Thus, HRMAS NMR spectroscopy could be used as a reliable screening method for the indication of whether sequencing of one of the SDH genes should be initiated. Furthermore, the present study also documents that SDHx mutations with unknown pathogenicity could be reclassified by this approach. Finally, in PHEOs/PGLs where a genetic abnormality is highly expected, although leading to the disappearance of SDH protein (e.g., patients with Carney triad), HRMAS NMR spectroscopy can nicely point to such a protein abnormality and could lead to a narrow search for specific genes of this and other cancers.
The role of MS in the diagnosis of SDHx-related tumors and for functional analysis of SDH variants has been recently reported in a large population of patients [9]. Although MS is characterized by a superb sensitivity, it also has some disadvantages. The chemical extraction procedure before tissue sample examination represents a crucial question. Perchloric acid extraction should be avoided because of significant changes in the real metabolic profile. Moreover, LC-MS is neither as reproducible nor resolvable as GC and it is perhaps the slowest (1 to 2 days per sample) of all three methods, including GC-MS and NMR spectroscopy. Finally, LC-MS is not really quantitative and is often designed to simply detect the presence or absence of a molecule rather than to assess its concentration [24]. Furthermore, immunohistochemistry (IHC) for SDH tumors, although currently very popular and reliable, first requires sample processing and, second, an experienced technician and pathologist to minimize false-positive or false-negative interpretations. Moreover, this technique provides a limited view of a tumor’s biology, usually assessing only one protein at a time and in a semiquantitative manner. In contrast, HRMAS NMR allows for rapid and reproducible quantification of several metabolites (proteins) from only 15 mg of intact tissue, requiring only about 1 hour to prepare the tissue sample, collect data, and analyze the results. Nevertheless, similar to other approaches, experienced staff are required to interpret results. However, compared to other methods mentioned above, HRMAS NMR spectroscopy provides new insights into the understanding of tumor biology by simultaneously identifying metabolites from fresh tissue associated with unique cancer metabolome and behavior, including SDHx mutations.
In the present study, except for well-known changes in tumor succinate levels, high methionine and low glutamate/aspartate were found to be associated with SDHx deficiency. Recently, it has been shown that SDHx-related tumors exhibited a hypermethylated phenotype [25]. Thus, a high methionine metabotype is consistent with a hypermethylation pattern. In the methionine cycle, methionine is converted to S-adenosyl methionine, which is a methyl donor for numerous reactions of methylation, including DNA. The mechanisms involved in the reduction of glutamate/aspartate in SDHx-mutated tumors are largely unknown and might be related to an inhibition of the membrane transport of these amino acids or a decrease in their synthesis due to a TCA defect. It has been shown that the rat PC12 PHEO cell line expresses different glutamate transporters, including the glutamate aspartate transporter. DNA methylation has also been shown as a potential mechanism for silencing the human glutamate transporter [26]. Evaluation of the expression of glutamate aspartate transporter and other glutamate transporters in SDHx-related PGL in comparison to sporadic cases would be of particular interest. We also found an increase of glutamine levels in SDHx-related tumors. The microarray study showed a significantly higher concentration of glutamine transporter SLC3A2 mRNA. We suggest that glutamine metabolism is involved in the pathogenesis of SDHx-related PHEOs/PGLs [27].
Glutaminolysis is an anaplerotic pathway of the TCA cycle and supports the production of antioxidant molecules [28], [29], [30]. Myoinositol was found to be associated with SDH status and catecholamine levels. Myoinositol is a six-carbon alcohol easily detected in HRMAS NMR spectra. Therefore, it could be potentially used as a biomarker. The relationship between SDH and myoinositol is largely unknown, but it is possible that SDHx-related tumors participate in the activation of myoinositol signaling pathways.
When compared to sporadic phenotypes, the metabolomic profile of SDHx-related tumors exhibits decreased levels of adrenaline. SDHx-related tumors have been previously found to be associated with lower catecholamine content.
ATP, ascorbate, and GSH were found to be associated with the secretory phenotype. This secretory machinery, which includes neurotransmitter uptake and storage in vesicles and exocytosis, requires ATP—a finding that has been found on NMR spectra. A high rate of glucose uptake might be necessary to fulfill this high ATP demand. Interestingly, ATP production is not impaired in the presence of SDH deficiency. It is therefore possible that TCA remains partially functional and enables, together with glycolysis, the production of NADH. The electrons, born on NAD1 (nicotinamide-adenine dinucleotide), are transferred to respiratory complex I (NADH dehydrogenase) and then to coenzyme Q10. From coenzyme Q10, the electrons are passed to complex III. Therefore, ATP production remains possible through the electron transport chain (ETC) despite inactivation of complex II of the respiratory chain.
PHEOs/PGLs may also highly accumulate ascorbate since human cells do not synthesize it. Ascorbate accumulation in cells can occur through two different mechanisms. The sodium-dependent vitamin C transporters can transport ascorbate in a sodium-dependent fashion. In adrenal tissues, only sodium-dependent vitamin C transporter 2 is present [31]. The other possibility is that dehydroascorbic acid (DHA) can be accumulated through various glucose transporters (GLUT1, for example). DHA undergoes rapid reduction in the intracellular environment (through GSH, thioredoxin, or other NADPH-dependent processes), leading to ascorbate accumulation. However, significant oxidation of ascorbate in the extracellular environment would need to be present to generate the DHA necessary to explain the high intracellular ascorbate levels found in the tumors. It is unclear whether there is a direct explanation for the high ascorbate levels in some tumors. In the present study, we found that ascorbate was correlated with total catecholamine concentrations. This finding could be explained by the role of ascorbate as a cofactor in the conversion of dopamine to norepinephrine. Oxygen is also a co-factor in that reaction, consistent with the idea that the tumors are not hypoxic.
GSH is the most abundant endogenous antioxidant protein and therefore plays a critical role in the regulation of oxidative stress. We have found GSH to be correlated with total catecholamine levels. o-Quinones are physiological oxidation products of catecholamines that contribute to redox cycling, toxicity, and apoptosis. Therefore, GSH conjugation of these oxidized metabolites (o-quinones) through GSH transferases is a detoxification reaction that prevents redox cycling, thus indicating that GSH and GSH transferases have a cytoprotective role involving elimination of reactive chemical species originating from the oxidative metabolism of catecholamines [32].
When we have analyzed our observations using a mutual information and metabolic network–based analysis, called ADEMA, we have seen that the algorithm has predicted changes that are in accordance with the hypotheses given above. This shows that the results are also robust with respect to the dependencies within the topology of the metabolic network.
Metabolomics may also illustrate the SDH dysfunction that may occur in the absence of an SDH mutation. This is the case for Carney triad. Carney triad, originally described by J. Aidan Carney in 1977, associates tumors in at least two of the five following organs in the same patient: stomach (gastric gastrointestinal stromal tumor), lungs (pulmonary chondroma), paraganglionic system (extra-adrenal PGL), adrenal cortex (adenoma), and esophagus (leiomyoma) [33]. At present, a specific genetic mutation has not been discovered with CT; however, very few patients were found to have SDHx genetic mutations. Recently, DNA methylation at the gene locus of the SDHC has been found in CT-related tumors, leading to loss of the SDHC protein [34]. In the present study, we found that Carney triad was associated with SDH deficiency. Therefore, in the presence of high succinate/no SDHx mutation, the possible diagnosis of CT should be raised and patients should undergo screening for other CT-related tumors, especially gastric gastrointestinal stromal tumor that may affect long-term survival in CT patients.
Conclusions
The present study, which includes a large number of PHEOs/PGLs, shows that HRMAS NMR spectroscopy provides unique and accurate information in the metabolomic classification of these tumors. Furthermore, this approach also advances our knowledge of the pathogenesis of PHEOs/PGLs. It is also expected that many of these metabolomic approaches, along with the latest improvements, will reveal new targets for future therapeutic options. Recent introduction of cryogenic probes has already improved spectral signal-to-noise ratios by up to a factor of five, reducing the gap between HRMAS NMR and MS [35]. In comparison to 1D 1H-NMR spectroscopy, 2D techniques based on proton scalar coupling are further improving both detection sensitivity and metabolite identification, especially when specific metabolite-related picks are overlapped in 1D NMR acquisitions. Moreover, it is nowadays possible to quantify metabolites on 2D spectra [36]. However, the large centrifugal forces applied to the biologic sample during several hours of 2D NMR acquisition have a direct consequence on tissue integrity, which could potentially influence results [37].
The present study well justifies that, in the near future, functional genomics will allow for and perfect the identification of tumor-specific metabolic biomarkers as well as their genetics. It is expected that cancer metabolomes will be quickly implemented in new diagnostic and treatment options of various cancers as well as their prognosis.
The following are the supplementary data related to this article.
Supplementary Table 1. 1H NMR Resonance Assignments of the Metabolites Identified from the Examined Samples of SDHx-Related and Sporadic PHEOs/PGLs
Supplementary Table 2. Metabolite Differences between Tumor Types (Univariate Analysis). P, Difference in Ranks (Mann-Whitney Test). P*, Adjusted P according to the FDR Procedure
Supplementary Table 3. Metabolite Differences between Tumor Types Adjusted for the Values of Total Catecholamines and Tumor Location (Multiple Linear Regression Coefficients)
Supplementary Table 4. Correlation between Metabolites. Rho, Correlation Coefficient. P*, Adjusted P according to the FDR Procedure.
Importance of the different metabolites regarding their correlations with the SDHx mutation status illustrated by PCA. In the circle of correlations, the closer a vector is to the circle of correlation, the better the correlation with the principal component (mutation status). The angles between vectors reflect their degree of correlation. Two vectors that are diametrically opposed are negatively correlated.
Representative 1D 1H-HRMAS spectra of SDHD-related and sporadic PGLs. Only the metabolites with the higher discriminant power (VIP metabolites) are indicated. The metabolic content of both spectra is directly comparable, since the intensity of each spectrum has been normalized with respect to the weight of the analyzed sample. Examples of 1D HRMAS CPMG spectra obtained from sporadic and SDHD-related PGLs.
Acknowledgements
The laboratory personnel of the Tumor Bio-Bank (Centre de Ressources Biologiques) of the Strasbourg University Hospital are gratefully acknowledged for their technical assistance.
Footnotes
This article refers to supplementary materials, which are designated by Supplementary Tables 1 to 4 and Supplementary Figures 1 and 2 and are available online at www.neoplasia.com.
This work is part of the CARMeN project and was supported by grants from Région Alsace, Oséo, Communauté Urbaine de Strasbourg, Conseil Départemental du Bas-Rhin, Bruker BioSpin, University of Strasbourg, and Strasbourg University Hospital. Competing interests: The authors have declared no competing interests. Author contributions: A.I.—writer, study design, spectra and data analysis, bibliographic research, and manuscript review; F.-M.M.—HRMAS-NMR data acquisition, spectra analysis and metabolites quantification; P.R.—modeling, data analysis; S.B.—statistical analysis; A.E.C.—network analysis; F.S.—patient surgical management; L.B.—patient surgical management; A.B.—molecular biology analysis, data analysis; K.E.—spectra analysis and metabolites quantification; A.L.—statistical analysis, data analysis; P.B.—patient surgical management; B.G.—patient clinical management, data analysis; C.S.—writer, manuscript review; K.P.—writer, data analysis, manuscript review; I.-J.N.—experimental design, data analysis, manuscript review. D.T.—writer, study design, data analysis, bibliographic research, and manuscript review. All authors have read and approved the final manuscript.
References
- 1.Taïeb D, Kaliski A, Boedeker CC, Martucci V, Fojo T, Adler JR, Jr., Pacak K. Current approaches and recent developments in the management of head and neck paragangliomas. Endocr Rev. 2014 doi: 10.1210/er.2014-1026. [DOI] [PMC free article] [PubMed] [Google Scholar]
- 2.van Nederveen FH, Gaal J, Favier J, Korpershoek E, Oldenburg RA, de Bruyn EM, Sleddens HF, Derkx P, Riviere J, Dannenberg H. An immunohistochemical procedure to detect patients with paraganglioma and phaeochromocytoma with germline SDHB, SDHC, or SDHD gene mutations: a retrospective and prospective analysis. Lancet Oncol. 2009;10:764–771. doi: 10.1016/S1470-2045(09)70164-0. [DOI] [PMC free article] [PubMed] [Google Scholar]
- 3.Korpershoek E, Favier J, Gaal J, Burnichon N, van Gessel B, Oudijk L, Badoual C, Gadessaud N, Venisse A, Bayley JP. SDHA immunohistochemistry detects germline SDHA gene mutations in apparently sporadic paragangliomas and pheochromocytomas. J Clin Endocrinol Metab. 2011;96:E1472–E1476. doi: 10.1210/jc.2011-1043. [DOI] [PubMed] [Google Scholar]
- 4.Reitman ZJ, Jin G, Karoly ED, Spasojevic I, Yang J, Kinzler KW, He Y, Bigner DD, Vogelstein B, Yan H. Profiling the effects of isocitrate dehydrogenase 1 and 2 mutations on the cellular metabolome. Proc Natl Acad Sci U S A. 2011;108:3270–3275. doi: 10.1073/pnas.1019393108. [DOI] [PMC free article] [PubMed] [Google Scholar]
- 5.Griffin JL. Metabonomics: NMR spectroscopy and pattern recognition analysis of body fluids and tissues for characterisation of xenobiotic toxicity and disease diagnosis. Curr Opin Chem Biol. 2003;7:648–654. doi: 10.1016/j.cbpa.2003.08.008. [DOI] [PubMed] [Google Scholar]
- 6.Imperiale A, Elbayed K, Moussallieh FM, Reix N, Piotto M, Bellocq JP, Goichot B, Bachellier P, Namer IJ. Metabolomic profile of the adrenal gland: from physiology to pathological conditions. Endocr Relat Cancer. 2013;20:705–716. doi: 10.1530/ERC-13-0232. [DOI] [PubMed] [Google Scholar]
- 7.Imperiale A, Moussallieh FM, Sebag F, Brunaud L, Barlier A, Elbayed K, Bachellier P, Goichot B, Pacak K, Namer IJ. A new specific succinate-glutamate metabolomic hallmark in SDHx-related paragangliomas. PLoS One. 2013;8:e80539. doi: 10.1371/journal.pone.0080539. [DOI] [PMC free article] [PubMed] [Google Scholar]
- 8.Rao JU, Engelke UF, Rodenburg RJ, Wevers RA, Pacak K, Eisenhofer G, Qin N, Kusters B, Goudswaard AG, Lenders JW. Genotype-specific abnormalities in mitochondrial function associate with distinct profiles of energy metabolism and catecholamine content in pheochromocytoma and paraganglioma. Clin Cancer Res. 2013;19:3787–3795. doi: 10.1158/1078-0432.CCR-12-3922. [DOI] [PMC free article] [PubMed] [Google Scholar]
- 9.Richter S, Peitzsch M, Rapizzi E, Lenders JW, Qin N, de Cubas AA, Schiavi F, Rao JU, Beuschlein F, Quinkler M. Krebs cycle metabolite profiling for identification and stratification of pheochromocytomas/paragangliomas due to succinate dehydrogenase deficiency. J Clin Endocrinol Metab. 2014 doi: 10.1210/jc.2014-2151. [DOI] [PMC free article] [PubMed] [Google Scholar]
- 10.Canu L, Rapizzi E, Zampetti B, Fucci R, Nesi G, Richter S, Qin N, Giache V, Bergamini C, Parenti G. Pitfalls in genetic analysis of pheochromocytomas/paragangliomas—case report. J Clin Endocrinol Metab. 2014;99:2321–2326. doi: 10.1210/jc.2013-4453. [DOI] [PubMed] [Google Scholar]
- 11.Wishart DS, Jewison T, Guo AC, Wilson M, Knox C, Liu Y, Djoumbou Y, Mandal R, Aziat F, Dong E. HMDB 3.0—the Human Metabolome Database in 2013. Nucleic Acids Res. 2013;41:D801–D807. doi: 10.1093/nar/gks1065. [DOI] [PMC free article] [PubMed] [Google Scholar]
- 12.Wishart DS, Tzur D, Knox C, Eisner R, Guo AC, Young N, Cheng D, Jewell K, Arndt D, Sawhney S. HMDB: the Human Metabolome Database. Nucleic Acids Res. 2007;35:D521–D526. doi: 10.1093/nar/gkl923. [DOI] [PMC free article] [PubMed] [Google Scholar]
- 13.Ebbels TMD, Cavill R. Bioinformatic methods in NMR-based metabolic profiling. Prog Nucl Magn Reson Spectrosc. 2009;55:361–374. [Google Scholar]
- 14.Wold S, Ruhe A, Wold H, Dunn WJJ. The collinearity problem in linear regression. The partial least squares (PLS) approach to generalized inverses. SIAM J Sci Stat Comput. 1984;5:735–743. [Google Scholar]
- 15.Picard RR, Cook RD. Cross-validation of regression models. J Am Stat Assoc. 1984;79:575–583. [Google Scholar]
- 16.Xu QS, Liang YZ. Monte Carlo cross validation. Chemom Intell Lab Syst. 2001;56:1–11. [Google Scholar]
- 17.Benjamini Y, Hochberg Y. Controlling the false discovery rate: a practical and powerful approach to multiple testing. J R Stat Soc Ser B. 1995;57:289–300. [Google Scholar]
- 18.Cicek AE, Bederman I, Henderson L, Drumm ML, Ozsoyoglu G. ADEMA: an algorithm to determine expected metabolite level alterations using mutual information. PLoS Comput Biol. 2013;9:e1002859. doi: 10.1371/journal.pcbi.1002859. [DOI] [PMC free article] [PubMed] [Google Scholar]
- 19.Kanehisa M, Goto S. KEGG: Kyoto encyclopedia of genes and genomes. Nucleic Acids Res. 2000;28:27–30. doi: 10.1093/nar/28.1.27. [DOI] [PMC free article] [PubMed] [Google Scholar]
- 20.Kanehisa M, Goto S, Sato Y, Kawashima M, Furumichi M, Tanabe M. Data, information, knowledge and principle: back to metabolism in KEGG. Nucleic Acids Res. 2014;42:D199–D205. doi: 10.1093/nar/gkt1076. [DOI] [PMC free article] [PubMed] [Google Scholar]
- 21.Selway ZZ. 3rd edn. Blackwell Publishing; Malden, MI: 2014. Metabolism at a Glance. [Google Scholar]
- 22.Martínez-Bisbal MC, Martí-Bonmatí L, Piquer J, Revert A, Ferrer P, Llacer JL, Piotto M, Assemat O, Celda B. 1H and 13C HR-MAS spectroscopy of intact biopsy samples ex vivo and in vivo 1H MRS study of human high grade gliomas. NMR Biomed. 2004;17:191–205. doi: 10.1002/nbm.888. [DOI] [PubMed] [Google Scholar]
- 23.Taïeb D, Sebag F, Sarde E, Berdah S, Doddoli C, Palazzo F, Barlier A, Neumann H, Mundler O. First report of harlequin syndrome as the presenting feature of Carney Triad: a diagnostic and imaging challenge. J Clin Oncol. 2012;30:e168–e171. doi: 10.1200/JCO.2011.41.0159. [DOI] [PubMed] [Google Scholar]
- 24.Wishart DS. vol. 627. Cambridge University Press; Cambridge, United Kingdom: 2013. (Exploring the human metabolome by nuclear magnetic resonance spectroscopy and mass spectroscopy). [Google Scholar]
- 25.Letouzé E, Martinelli C, Loriot C, Burnichon N, Abermil N, Ottolenghi C, Janin M, Menara M, Nguyen AT, Benit P. SDH mutations establish a hypermethylator phenotype in paraganglioma. Cancer Cell. 2013;23:739–752. doi: 10.1016/j.ccr.2013.04.018. [DOI] [PubMed] [Google Scholar]
- 26.Zschocke J, Allritz C, Engele J, Rein T. DNA methylation dependent silencing of the human glutamate transporter EAAT2 gene in glial cells. Glia. 2007;55:663–674. doi: 10.1002/glia.20497. [DOI] [PubMed] [Google Scholar]
- 27.Vicha A, Taieb D, Pacak K. Current views on cell metabolism in SDHx-related pheochromocytoma and paraganglioma. Endocr Relat Cancer. 2014;21:R261–R277. doi: 10.1530/ERC-13-0398. [DOI] [PMC free article] [PubMed] [Google Scholar]
- 28.Dang CV. Glutaminolysis: supplying carbon or nitrogen or both for cancer cells? Cell Cycle. 2010;9:3884–3886. doi: 10.4161/cc.9.19.13302. [DOI] [PubMed] [Google Scholar]
- 29.Eng CH, Abraham RT. Glutaminolysis yields a metabolic by-product that stimulates autophagy. Autophagy. 2010;6:968–970. doi: 10.4161/auto.6.7.13082. [DOI] [PMC free article] [PubMed] [Google Scholar]
- 30.Yuneva M. Finding an “Achilles' heel” of cancer: the role of glucose and glutamine metabolism in the survival of transformed cells. Cell Cycle. 2008;7:2083–2089. doi: 10.4161/cc.7.14.6256. [DOI] [PubMed] [Google Scholar]
- 31.Bornstein SR, Yoshida-Hiroi M, Sotiriou S, Levine M, Hartwig HG, Nussbaum RL, Eisenhofer G. Impaired adrenal catecholamine system function in mice with deficiency of the ascorbic acid transporter (SVCT2) FASEB J. 2003;17:1928–1930. doi: 10.1096/fj.02-1167fje. [DOI] [PubMed] [Google Scholar]
- 32.Baez S, Segura-Aguilar J, Widersten M, Johansson AS, Mannervik B. Glutathione transferases catalyse the detoxication of oxidized metabolites (o-quinones) of catecholamines and may serve as an antioxidant system preventing degenerative cellular processes. Biochem J. 1997;324(Pt 1):25–28. doi: 10.1042/bj3240025. [DOI] [PMC free article] [PubMed] [Google Scholar]
- 33.Carney JA. Carney triad. Front Horm Res. 2013;41:92–110. doi: 10.1159/000345672. [DOI] [PubMed] [Google Scholar]
- 34.Haller F, Moskalev EA, Faucz FR, Barthelmess S, Wiemann S, Bieg M, Assie G, Bertherat J, Schaefer IM, Otto C. Aberrant DNA hypermethylation of SDHC: a novel mechanism of tumor development in Carney triad. Endocr Relat Cancer. 2014;21(4):567–577. doi: 10.1530/ERC-14-0254. [DOI] [PMC free article] [PubMed] [Google Scholar]
- 35.Lindon JC, Nicholson JK. Spectroscopic and statistical techniques for information recovery in metabonomics and metabolomics. Annu Rev Anal Chem (Palo Alto, Calif) 2008;1:45–69. doi: 10.1146/annurev.anchem.1.031207.113026. [DOI] [PubMed] [Google Scholar]
- 36.Righi V, Andronesi O, Mintzopoulos D, Tzika AA. Molecular characterization and quantification using state of the art solid-state adiabatic TOBSY NMR in burn trauma. Int J Mol Med. 2009;24:749–757. doi: 10.3892/ijmm_00000288. [DOI] [PMC free article] [PubMed] [Google Scholar]
- 37.Esteve V, Martinez-Granados B, Martinez-Bisbal MC. Pitfalls to be considered on the metabolomic analysis of biological samples by HR-MAS. Front Chem. 2014;2:33. doi: 10.3389/fchem.2014.00033. [DOI] [PMC free article] [PubMed] [Google Scholar]
Associated Data
This section collects any data citations, data availability statements, or supplementary materials included in this article.
Supplementary Materials
Supplementary Table 1. 1H NMR Resonance Assignments of the Metabolites Identified from the Examined Samples of SDHx-Related and Sporadic PHEOs/PGLs
Supplementary Table 2. Metabolite Differences between Tumor Types (Univariate Analysis). P, Difference in Ranks (Mann-Whitney Test). P*, Adjusted P according to the FDR Procedure
Supplementary Table 3. Metabolite Differences between Tumor Types Adjusted for the Values of Total Catecholamines and Tumor Location (Multiple Linear Regression Coefficients)
Supplementary Table 4. Correlation between Metabolites. Rho, Correlation Coefficient. P*, Adjusted P according to the FDR Procedure.
Importance of the different metabolites regarding their correlations with the SDHx mutation status illustrated by PCA. In the circle of correlations, the closer a vector is to the circle of correlation, the better the correlation with the principal component (mutation status). The angles between vectors reflect their degree of correlation. Two vectors that are diametrically opposed are negatively correlated.
Representative 1D 1H-HRMAS spectra of SDHD-related and sporadic PGLs. Only the metabolites with the higher discriminant power (VIP metabolites) are indicated. The metabolic content of both spectra is directly comparable, since the intensity of each spectrum has been normalized with respect to the weight of the analyzed sample. Examples of 1D HRMAS CPMG spectra obtained from sporadic and SDHD-related PGLs.