

Abstract
Recently, the National Institute on Aging (NIA) and the Alzheimer’s Association (AA), identified specific structural and functional neuroimaging findings as valuable markers of biological processes occurring in the human brain -- especially, processes that herald impending dementia due to Alzheimer’s disease (AD), in its prodromal form. In particular, the imaging modalities of MRI and PET were singled out, along with certain biomarkers in cerebrospinal fluid (CSF), to serve this purpose. We review the clinical tests available for neuropsychologic evaluation and in cases when the differential diagnosis for the causes of cognitive impairment is difficult to make, we consider biomarkers, beginning with CSF, for assessment of cognitive decline. For more direct information about dementia-related pathologic changes in brain tissue, structural features observed in MRI scans are regarded. We next discuss the use of SPECT for evaluating functional changes. Then, pertinent to the recent NIA/AA consensus statement on the diagnosis of prodromal AD, we focus upon assessing the cerebral metabolic changes associated with neurodegenerative diseases that are identified with FDG-PET, as well as consider the most appropriate roles for amyloid imaging based upon recent studies examining the use of PET with tracers having higher retention in brain tissue harboring plaques comprised of insoluble beta-amyloid. We also consider leading causes for the current underutilization of neuronuclear imaging in evaluating patients with cognitive problems, along with strategies for combating them. Finally, we suggest an overall diagnostic algorithm to guide optimal use of all the neuroimaging tools in assessing patients with cognitive decline.
Keywords: Alzheimer’s Disease, dementia, diagnosis, fluorodeoxyglucose, PET, amyloid, prognosis
Background
Alzheimer’s disease (AD) is the most common cause of dementia in the elderly (age ≥ 65). It is responsible for about 50–60% of all dementias, followed by Lewy Body Dementia (LBD) and Frontotemporal Dementia (FTD).1 Approximately 27 million individuals are currently diagnosed with AD worldwide, a number that is estimated to quadruple by 2050, meaning 1 in 85 people will be affected.2 In the United States alone, there are over 5 million cases of AD3, with a projection of 13.2 million afflicted individuals by 2050.4 The higher prevalence of AD, which can be accounted for by overall increased lifespan and population aging, is a socioeconomic dilemma, threatening an unprecedented financial burden on the healthcare system. Sloane et al. developed a model to explore the potential implications of AD, reporting that with the increased number of AD patients, there will be a fourfold increase in the burden of care, as most cases would involve eventual moderate or severe disease and be candidates for institutionalization.5 With current US annual costs of about $200 billion (Medicare: $104.5B, Medicaid $35.5B, out of pocket expenses: $33.8B, and other expenses: $26B) and a projected 6-fold increase by 2050 to 1.1 trillion, accurate early diagnosis and identification of dementia will be critical to providing effective intervention, delay of symptom onset, and/or preventative measures that will be needed to avoid this potentially clinical, social, and financial disastrous scenario.
Lindsay et al. used regression models to calculate the odds ratio (OR) of various risk factors of AD, which include the presence of apolipoprotein E epsilon 4 allele (3.28), aging (1.23), family history (1.02), female sex (1.08), and low education (1.09 for each less year).6 Two other major risk factors of AD include depression and hypothyroidism, which each result in about doubling the risk of dementia.7 AD is characterized by language deterioration, visual and spatial defects, mood changes, apathy, and other similar behavioral changes. Pathologically, AD is characterized by extracellular β-amyloid plaques and intracellular neurofibrillary tangles comprised of hyperphosphorylated tau protein in the hippocampus and neocortex which damage cholinergic neurons, leading to memory impairment and other types of decline. Treatment options include cholinesterase inhibitors and other pharmacologic agents which can delay or offset the progression of cognitive and behavioral disturbances. 8 Unfortunately, clinical identification of AD can only be made when the pathological changes have advanced enough to result in noticeable behavioral or cognitive changes. With early AD diagnosis, there could be sufficient time to delay the destructive effects and slow progression before full onset of the disease.
Patients diagnosed with Mild Cognitive Impairment (MCI) 9 or Mild Decline in Cognition (MDC)10, often representing intermediary states between normal aging and dementia, as a group display more cognitive deterioration than normal, but individuals may eventually transition to AD, stay stable, or revert to normal cognition.9 One subclass of MCI that is particularly important are the amnestic MCI subjects who are impaired in at least one cognitive domain (memory) and are considered to be in a prodromal phase of AD, with approximately 10–15 percent converting to dementia every year. Neuropsychologic testing can be used for this diagnosis, but only with limited accuracy due to measurement variation and limited sensitivity to changes occurring in these patients. Evidence shows that in comparison to clinical evaluation, PET has higher prognostic value in predicting functional decline.10 For instance, the Alzheimer’s Disease Assessment Scale-Cognitive subscale (ADAS-Cog) is widely used, but has limited test-retest reliability as patient performance can be influenced by fatigue, motivation, alertness or mood, all factors that vary day by day or hour by hour. Landau et al. reported that FDG-ROI values have high statistical power in detecting attenuation of cognitive decline in AD and MCI patients in comparison to ADAS-Cog.11 Similarly, Mini-Mental State Exam (MMSE) testing is insensitive to very mild cognitive decline in highly educated individuals as they perform relatively well on psychometric assessments. MMSE also has minimal memory, verbal fluency, problem solving, or judgment items. As a result, these tests cannot reliably identify the risk for AD in normal adults or predict conversion from MCI to AD. Consequently, irreversible damage has already occurred before dementia is clinically manifested. Through a combination of functional and structural imaging techniques, early diagnosis with higher sensitivity and specificity can be made, allowing for earlier intervention during the long preclinical phase of AD with disease-modifying treatments that delay the onset of dementia.
New Guidelines for AD Diagnosis
Previous guidelines for the detection of Alzheimer’s disease included meeting the Diagnostic and Statistical Manual of Mental Disorders, 4th edition (DSM-IV) criteria for dementia, which required an episodic memory disorder and impairment in more than one cognitive domain that interfered with daily life activity or social function. A diagnosis of “probable AD” was essentially a diagnosis of exclusion. 12,13 The DSM-V criteria for dementia, which is set to be released in May 2013, replaces the term dementia with Major Neurocognitive Disorder and doesn’t require that memory be one of the impaired domains, since many neurocognitive disorders begin with impairment in the language or executive function domains. Thus, it allows the cognitive deficit to be limited to one domain as long as it disrupts functional independence.14 However, for the first time in 27 years, the National Institute on Aging and the Alzheimer’s Association established new guidelines for the diagnosis and treatment of dementia. The new guidelines examine the biological changes underlying symptoms of dementia, whereas previous diagnosis relied primarily on neuropsychologic evaluation, clinical assessment, and evaluation of family history or reports. Albert et. al described three distinct phases for AD: presymptomatic, mildly symptomatic but pre-dementia, and dementia caused by AD.15 Furthermore, in conjunction with clinical evaluation, three biomarkers, cerebrospinal fluid (CSF), Magnetic Resonance Imaging (MRI) volume, and Positron Emission Tomography (PET), were identified to be used for diagnosis. The presymptomatic stage marks a preclinical form of AD when biomarker changes indicate early onset of dementia, but memory loss or other behavioral symptoms are not yet noticeable. At this stage, individuals could potentially benefit from vaccination approaches or other preventive strategies. The mildly symptomatic phase is marked by noticeable cognitive changes that don’t necessarily interfere with daily life. The last stage is distinguished by definite memory, cognitive, and behavioral deficits that disrupt daily tasks.
The objective of this review is to assess how the new biomarkers should be best used to identify neurodegeneration at the three stages. Since pathological changes occur prior to clinical expression of AD, these clinical classifications are largely irrelevant from a biological perspective, as revealed by neuroimaging findings, which visualize and quantify the impact of neurodegenerative processes affecting cognition as a continuous spectrum. Large collections of data corroborating the power of brain imaging in helping to establish diagnoses and predict cognitive decline are emerging from multicenter national and international neuroimaging efforts. Of particular clinical pertinence, suggestions on how imaging can be used to trace distinct pathophysiological changes in order to assist with the differential diagnosis among entities like AD, LBD, and FTD will be discussed.
CSF
Measurements of CSF beta-amyloid 42 (Aβ) and tau levels can provide diagnostic/prognostic information on patients with MDC and/or MCI. Abnormally low Aβ and/or high tau levels can accurately help predict pathologic changes associated with AD. Hort. et al reported that in 13 studies with 600 patients, when compared to 450 non-demented controls, low levels of Aβ in CSF patients had a pooled sensitivity and specificity of 86% and 90% for identifying AD. For high tau in CSF across 36 studies with 2500 patients and 1400 controls, the sensitivity was 81% and specificity was 90%.17 However, Hort et al. also found 2 to 3 fold differences in the cut-off values of total tau and Aβ for the same kit across different studies.18 Thus, before CSF is considered a reliable clinical tool, a consensus for processing and handling the samples, and standardized diagnostic criteria, will need to be established.
MRI
MRI, with its high spatial resolution, is effective at detecting structural changes associated with cognitive decline such as atrophy of the medial temporal lobe or hippocampus. This is the most common neuroimaging procedure performed in initial evaluation of mildly symptomatic and demented patients. Studies show that MRI is complementary to clinical evaluation and can help identify those MDC/MCI patients at risk of converting to dementia. One particular study evaluated 118 amnestic MCI subjects, finding that in comparison to subjects with preserved medial temporal regions, those with medial temporal cortical atrophy were 3 times more likely to progress to AD.19,20 MRI scans serve the purpose of excluding less common, but potentially important contributors to dementia symptoms like brain tumors, chronic encephalitis, or normal pressure hydrocephalus.21 Neurological consult, if not already obtained, should follow a positive MRI scan, while physicians should check for other correctable conditions for patients with negative scans.
SPECT
SPECT perfusion has also been used for early diagnosis, and for prediction of progression from MCI/MDC to AD, by tracking regional cerebral blood flow, which is correlated to glucose consumption and reflects neuronal activity. Early detection of functional abnormalities is made by observing the specific pattern of perfusion. AD patients tend to have decreased cerebral blood flow in the temporal and parietal association cortex and the posterior cingulate/precuneus areas, with preservation of blood flow in the sensorimotor cortex, basal ganglia, primary visual cortex, brainstem, and cerebellum. The extent of perfusion abnormalities is well-correlated with the severity of cognitive impairments and the clinical stage of dementia.22 For example, using the reference criterion of postmortem diagnosis, for patients meeting criteria for “probable AD”, SPECT abnormalities increase the likelihood of AD from 84% to 92% and for patients with “possible AD”, diagnostic accuracy is enhanced from 67% to 84% with a positive SPECT; conversely, presence of AD at autopsy decreases to 52% for those with a negative scan 22. Though hypoperfusion can be an indicator of which MCI patients are at risk for developing AD, side-by-side studies of AD patients with mild symptoms reveal that PET is 15–20% more accurate than SPECT in establishing the diagnosis of AD.22 Enhanced spatial resolution and higher amplitude signal for hypometabolism compared to hypoperfusion makes FDG-PET a more sensitive marker than SPECT measures of blood flow alterations.23
FDG-PET
As most compellingly demonstrated in studies with autopsy-confirmed diagnoses for dementia, PET has high accuracy in establishing presence or absence of Alzheimer’s and other neurodegenerative diseases. Additionally, PET is sensitive to changes over time, so it is useful for monitoring disease progression and therapeutic interventions. FDG-PET assesses glucose metabolic activity, and patients with neurodegenerative dementias have decreased regional cerebral metabolic rates for glucose. Patients with early AD have particularly decreased activity in the parietotemporal regions, posterior cingulate, and medial temporal areas.24 (Figure 1) As the disease advances, hypometabolism progresses in the prefrontal cortex. However, regions like the sensorimotor cortex, midbrain, pons, thalamus, and cerebellum are relatively preserved during even the late course of the disease.25 Decreased glucose rates help predict the transition from normal cognition to MDC to dementia and correlate with clinical progression.
Figure 1.
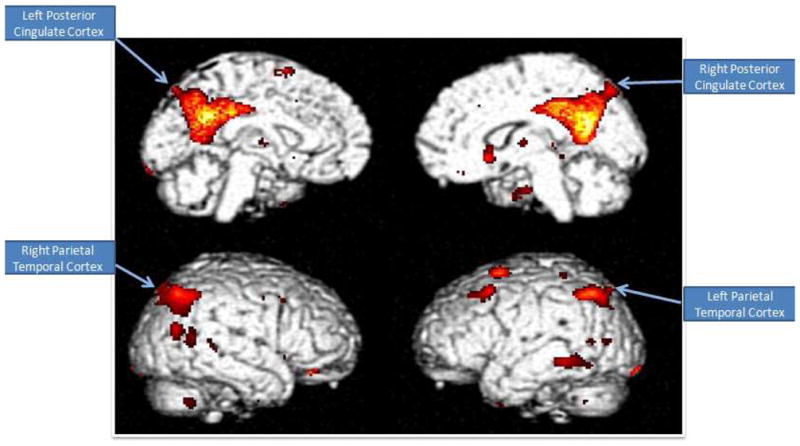
Brain regions of hypometabolism that are predictive of subsequent decline.
Many multicenter data analyses like the Alzheimer’s Disease Neuroimaging Initiative (ADNI), as well as studies with autopsy confirmation of diagnosis, provide evidence for the power of FDG-PET as a biomarker for Alzheimer’s Disease. Recently, Bohnen et al. reviewed several studies across the field; for those studies that used clinical assessment as the reference standard, a pooled diagnostic accuracy of 93% was reported for differentiating AD subjects from normal, with sensitivity of 96% and specificity of 90%.26 In the largest study to use neuropathologic confirmation as the reference standard in testing patients with dementia representing a broad range of possible diagnoses, among 138 autopsied subjects, including 97 with confirmed AD, the sensitivity of FDG-PET for AD diagnosis was 94% with a specificity of 73% for patients presenting with other causes of dementia.27
Furthermore, Jagust et al. reported that FDG-PET could improve clinical diagnosis as a positive FDG-PET scan resulted in 14% higher likelihood of AD pathology when the clinical diagnosis was AD and 35% higher likelihood of AD when the diagnosis was not AD. A negative FDG-PET scan decreased the likelihood of AD pathology by 18% for cases where diagnosis was not AD, and reduced it by 39% when the diagnosis was AD. In both of these cases, whenever PET and the clinical evaluation were discordant, accurate diagnosis was more consistently obtained with FDG-PET.28
In one longitudinal analysis study by Mosconi and colleagues which followed patients considered at risk of AD over 13 years, it was found that glucose reductions occur prior to the onset of clinical symptoms by many years and correlate with dementia severity in life and pathological diagnosis of AD. FDG-PET was especially valuable in detecting pathological features that weren’t evident with clinical evaluation alone.
Differential Diagnosis
Due to overlapping phenotypes and imprecise clinical or neuropsychological distinctions, classification of dementia can be difficult; however, utilization of the various imaging modalities can add significantly to accuracy in the differential diagnosis of AD versus FTD versus LBD. Proper diagnosis can, in turn, help provide effective treatments and avoid harmful treatments like acetylcholinesterase inhibitors for patients with FTD or antidopaminergic neuroleptics for those with LBD. SPECT also reveals characteristic differences in patients with DLB or FTD. In DLB, hypoperfusion is prominent in the visual cortex, while in FTD, there is hypoperfusion of frontal and/or anterior temporal cortex. Brain SPECT was shown to be useful in differential diagnosis of FTD vs. AD with a sensitivity of 71.5% and specificity of 78.2% and 65% sensitivity and 80% specificity for AD v. DLB.29,30 As with SPECT in AD, PET shows deficits in parietotemporal and posterior cingulate cortices; in FTD, deficits in frontal and/or anterior temporal cortex are seen. As demonstrated in a relatively large series of autopsy-confirmed diagnoses, FDG-PET had 97% sensitivity and 86% specificity in distinguishing between AD and FTD.31 In DLB, there are reductions in the parietooccipital areas like the primary visual and occipital association areas with preserved metabolism in medial temporal and posterior cingulate cortices, which can distinguish DLB from AD. Berti et al. reviewed differential diagnoses across the field and found that occipital hypometabolism distinguished DLB from AD with 80–87% specificity and 83–90% sensitivity (greater than that found with clinical diagnostic criteria), in a study using postmortem diagnostic validation.32 FDG can also be used to differentiate between different subtypes of FTD and DLB as they have different patterns of hypometabolism.
Amyloid Imaging
Amyloid β deposition is a relatively early event on the path to AD. The amyloid cascade hypothesis states that overproduction or inability to remove β-amyloid results in β-amyloid deposition and, subsequently, to neurofibrillary tangles, inflammation, cell death, and cognitive impairment. Evidence for the hypothesis stems from the demonstration that different mutations in the β-amyloid precursor protein gene on chromosome 21 give rise to early onset AD. Since the accumulation of fibrillar β-amyloid plaques causes severe damage to neurons years before the onset of dementia, amyloid imaging may be applied to identify neurodegeneration, and predict progression from MCI to AD.
While a number of studies with amyloid imaging have been interpreted in support of this hypothesis, questions have been recently raised, concerning studies involving tracers designed to have increased retention in regions of the brain in which senile plaques are located. Moghbel et al. reviewed the technical aspects and discussed several potential problems, such as partial volume effects that result in underestimated SUV data, high ratio of non-specific to specific uptake occurring in white matter, and discordance between the distribution of amyloid beta in the brain with histopathological and immunohistochemical studies.33 For example, data from a recent phase 3 florbetapir study suggested that amyloid burden in the frontal lobe does not correlate strongly with histopathology determined through autopsy studies.34
MCI subjects who progress to AD have higher Pittsburg Compound-B (PiB) retention at baseline in comparison to MCI non-converters, which is consistent with amyloid deposition occurring before dementia in AD patients. However, studies also show that PiB does not have a high affinity for amorphous plaques in the cortices, as amyloid precipitates and concentrates differently according to the brain region or disease stage. Also, questions concerning the evidence for the binding specificity have recently been raised, as PiB development occurred in the context of the the microdoses that would reach the targeted proteins in vivo, but binding studies were performed ex vivo in a medium with excess radiotracer.33
The density of amyloid is not well correlated with cognitive decline. Bent et al found that amyloid plaque burden didn’t reflect dementia severity. Antiamyloid pharmaceuticals in clinical trials have also failed to reverse cognitive decline, implying that amyloid beta is part of a larger cascade that dictates disease progression. These factors contribute to false positives and false negative scans. For instance, imaging with PiB showed that one fifth of unimpaired individuals demonstrate uptake above a predetermined threshold. Quigley et al. reviewed studies using amyloid imaging and found that PiB-positive cases were identified in a substantial proportion of healthy older individuals (10–30%), limiting diagnositic specificity.35 Similarly, some subjects with declining cognitive function, positive tests for AD biomarkers, and positive histopathological examinations of brain tissue still demonstrated PiB binding below detectable levels.
Amyloid deposition reaches a plateau or progresses slowly by the early clinical stages of the disease. By the time patients are at MCI or mild AD, the therapeutic benefits of anti-amyloid interventions may be limited, as other pathologic processes that are independent of Aβ may be occurring. At this stage, progression would be better assessed using functional imaging techniques since neurodegeneration, rather than amyloid burden, would be more associated with clinical decline. Furthermore, because amyloid deposition peaks, while glucose levels continue to decline as AD progresses, FDG-PET will track disease progression better.
Multi-modal integration
Intelligent use of the available neuroimaging modalities will improve earliness and accuracy of dementia diagnoses. For example, starting at a mildly symptomatic stage, structural imaging like MRI may be performed, and if the cause of cognitive dysfunction remains unclear, FDG-PET may be helpful. Amyloid imaging might be especially useful for evaluating patients comorbidly symptomatic for non-neurodegenerative disorders known to be associated with both cognitive and cerebral metabolic disturbances, such as depression or thyroid disease, which are not known to be generally characterized by amyloid deposition. As an example of data supporting such a role, Silverman et al. stratified 170 patients who received PET scans, based upon presence or absence of depression or thyroid disease, and found that the specificity of identifying patients with subsequent non-progression of cognitive dysfunction decreased for patients presenting with either condition (from approximately 89% to 74%), when compared to use of FDG-PET in subjects having neither condition, while sensitivity remained the same.16 Amyloid imaging may also assist in the differential diagnosis for patients whose FDG-PET scans cannot be clearly interpreted as either being diagnostic for, or excluding AD. Binding properties and unusual distribution of amyloid tracers in the brain have raised concern over use of amyloid imaging however, as discussed above.
Considering all these lines of evidence together, an integrated diagnostic algorithm that makes good use of the specific capabilities of the differing modalities is offered here (Figure 2). To briefly summarize, patients presenting with cognitive deficits or behavioral changes may first undergo clinical, laboratory and cognitive tests, followed by structural neuroimaging. If cognitive deficits persist after treatment for any identified abnormalities and reassessment, an FDG-PET scan would be useful for further evaluation, and amyloid imaging may prove to be most helpful in cases in which the differential diagnosis remains ambiguous, for any of the reasons noted above.
Figure 2.
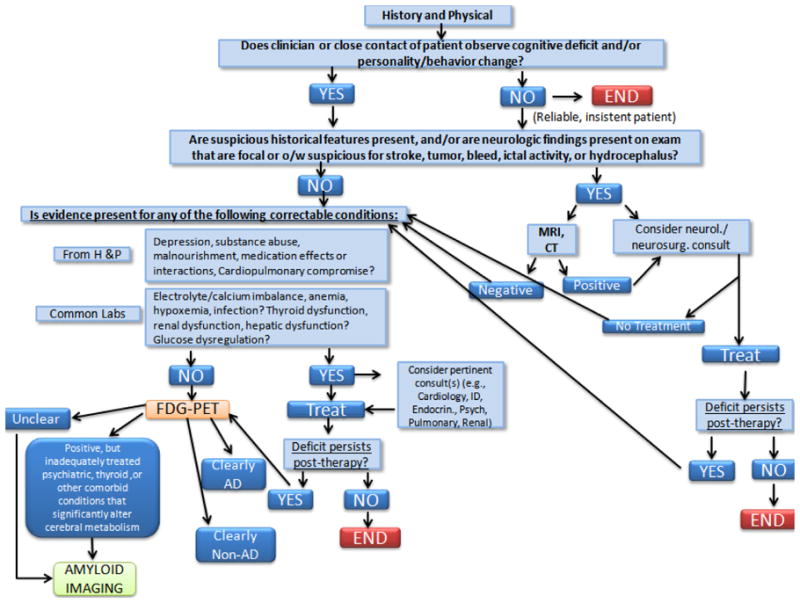
Flow diagram of an algorithm for recommending when MRI, FDG-PET and amyloid imaging are appropriate for evaluation of patients with declining cognition.
Quantification
Though visual interpretation of PET is often sufficient to achieve the high levels of diagnostic and prognostic accuracy described above, quantitative analysis can serve as a useful adjunct in image analysis and allow for regionally quantified comparisons of the degree of hypometabolism between scans. The user can assess differences in hypometabolism between a normal versus dementia group or AD versus FTD groups, and between an individual patient versus a normal group. A quantitative approach additionally allows assessment of the level of decline over subsequent scans for a single patient and allows readers to assess whether activity is statistically significant, leading to greater interpretive confidence and, in some situations, higher diagnostic/prognostic accuracy.36
Two common methods of quantification include measurement of regional brain activity in a predefined region of interest (ROI) or using voxel/pixel- based approaches, which can be used independently, or in mutual corroboration of each other.37 One drawback of the traditional ROI method is that the regions must be manually defined, requiring neuroanatomical expertise in a process that is relatively labor-and time-intensive, often rendering it clinically impractical. This problem can be bypassed by utilizing pixel- or voxel-based methods of analysis that are more automated and generally begin with spatially transforming the patient’s brain scan to a template and then sampling pixels or voxels that are assumed to correspond to specific locations in the patient’s brain image, displaying the quantitative or statistical unit onto the cerebral images.
Standardized ROI (sROI) and volume of interest (sVOI) methods have also been developed which combine features of the manual ROI and voxel-based approaches to automatically calculate and display levels of regional brain activity based on anatomic regions defined on a brain template. Software dedicated to regional brain PET quantification and comparison with a normal database was first cleared by the U.S. Food and Drug Administration for clinical use in 2004, and is commercially distributed under the trademark NeuroQ (Syntermed Inc., Atlanta). In addition to NeuroQ, several other FDA approved options that use various algorithms for quantification have become available, such as Scenium (Siemens AG, New York, NY), MIMneuro (MIMvista Corp., Cleveland, OH), and Cortex ID (GE Healthcare, Waukesha, WI).
Underutilization of PET
Factors contributing to the underutilization of PET include perceptions about cost and availability of resources which are no longer warranted in the U.S., lack of specialized training for interpreting PET scans, and conflicting opinions about the utility of various imaging modalities. Misconstrued notions about the reimbursement process, costs associated with PET, and accessibility, impede utilization. Additionally, many radiologists, and even many ABNM-certified Nuclear Medicine physicians, have difficulty reading brain PET scans as they lack sufficient experience. Radiologists are accustomed to using structural imaging modalities to examine brain, but generally have much less familiarity with PET for this indication. At the patient referral level, when presented with patients who have MCI or MDC, most primary care physicians have limited expertise in pursuing the most appropriate follow-up steps. This may be especially problematic in light of diverse lines of data pointing to enhanced value of treating patients earlier than is currently typically done. Additionally, debates about which imaging modality is best, and lack of clear knowledge about the utility of FDG-PET versus amyloid imaging in evaluating cognitive decline, hinder appropriate utilization of the available imaging tools.
The criteria that patients who qualify for Medicare must meet is less cumbersome than often perceived, and routine reimbursement is possible and easily tracked if physicians follow a systematic referral process. For example, the Brain Imaging Clinic located at UCLA uses a simple seven-point checklist to determine if FDG-PET dementia evaluation is indicated, and will be covered by Medicare (Figure 3).
Figure 3.

Simple checklist utilized by UCLA Brain Imaging Clinic to determine if FDG-PET is indicated, and covered by Medicare
Centralized PET reading services, as have been offered for example at Dartmouth, Stanford, and UCLA facilities, are also excellent options for improving report quality, as qualified experts review the scans and provide detailed feedback. Preceptorships designed for educating healthcare professionals about acquisition and interpretation of PET scans also may help to improve the present situation. As highlighted earlier, quantification methods can help interpreters in extracting more of the objective information acquired in PET images.
Increasing awareness of clinicians about PET availability and utility may promote efforts to appropriately follow-up with the necessary neuroimaging tools that will allow for more accurate diagnosis of patients. A multi-pronged approach to increasing awareness and education of patients, families, and physicians may in the long-run, serve as the most effective approach for combating underutilization of PET for evaluation of prodromal dementia, while concomitantly increasing the confidence and accuracy of physician diagnoses.
Conclusion
Structural and functional imaging techniques can be preferentially used at different stages of cognitive decline, geared to the specific biologic changes occurring in patients. Levels of specific proteins in CSF, and scans obtained with MRI, SPECT, and PET, serve as biomarkers with varying degrees of utility for predicting subsequent cognitive decline, as discussed in detail above. With enhanced education about optimizing the diagnostic work-up for those patients presenting with early cognitive dysfunction, prognostic and diagnostic accuracies and subsequent therapeutic management can be substantially improved.
Footnotes
Publisher's Disclaimer: This is a PDF file of an unedited manuscript that has been accepted for publication. As a service to our customers we are providing this early version of the manuscript. The manuscript will undergo copyediting, typesetting, and review of the resulting proof before it is published in its final citable form. Please note that during the production process errors may be discovered which could affect the content, and all legal disclaimers that apply to the journal pertain.
References
- 1.Gauthier S, Reisberg B, Zaudig M, et al. Mild cognitive impairment. The Lancet. 2006;367(9518):1262–1270. doi: 10.1016/S0140-6736(06)68542-5. [DOI] [PubMed] [Google Scholar]
- 2.Brookmeyer R, Johnson E, Ziegler-Graham K, Arrighi HM. Forecasting the global burden of Alzheimer’s disease. Alzheimer’s and Dementia. 2007;3(3):186–191. doi: 10.1016/j.jalz.2007.04.381. [DOI] [PubMed] [Google Scholar]
- 3.2012 Alzheimer’s disease facts and figures. Alzheimer’s and Dementia. 2012;8(2):131–168. doi: 10.1016/j.jalz.2012.02.001. [DOI] [PubMed] [Google Scholar]
- 4.Hebert LE, Scherr PA, Bienias JL, Bennett DA, Evans DA. Alzheimer Disease in the US Population: Prevalence Estimates Using the 2000 Census. Arch Neurol. 2003 Aug 1;60(8):1119–1122. doi: 10.1001/archneur.60.8.1119. [DOI] [PubMed] [Google Scholar]
- 5.Sloane PD, Zimmerman S, Suchindran C, et al. The Public Health Impact of Alzheimer’s Disease, 2000–2050: Potential Implication of Treatment Advances. Annual Review of Public Health. 2002;23(1):213–231. doi: 10.1146/annurev.publhealth.23.100901.140525. [DOI] [PubMed] [Google Scholar]
- 6.Lindsay J, Laurin D, Verreault R, et al. Risk Factors for Alzheimer’s Disease: A Prospective Analysis from the Canadian Study of Health and Aging. American Journal of Epidemiology. 2002 Sep 1;156(5):445–453. doi: 10.1093/aje/kwf074. [DOI] [PubMed] [Google Scholar]
- 7.Saczynski JS, Beiser A, Seshadri S, Auerbach S, Wolf PA, Au R. Depressive symptoms and risk of dementia: the Framingham Heart Study. Neurology. 2010 Jul 6;75(1):35–41. doi: 10.1212/WNL.0b013e3181e62138. [DOI] [PMC free article] [PubMed] [Google Scholar]
- 8.Winblad B, Engedal K, Soininen H, et al. A 1-year, randomized, placebo-controlled study of donepezil in patients with mild to moderate AD. Neurology. 2001 Aug 14;57(3):489–495. doi: 10.1212/wnl.57.3.489. [DOI] [PubMed] [Google Scholar]
- 9.Petersen RC, Doody R, Kurz A, et al. Current Concepts in Mild Cognitive Impairment. Arch Neurol. 2001 Dec 1;58(12):1985–1992. doi: 10.1001/archneur.58.12.1985. [DOI] [PubMed] [Google Scholar]
- 10.Silverman DHS, Mosconi L, Ercoli L, Chen W, Small GW. Positron Emission Tomography Scans Obtained for the Evaluation of Cognitive Dysfunction. Seminars in Nuclear Medicine. 2008;38(4):251–261. doi: 10.1053/j.semnuclmed.2008.02.006. [DOI] [PMC free article] [PubMed] [Google Scholar]
- 11.Landau SM, Harvey D, Madison CM, et al. Associations between cognitive, functional, and FDG-PET measures of decline in AD and MCI. Neurobiology of Aging. 2011;32(7):1207–1218. doi: 10.1016/j.neurobiolaging.2009.07.002. [DOI] [PMC free article] [PubMed] [Google Scholar]
- 12.Toney LK, McCue TJ, Minoshima S, Lewis DH. Nuclear medicine imaging in dementia: a practical overview for hospitalists. Hospital practice. 2011 Aug;39(3):149–160. doi: 10.3810/hp.2011.08.590. [DOI] [PubMed] [Google Scholar]
- 13.Diagnostic and Statistical Manual of Mental Disorders, Fourth Edition, Text Revision: DSM-IV-TR. 4. Washington DC: American Psychiatric Association; 2000. [Google Scholar]
- 14.S 24 Major Neurocognitive Disorder. 2012. [Accessed March 30, 2012]. [Google Scholar]
- 15.Albert MS, DeKosky ST, Dickson D, et al. The diagnosis of mild cognitive impairment due to Alzheimer’s disease: Recommendations from the National Institute on Aging-Alzheimer’s Association workgroups on diagnostic guidelines for Alzheimer’s disease. Alzheimer’s and Dementia. 2011;7(3):270–279. doi: 10.1016/j.jalz.2011.03.008. [DOI] [PMC free article] [PubMed] [Google Scholar]
- 16.Silverman DHS. Brain 18F-FDG PET in the Diagnosis of Neurodegenerative Dementias: Comparison with Perfusion SPECT and with Clinical Evaluations Lacking Nuclear Imaging. Journal of Nuclear Medicine. 2004 Apr 1;45(4):594–607. [PubMed] [Google Scholar]
- 17.Hort J, O’Brien JT, Gainotti G, et al. EFNS guidelines for the diagnosis and management of Alzheimer’s disease. European Journal of Neurology. 2010;17(10):1236–1248. doi: 10.1111/j.1468-1331.2010.03040.x. [DOI] [PubMed] [Google Scholar]
- 18.Hort J, Bartos A, Pirttilä T, Scheltens P. Use of cerebrospinal fluid biomarkers in diagnosis of dementia across Europe. European Journal of Neurology. 2010;17(1):90–96. doi: 10.1111/j.1468-1331.2009.02753.x. [DOI] [PubMed] [Google Scholar]
- 19.Desikan RS, Cabral HJ, Hess CP, et al. Automated MRI measures identify individuals with mild cognitive impairment and Alzheimer’s disease. Brain. 2009 Aug 1;132(8):2048–2057. doi: 10.1093/brain/awp123. [DOI] [PMC free article] [PubMed] [Google Scholar]
- 20.Desikan RS, Cabral HJ, Settecase F, et al. Automated MRI measures predict progression to Alzheimer’s disease. Neurobiology of Aging. 2010;31(8):1364–1374. doi: 10.1016/j.neurobiolaging.2010.04.023. [DOI] [PMC free article] [PubMed] [Google Scholar]
- 21.Herholz K. Perfusion SPECT and FDG-PET. International Psychogeriatrics. 2011;23(SupplementS2):S25–S31. doi: 10.1017/S1041610211000937. [DOI] [PubMed] [Google Scholar]
- 22.Farid K, Caillat-Vigneron N, Sibon I. Is Brain SPECT Useful in Degenerative Dementia Diagnosis? Journal of Computer Assisted Tomography. 2011;35(1):1–3. doi: 10.1097/RCT.1090b1013e3181f1056fda. [DOI] [PubMed] [Google Scholar]
- 23.Heertum RV, Tikofsky R, Ruben A. Functional Cerebral SPECT and PET Imaging. 3. New York, NY: Lippincott Williams and Wilkins; 2000. [Google Scholar]
- 24.Minoshima S, Giordano J, Berent S, Frey K, Foster N, Kuhl D. Metabolic reduction in the posterior cingulate cortex in very early Alzheimer’s disease. Annals of Neurology. 1997;42:85–94. doi: 10.1002/ana.410420114. [DOI] [PubMed] [Google Scholar]
- 25.Mosconi L. Brain glucose metabolism in the early and specific diagnosis of Alzheimer’s disease. European Journal of Nuclear Medicine and Molecular Imaging. 2005;32(4):486–510. doi: 10.1007/s00259-005-1762-7. [DOI] [PubMed] [Google Scholar]
- 26.Bohnen NI, Djang DS, Herholz K, Anzai Y, Minoshima S. Effectiveness and safety of 18F-FDG PET in the evaluation of dementia: a review of the recent literature. Journal of nuclear medicine: official publication, Society of Nuclear Medicine. 2012 Jan;53(1):59–71. doi: 10.2967/jnumed.111.096578. [DOI] [PubMed] [Google Scholar]
- 27.Silverman DHS, Small GW, Chang CY, et al. Positron Emission Tomography in Evaluation of Dementia. JAMA: The Journal of the American Medical Association. 2001 Nov 7;286(17):2120–2127. doi: 10.1001/jama.286.17.2120. [DOI] [PubMed] [Google Scholar]
- 28.Jagust WMRB, PhD, Mungas D, PhD, Ellis W, MD, DeCarli C., MD What does fluorodeoxyglucose PET imaging add to a clinical diagnosis of dementia? Neurology. 2007 Aug 27;69(9):871–877. doi: 10.1212/01.wnl.0000269790.05105.16. [DOI] [PubMed] [Google Scholar]
- 29.Dougall NJ, Bruggink S, Ebmeier KP. Systematic review of the diagnostic accuracy of 99mTc-HMPAO-SPECT in dementia. The American journal of geriatric psychiatry: official journal of the American Association for Geriatric Psychiatry. 2004 Nov-Dec;12(6):554–570. doi: 10.1176/appi.ajgp.12.6.554. [DOI] [PubMed] [Google Scholar]
- 30.Colloby SJ, Firbank MJ, Pakrasi S, et al. A comparison of 99mTc-exametazime and 123I-FP-CIT SPECT imaging in the differential diagnosis of Alzheimer’s disease and dementia with Lewy bodies. International Psychogeriatrics. 2008;20(06):1124–1140. doi: 10.1017/S1041610208007709. [DOI] [PubMed] [Google Scholar]
- 31.Foster NL, Heidebrink JL, Clark CM, et al. FDG-PET improves accuracy in distinguishing frontotemporal dementia and Alzheimer’s disease. Brain. 2007 Oct 1;130(10):2616–2635. doi: 10.1093/brain/awm177. [DOI] [PubMed] [Google Scholar]
- 32.Berti V, Pupi A, Mosconi L. PET/CT in diagnosis of dementia. Annals of the New York Academy of Sciences. 2011;1228(1):81–92. doi: 10.1111/j.1749-6632.2011.06015.x. [DOI] [PMC free article] [PubMed] [Google Scholar]
- 33.Moghbel M, Saboury B, Basu S, et al. Amyloid-β imaging with PET in Alzheimer’s disease: is it feasible with current radiotracers and technologies? European Journal of Nuclear Medicine and Molecular Imaging. 2012;39(2):202–208. doi: 10.1007/s00259-011-1960-4. [DOI] [PubMed] [Google Scholar]
- 34.Clark CM, Schneider JA, Bedell BJ, et al. Use of Florbetapir-PET for Imaging β-Amyloid Pathology. JAMA: The Journal of the American Medical Association. 2011 Jan 19;305(3):275–283. doi: 10.1001/jama.2010.2008. [DOI] [PMC free article] [PubMed] [Google Scholar]
- 35.Quigley H, Colloby SJ, O’Brien JT. PET imaging of brain amyloid in dementia: a review. International Journal of Geriatric Psychiatry. 2011;26(10):991–999. doi: 10.1002/gps.2640. [DOI] [PubMed] [Google Scholar]
- 36.Silverman DHS. PET in the Evaluation of Alzheimer’s Disease and Related Disorders. New York, NY: Springer Science+Business Media; 2009. pp. 41–45. [Google Scholar]
- 37.Silverman DHS, Geist CL, Kenna HA, et al. Differences in regional brain metabolism associated with specific formulations of hormone therapy in postmenopausal women at risk for AD. Psychoneuroendocrinology. 2011;36(4):502–513. doi: 10.1016/j.psyneuen.2010.08.002. [DOI] [PMC free article] [PubMed] [Google Scholar]