Abstract
Bulk density can be a key indicator of performance, and may influence choice of formulation route of materials in pharmaceutical development. During early development, the cost of API’s can be expensive and the availability of material for powder property analysis is limited. The aim of this work was to investigate a suitable small-scale, low material requirement, bulk density test which would provide comparable data to the recommended large volume USP test. Materials with a range of morphological characteristics typically seen in the pharmaceutical industry were assessed to ensure that methods were suitably robust. It was found that the USP II “low volume” test does not give equivalent results to other tests in the USP, across the range of materials. An alternative test based on the FT4 powder rheometer at a scale of 25 mL gave results equivalent to the large volume USP I standard test. The use of smaller 10-mL methods was also found to give acceptable results for materials that were considered well-behaved but were more variable with difficult to handle materials with low bulk density.
KEY WORDS: active pharmaceutical ingredient (API), bulk density, compressibility index, excipients, pharmaceuticals
INTRODUCTION
Bulk density, defined as the ratio of the mass of a bulk solid to its volume, determines the space occupied by a given amount of material. It is a technique used in the pharmaceutical industry to characterize a material in order to assess its behavior during process operations (1), e.g., blending, compaction, etc., and can be used to identify material changes, e.g., particle size or shape, caused by process attrition (2). The technique is a key parameter in understanding likely performance of a material, and provides an opportunity to monitor changes. As such, the need to capture the information is recognized by key Pharmacopeia, including the USP/National Formulary.
The main challenge when measuring bulk density is obtaining a relevant measure of the bulk volume. The USP general method recommends three different tests to measure bulk density (3). USP test I requires 100 g of sample, but if unavailable, a sample of material with a volume between 50 to 100 mL is acceptable to test using a 100-mL cylinder. The USP recommends these tests over the 25 mL USP II smaller volume Scott Volumeter test. During the early stage of API development, such quantities of material are frequently not available to perform large volume tests. Various papers discuss the variability of the different bulk density measurement (2,4). This test has also proved to be difficult to perform on materials that do not flow easily with leveling of cohesive materials often necessary to obtain a reading. However, a recent technical note concluded that the leveling of powder inside the cylinder as allowed by the European Pharmacopeia should be avoided as it leads to variability in results (5).
The aim of this work was to evaluate alternative material-sparing techniques that give consistent and accurate results comparable to the USP I graduated cylinder method. Materials (excipients and API) were selected to cover the broad range of particle morphologies and bulk densities typically seen in pharmaceutical development. Some of the tests to determine bulk volume require the material to flow into the measuring device which may be affected by particle morphology. As material morphology changes, this will impact on the bulk density due to particle packing issues (6).
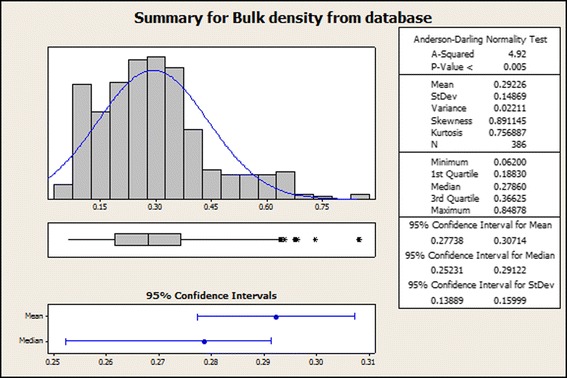
The internal BMS bulk density database (Fig. 1) confirmed that >95% of values for materials, and all for API’s, had a bulk density of 0.6 mg/mL or less.
Fig. 1.

Histogram of bulk density results of pharmaceutical materials from internal BMS database
MATERIALS
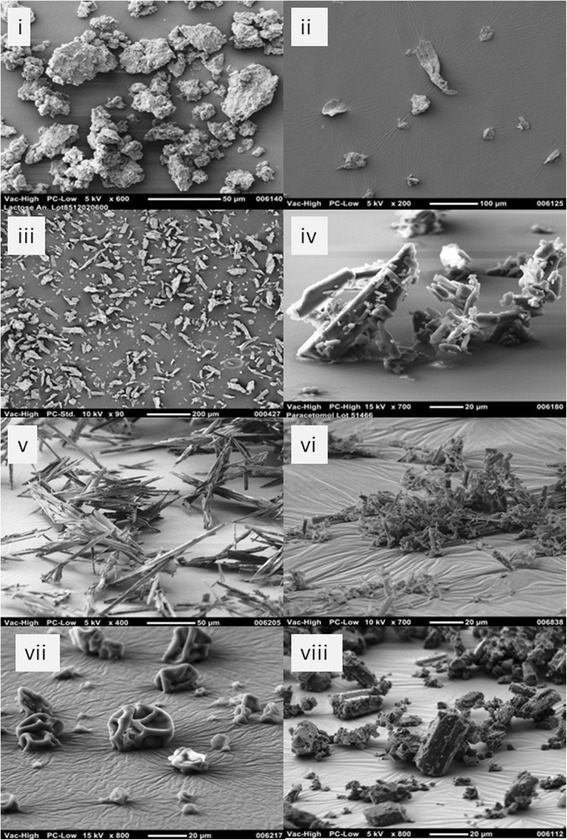
Lactose anhydrous obtained from Kerry Bioscience (Norwich, USA) with the morphological characteristic equant (7) (image (i), Fig. 2). Avicel PH101 equant/lath morphology and Avicel PH102 lath/prism morphology (image iii and ii) were sourced from FMC Corp. (Philadelphia, USA). Paracetamol purchased from Moleka (Dorset, UK) with the morphological characteristics lath/flake (image iv). Material A in this study is a low bulk density API, with low particle size and acicular morphology (Fig. 3), high elongation (image v), and (image vi) reduced elongation material. Material B is a spray-dried dispersion of drug and polymer described as a collapsed sphere (image vii). Such materials are used to enhance the bioavailability of poorly-soluble APIs (8). Material C has better handling characteristics with prism/flake morphology (image viii).
Fig. 2.

SEM images of test API and excipient materials (i lactose anhydrous, ii Avicel PH101, iii Avicel PH102, iv paracetamol, v, vi material A, vii material B, and viii material C)
Fig. 3.

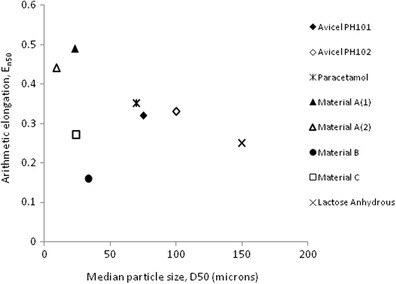
Particle size data for materials tested (black diamond Avicel PH101, white diamond Avicel PH102, asterisk paracetamol, black triangle material A (1), white triangle material A (2), black circle material B, white square material C, multiplication sign lactose anhydrous)
METHODS
The required quantity of material to complete all testing was dispensed from a bulk into a smaller container and then the entire sample was delumped by hand through a 1-mm screen to break up agglomerates that may have formed upon storage as recommended by the USP (3).
Six replicate tests (for each material, in each test) were carried out in a laboratory. The relative humidity in the laboratory was monitored to minimize any material changes due to variable moisture content (9) which did not exceed 40% (actual range was 24 to 37% RH) during the testing.
Scanning Electron Microscopy
Samples were sputter-coated with gold for 60 s using the Jeol JFC-1300 Sputter Coater and then imaged using the Jeol NeoScope JCM-5000 benchtop SEM. The key on each image describes the settings used which from left to right are:
Vacuum: high (using SEI imaging) or low (using BSE imaging)
Probe current (PC): this changes the primary electron beam intensity to specimens. There are three settings: low, standard, and high. Low PC at higher magnifications produces sharper images alternatively at higher PC settings the image signal intensity is higher.
Accelerating voltage: determines the energy of the electron beam and can be set at 5, 10, or 15 kV. In general, sharper images are obtained at high magnifications using high accelerating voltages. Lower acceleration voltage is used when charging or abnormal contrast occurs.
Magnification
Scale bar (μm or mm)
Image number
Particle Size and Shape Analysis
Particle size and shape analysis was determined using a Malvern Morphologi G3 particle characterization system (Malvern Instruments, Malvern, UK). The samples were automatically dry dispersed onto a glass plate set on an automated sample stage. Particle imaging was conducted using magnification lens appropriate to each of the analyzed materials. Morphological filtering of the raw image was conducted on all samples in order to remove partially imaged/overlapping particles using a combination of morphological filters (10). Elongation was determined using Eq. 1 as follows:
| 1 |
The range of elongation values are on a zero to one scale, with values approaching 1 being having greater elongation.
USP Method I—100- and 10-mL Graduated Cylinder
The USP method I test recommends 100 g of material to be used in a 250-mL measuring cylinder for the measurement of bulk density, however, if this quantity of material is not available, the USP suggests that a 100-mL cylinder readable to 1 mL is acceptable to be used with samples that have an apparent volume between 50 and 100 mL.
The mass of an empty 100-mL graduated measuring cylinder was recorded, then using a funnel, the sample was added and the volume recorded before moving, reweighing, and recording the mass of the cylinder. The mass of the empty cylinder was subtracted from the mass of the full cylinder to obtain the sample mass which was then divided by the recorded volume of material in the cylinder to calculate the bulk density. The test was repeated to give a total of six measurements with the same mass of fresh powder used for each subsequent measurement.
A similar procedure was followed for the 10-mL graduated cylinder test.
USP Method II–Scott Volumeter—25 mL
The Scott Volumeter is designed to aerate the material to be tested before filling into a 25-mL cup. The test was performed as described in the USP (3).
FT4 Powder Rheometer—10 and 25 mL
The standard 10 or 25-mL FT4 test were run to include one conditioning cycle with a helix angle of 5° at 40 mm/s tip speed. After conditioning, the vessel was split to remove any excess material. The program recorded the weight of the remaining sample and calculated the bulk density.
Alternative 10-mL Methods
Alternative conditioning cycles for the 10-mL FT4 were developed with the aim of reproducibly conditioning materials to a uniform state at a small volume.
-
(A)
Three conditioning cycles with a helix angle of 5° at −40 mm/s tip speed, then split the vessel and calculate the conditioned bulk density.
-
(B)
Reduced helix angle of 2° at −40 mm/s tip speed, then split the vessel and calculate the conditioned bulk density.
Data Analysis
Data analysis was performed using one-way ANOVA to find a significant difference between the different tests using the Minitab 15 (Minitab, State College, PA, USA) analysis program. The results were analyzed to look at both the precision of the test and then using one-way ANOVA in conjunction with Tukey’s test with a 95% simultaneous confidence interval and an individual confidence level = 99.64% to assess if the alternative tests gave results which were statistically equivalent to the USP I method. Precision was assessed using the %RSD value, with results 5% or below considered to demonstrate acceptable precision for this experimental work. For the equivalence tests, results generated by the statistical analysis with the same grouping were considered to be equivalent.
RESULTS AND DISCUSSION
USP Method I—100-mL Graduated Cylinder
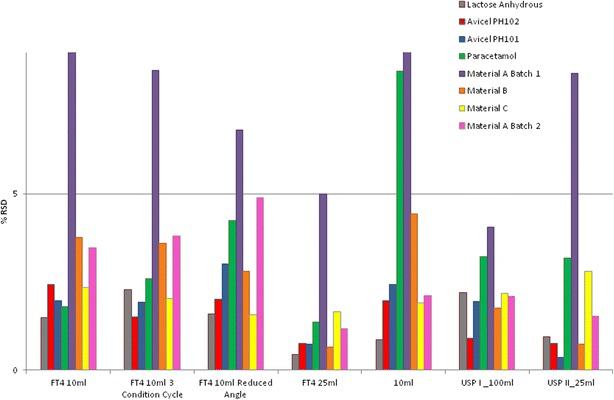
All materials required leveling to enable the volume of the sample to be measured. As previously mentioned, although this is considered acceptable by different Pharmacopeia methods, it can lead to error (5). The results from this test had acceptable precision for all materials (Table I; Fig. 4).
Table I.
Summary of Bulk Density Values and Relative Standard Deviation
| USPI _100 mL | USPII _25 mL | FT4 25 mL | 10-mL graduated cylinder | FT4 10 mL | FT4 10 mL, three condition cycles | FT4 10 mL reduced angle | ||
|---|---|---|---|---|---|---|---|---|
| Lactose | Mean | 0.590 | 0.555* | 0.618* | 0.554* | 0.628* | 0.621* | 0.634* |
| %RSD | 2 | 1 | 0 | 1 | 1 | 2 | 2 | |
| MCCPH102 | Mean | 0.350 | 0.321* | 0.359 | 0.342 | 0.360 | 0.343 | 0.349 |
| %RSD | 1 | 1 | 1 | 2 | 2 | 2 | 2 | |
| MCCPH101 | Mean | 0.312 | 0.279* | 0.317 | 0.302 | 0.323* | 0.312 | 0.317 |
| %RSD | 2 | 0 | 1 | 2 | 2 | 2 | 3 | |
| Paracetamol | Mean | 0.330 | 0.267* | 0.315 | 0.307 | 0.329 | 0.322 | 0.340 |
| %RSD | 3 | 3 | 1 | 8 | 2 | 3 | 4 | |
| Material A–1 | Mean | 0.099 | 0.124* | 0.094 | 0.098 | 0.101 | 0.104 | 0.103 |
| %RSD | 4 | 8 | 5 | 11 | 11 | 9 | 7 | |
| Material B | Mean | 0.280 | 0.260* | 0.292 | 0.263* | 0.301* | 0.282 | 0.290 |
| %RSD | 2 | 1 | 1 | 4 | 4 | 4 | 3 | |
| Material C | Mean | 0.342 | 0.297* | 0.350 | 0.338 | 0.356* | 0.373* | 0.364* |
| %RSD | 2 | 3 | 2 | 2 | 2 | 2 | 2 | |
| Material A–2 | Mean | 0.199 | 0.166* | 0.195 | 0.183* | 0.191 | 0.191 | 0.197 |
| %RSD | 2 | 2 | 1 | 2 | 3 | 4 | 5 |
Italic values highlight %RSD values greater than 5%
*Results not equivalent to USP determined by one-way ANOVA in conjunction with Tukey’s test
Fig. 4.

% RSD results (gray lactose anhydrous, red Avicel PH102, blue Avicel PH101, green paracetamol, purple material A batch 1, orange material B, yellow material C, pink material A batch 2)
USP Method II–Scott Volumeter—25 mL
Previous aerated bulk density measurements performed on cohesive materials have always been considered difficult and an unreliable measurement (4,11). Some samples required manual intervention in order to complete the test, and this technique was found to be dusty and as such required the use of external engineering controls to control exposure to powder; this also resulted in powder loss during testing. The results for this test were consistently different to the USP I method (see Table I). For materials that had low elongation and high particle size distribution (Fig. 3) with good flow characteristics, it had acceptable precision see (Table I; Fig. 4).
10-mL Graduated Cylinder
Similar to the 100-mL graduated cylinder, the samples tested required manual leveling to enable the volume of the sample to be measured. For materials that had low elongation and high particle size distribution (Fig. 3) with good flow characteristics, it had acceptable precision (see Table I; Fig. 4).
FT4 Powder Rheometer—25 mL
The results obtained for all materials, with the exception of lactose anhydrous, were observed to be statistically equivalent to the USP I method and all samples tested had good reproducibility (see Table I; Fig. 4).
FT4 Powder Rheometer—10 mL
The results for the 10-mL FT4 standard test were not as good for similarity testing compared to the FT4 25 mL or the 10-mL graduated cylinder. Alterations and changes to the test, by either increasing the number of conditioning cycles or by reducing the testing angle, did improve the similarity scores although both had acceptable precision (see Table I; Fig. 4)
CONCLUSIONS
The findings show that the FT4 25 mL small volume method would be a suitable alternative to the USP I method and is able to handle a wide range of difficult-to-handle materials with different bulk densities and morphological characteristics (Figs. 1 and 3) with a good degree of precision compared to other methods.
The use of the 10-mL graduated cylinder and the FT4 10-mL method could also be considered a suitable alternative for small quantity materials but is a less precise method especially for difficult-to-handle materials with high elongation and low particle size (see Figs. 2, 3, and 4).
The results confirm that the Scott Volumeter, the USP low volume material technique, does not produce equivalent results to other techniques. For material comparison using a database, when gathering early stage development information on materials, the use of the Scott Volumeter is not recommended and cannot be compared directly with data gathered later in development from alternate techniques.
Acknowledgements
The team is grateful for the help of Peter Timmins, Venkatramana Rao, and Joanne Kelleher in executing this work.
References
- 1.Mohammadi MS, Harnby N. Bulk density modelling as a means of typifying the microstructure and flow characteristics of cohesive powders. Powder Technol. 1997;92(1):1–8. doi: 10.1016/S0032-5910(96)03254-8. [DOI] [Google Scholar]
- 2.Iacocca RG, Burcham CL, Hilden LR. Particle engineering: a strategy for establishing drug substance physical property specifications during small molecule development. J Pharm Sci. 2010;99(1):51–75. doi: 10.1002/jps.21801. [DOI] [PubMed] [Google Scholar]
- 3.United States Pharmacopeia and National Formulary. USP 36-NF 31. Rockville: United States Pharmacopeia Convention; 2013. p. 265–7.
- 4.Vasilenko A, Koynov S, Glasser BJ, Muzzio FJ. Role of consolidation state in the measurement of bulk density and cohesion. Powder Technol. 2013;239:366–73. doi: 10.1016/j.powtec.2013.02.011. [DOI] [Google Scholar]
- 5.Sousa e Silva JP, Splendor D, Gonçalves IMB, Costa P, Sousa Lobo JM. Note on the measurement of bulk density and tapped density of powders according to the European pharmacopeia. AAPS Pharm Sci Technol. 2013;14(3):1098–100. doi: 10.1208/s12249-013-9994-5. [DOI] [PMC free article] [PubMed] [Google Scholar]
- 6.Durney TE, Meloy TP. Particle shape effects due to crushing method and size. Int J Miner Process. 1986;16(1–2):109–23. doi: 10.1016/0301-7516(86)90078-5. [DOI] [Google Scholar]
- 7.Rawle AF. Particle morphology and characterization in preformulation. In: Adeyeye MC, Brittain HG, editors. Preformulation in solid dosage form development: Informa Healthcare; 2008. p. 145–84.
- 8.Leane MM, Sinclair W, Qian F, Haddadin R, Brown A, Tobyn M, et al. Formulation and process design for a solid dosage form containing a spray-dried amorphous dispersion of ibipinabant. Pharm Dev Technol. 2013;18(2):359–66. doi: 10.3109/10837450.2011.619544. [DOI] [PubMed] [Google Scholar]
- 9.Crouter A, Briens L. The effect of moisture on the flowability of pharmaceutical excipients. AAPS Pharm Sci Technol. 2014;15(1):65–74. doi: 10.1208/s12249-013-0036-0. [DOI] [PMC free article] [PubMed] [Google Scholar]
- 10.Gamble JF, Chiu WS, Tobyn M. Investigation into the impact of sub-populations of agglomerates on the particle size distribution and flow properties of conventional microcrystalline cellulose grades. Pharm Dev Technol. 2011;16(5):542–8. doi: 10.3109/10837450.2010.495395. [DOI] [PubMed] [Google Scholar]
- 11.Leturia M, Benali M, Lagarde S, Ronga I, Saleh K. Characterization of flow properties of cohesive powders: a comparative study of traditional and new testing methods. Powder Technol. 2014;253:406–23. doi: 10.1016/j.powtec.2013.11.045. [DOI] [Google Scholar]


