Abstract
Polymeric materials are often used in pharmaceutical packaging, delivery systems, and manufacturing components. There is continued concern that chemical entities from polymeric components may leach into various dosage forms, particularly those that are comprised of liquids such as parenterals, injectables, ophthalmics, and inhalation products. In some cases, polymeric components are subjected to routine extractables testing as a control measure. To reduce the risk of discovering leachables during stability studies late in the development process, or components that may fail extractables release criteria, it is proposed that extractables testing on polymer resins may be useful as a screening tool. Two studies have been performed to evaluate whether the extractables profile generated from a polymer resin is representative of the extractables profile of components made from that same resin. The ELSIE Consortium pilot program examined polyvinyl chloride and polyethylene, and another study evaluated polypropylene and a copolymer of polycarbonate and acrylonitrile butadiene styrene. The test materials were comprised of polymer resin and processed resin or molded components. Volatile, semi-volatile, and nonvolatile chemical profiles were evaluated after headspace sampling and extraction with solvents of varying polarity and pH. The findings from these studies indicate that there may or may not be differences between extractables profiles obtained from resins and processed forms of the resin depending on the type of material, the compounds of interest, and extraction conditions used. Extractables testing of polymer resins is useful for material screening and in certain situations may replace routine component testing.
KEY WORDS: extractables, PC/ABS, polyethylene, polypropylene, polyvinylchloride
INTRODUCTION
The use of polymeric-based materials continues to grow in the pharmaceutical industry. Not only are plastics used for packaging and delivery systems, but increasingly their use has expanded into the manufacturing suite with the advent of single use systems. Many applications involve components that are manufactured by sintering, spinning, extrusion, or injection molding. Examples of these include the following: bags, bottles, caps, blister laminates, syringes, inhalers, valves, tubing, filters, and many more.
Over the past several years, there has been a growing interest in the chemicals that might leach out of these materials into the pharmaceutical dosage form during storage or use (leachables) and either impact efficacy by interacting with the drug or safety by causing harm to the patient. Some chemicals (e.g., phthalates, nitrosamines, polynuclear aromatics), even at very low levels, may have adverse effects. The level of interest has been great enough that several different industry groups have joined with regulators and sought to come to agreement on recommendations and establish best practices for evaluating leachables and extractables in inhalation products (e.g., Product Quality Research Institute (PQRI) Leachables and Extractable Working Group: Orally Inhaled and Nasal Drug Products (OINDP)), parenterals, and ophthalmics (e.g., PQRI Leachables and Extractables Working Group: Parenteral and Ophthalmic Drug Products (PODP)) and single-use manufacturing systems (e.g., Bioprocess Systems Alliance (BPSA)).
Current best practices among pharmaceutical manufacturers (1, 2) involve evaluating component materials for compounds that can be extracted under laboratory conditions (extractables) from finished components or assemblies in order to predict potential chemical entities (leachables) that could eventually be found in the drug product. Extractables studies are typically followed by a formal leachables evaluation of the drug product after storage in the finished component or assembly to evaluate the compounds found that could be potentially harmful. Leachables studies are typically expected for nonsolid formulations (3–5). Extractables screening of materials in advance of their use in a drug product could prevent unexpected outcomes from leachables studies at the end of a clinical development program. Molded components that undergo routine extraction testing for the purpose of releasing product to market may yield unexpected out of specification results and this could be minimized by testing the resin from which the component is molded. Unprocessed resin testing has the potential to eliminate long delays that might be encountered due to unexpected results.
The work presented here examines the feasibility of utilizing unprocessed resin extractables testing for the purposes of screening materials and as an alternative approach to component routine control testing. Two sets of experiments were designed and performed separately to evaluate these proposed approaches. The screening experiments were performed by the Extractables and Leachables Safety Information (ELSIE) Materials Working Group as part of the Material Pilot Protocol (6) that involved processing and analyzing two common primary packaging materials—polyethylene (PE) and polyvinyl chloride (PVC). The alternate routine control testing experiments were performed by an ELSIE member company using validated routine extractables methods to analyze two resins, polypropylene (PP) and a copolymer of polycarbonate and acrylonitrile butadiene styrene (PC/ABS), and several inhaler drug path components molded from them. Each set of experiments included extraction of both unprocessed and processed resin, chromatographic separation of the extracted chemicals, and evaluation of the chromatograms (extractables profile) to compare the effects of process parameters on the extractables profile observed. This allows for evaluation of new extractables generated and/or loss of extractables (stabilizers or volatile chemicals) that may occur as a result of processing. Although there have been several studies published detailing extractable profiles of polymer materials (7–10), this is the first study to detail a comprehensive comparison of processed versus unprocessed resin extractables profiles.
STUDY DESIGN
The study design was focused on investigating the effect of selected molding process parameters on extractables profiles. There are several steps involved in the process of molding a resin into a finished component. The resin is typically dried and may be mixed with other additives or colorants online before it is delivered to the injection-molding machine. The resin then is heated to a preset temperature (melt temperature), mixed by single- or twin-screw mechanisms rotating at a preset speed (screw speed), and injected at a preset rate (injection speed) into the mold, which has one or more cavities to be filled by the molten material. The two-part mold is held together in the molding machine at preset pressure (hold pressure) and the part is allowed to cool briefly in the mold, which is maintained at a preset temperature (mold temperature) that is several hundred degrees below the melt temperature of the unprocessed resin. The molded component is then ejected from the mold. In order to optimize the preset values for each process parameter, a design of experiments (DoE) study is performed by the molder. From this, a molding window is derived, which is the range of settings that has been shown to produce acceptable components. It was anticipated that process parameters associated directly (melt temperature) or indirectly (screw speed) with temperature would be more likely to have an impact on the extractables profile due to chemical reaction or degradation.
Principles of chemical reaction kinetics would indicate that time and temperature would be primary factors in any changes in chemical levels. For the general reaction, A + B → D with a reaction rate constant (k), where A is the target molecule (e.g., polymer, additive), B is a reactive molecule (e.g., O2, oligomer radical) in abundance relative to A, and D is a degradation product or products; the change in concentration of [A] with time (t) can be described by the equation: −d[A]/dt = k [A][B]. If the concentration of B is directly related to the concentration of A (e.g., oligomer radical) such that [B] = r[A], the rate of change in concentration is described by the equation: −d[A]/dt = kr[A]2, which upon integration over time leads to the analytical relationship: 1/[A] ∝ kt (11, pp. 737–739). The reaction rate constant (k) is a function of temperature (T) and can be described by a modified version of the Arrhenius equation: k = PZ′e−E*/RT, where P is related to the probability that complex molecules will be in the correct orientation to react, Z′ is related to the frequency of molecules being close enough to react and is proportional to √T, E* is the minimum energy required for the reaction to take place, and R is a constant (11, pp. 772–773). Taken together, these indicate that a change in target concentration can be proportional to time and exponentially affected by temperature. This relationship was recently demonstrated for PVC degradation by Kronganz et al. (12). Based on this understanding, the residence time at the melt temperature could have an impact on the extractables profile.
Since the molding window typically includes temperatures near the melting point at fixed residence times below the maximum settings recommended by the resin manufacturer, the screening experiments were designed to explore “worst case” conditions in which the resin is heated to the maximum vendor recommended temperature and held for the maximum residence time. Energy was added by thermal heating and mechanical mixing to simulate the melt temperature and shear forces experienced during molding. One batch of each processed resin was prepared and tested alongside the unprocessed resin. Ideally, screening would take place using components made from different materials early in the development but that would require multiple molds with different molding windows and is generally not feasible from a business perspective. The screening experiments were designed with a plausible pragmatic approach and also taking into consideration that pharmaceutical manufacturers each have unique packaging or delivery system designs, and final configurations are often unavailable during material selection.
The process parameters considered in the alternate control testing experiments were taken from previously established molding windows with fixed residence times and variable melt temperatures, mold temperatures, and hold pressures as illustrated in Fig. 1. One PP component and two PC/ABS components were molded with varied melt temperature and hold pressure. One additional PC/ABS component was molded with varied melt temperature and mold temperature. Three batches of components and their respective unprocessed resin lots were tested. The initial batch of molded components was made up of one lot of each of the components molded at the corners of a molding window and three lots of that component molded at the center process condition; the same lot of unprocessed resin was used to mold the entire batch. The additional two batches of molded components were molded at the center process condition from two different unprocessed resin lots.
Fig. 1.
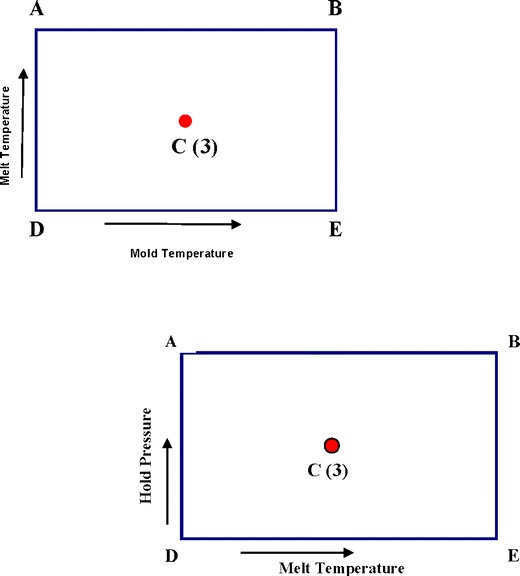
Molding windows for PP and PC/ABS components
The alternate control testing experiments can be thought of as a way to explore impact of processing parameters on extractables profiles within a design space, whereas the screening experiments were intended to cover a broader range and create a knowledge space that could be utilized for material selection. The underlying assumption for both cases is that results obtained from testing at combinations including the maxima represent and encompass the range of results that might be obtained within the space outlined. The relationship between the two is depicted in Fig. 2.
Fig. 2.
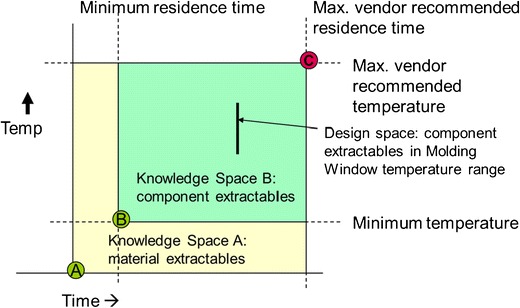
Illustration of knowledge space and design space
MATERIALS AND METHODS
- PVC
A custom batch (50 lbs) was provided by Teknor Apex (formulation code: 09-X0016A-78NT, Clear) with a known formulation: 61% polymer, 7% epoxidized soybean oil, 30% dioctylphthalate, 0.5% calcium stearate, 0.5% zinc stearate, and 1% erucamide.
- PE
A batch (1,000 g) of commercially available additive free low-density polyethylene (LDPE) was supplied by Borealis AG (Bormed LE6601-PH)
- PP
A custom-blended light gray polypropylene (RTP 199) was obtained from RTP Company; Components A1 and A2 were molded at a contract manufacturer.
- PC/ABS
A custom-colored light gray Cycoloy C1950 was obtained from GE Plastics; Components B, C, and D were molded at two contract manufacturers.
Molding Simulation for Screening Experiments
The PVC and PE suppliers provided maximum vendor recommended temperatures and residence times. Since molding procedures vary, several approaches were tried. Initially, some feasibility studies were conducted to evaluate the effects of both melt temperature and residence time on physical appearance. These were explored to ensure that conditions were chosen such that there were no visible signs of degradation (e.g., discoloration).
The Haake Minilab II was used at the University of Connecticut. It had a small sample volume, 7 cm3, with an output of 5 g per run, run times of 30 min, plus 60 min transition time between runs. Unfortunately, this equipment was not able to produce enough treated plastic in a single batch for the proposed testing.
During communication with potential suppliers of plastic materials, both the PE and PVC suppliers agreed with the concept of processing the plastic via the CW Brabender—Intellitorque Plasticorder equipped with a Fusion Bowl mixer (Brabender Fusion Bowl); however, it was noted that this equipment may not work for all plastics. Some materials may be sensitive to residual water and/or oxygen in the resin prior to heating. For those materials, a nitrogen purge could be added.
The Brabender Fusion Bowl was used at Aspen Research. Differences in the heating time were visibly apparent by the color of the processed PVC resin as shown in Fig. 3. To mitigate that issue, nitrogen purging was introduced to more closely mimic the molding procedure in a production setting. A final set of processing conditions was obtained for the PVC and PE resins by experimentation. The PVC processed under the final conditions (60 g, 15 min at 182°C) had minimal discoloration as in DOE-2 (Fig. 3). The PE processed under the final conditions (45 g, 30 min at 182°C) had no discoloration. The 45–60 g capacity of the Fusion Bowl was a significant improvement over the Minilab II; however, five runs had to be performed to make enough of the simulated molded (processed) material for testing. The material from each of the runs was combined to make one lot of each processed polymer for testing.
Fig. 3.
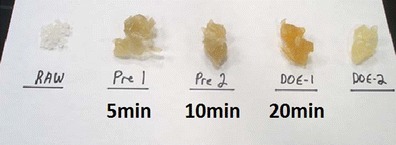
Effect of processing conditions on PVC resin color: Raw—unprocessed resin; melted, processed resins: for Pre1, Pre 2, DOE-1, bowl temperature = 182°C at labeled mixing times; for DOE-2 bowl temperature = 192°C for 5 min with nitrogen purge
Material Testing
Extraction and chromatographic analysis was performed at several contract laboratories. The details for the ELSIE Pilot Protocol study are listed in Table I. The processed and unprocessed PVC and PE were distributed among 10 different laboratories who participated in portions of the testing. The materials were submitted for extraction testing according to the ELSIE Pilot Protocol, which included the use of seven extraction techniques, six or seven extraction solvents, and several analytical techniques. Extracts were to be evaluated for inorganic elements utilizing inductively coupled plasma-mass spectrometry (ICP-MS), volatile compounds by headspace gas chromatography-mass spectrometry or flame ionization detection (GC-MS/FID), semi-volatile compounds by direct injection GC-MS, and nonvolatile compounds by liquid chromatography-mass spectrometry/ultraviolet or diode array detection (LC-MS/UV or DAD). Only the material testing that was performed to obtain the results presented here are included in the Table I.
Table I.
Test Matrix for ELSIE Pilot Protocol Experiments
| Material | Form | Extraction technique | Extraction solvent | Analysis type | Standards used | Contract lab |
|---|---|---|---|---|---|---|
| PE | Unprocessed | Headspace Reflux |
NA Dichloromethane Isopropanol IPA/Water 50:50 WFI, pH 2.5, pH 9.5 Isohexane |
GC-MS GC-MS LC-MS/DAD |
Toluene-d8; 2-fluorobiphenyl/palmitic acid-d31/Tinuvin 327; Palmitic acid-d31/Tinuvin 327 |
1 |
| PE | Unprocessed | Headspace Sonication Reflux ASE |
NA Dichloromethane Isopropanol IPA/Water 50:50 WFI, pH 2.5, pH 9.5 Hexanes |
GC-MS/FID GC-MS/FID |
USP Class 2A, B DMP/anthracene-d10 |
2 |
| PE | Unprocessed | Sonication | Dichloromethane Isopropanol IPA/Water 50:50 WFI, pH 2.5, pH 9.5 Isohexane |
LC-MS/DAD | Irganox 245 | 3 |
| PE | Unprocessed | Reflux ASE |
Isopropanol IPA/Water 50:50 WFI, pH 2.5, pH 9.5 |
ICP-MS LC-MS/DAD |
45Sc, 89Y, and 238U | 4 |
| PE | Processed | Headspace | NA | GC-MS/FID | USP Class 2A, B | 2 |
| PE | Processed | Soxhlet | Dichloromethane Isopropanol Water Hexane |
GC-MS/FID | Fluorene-d10/p-terphenyl | 5 |
| PVC | Unprocessed | Headspace Reflux |
NA Isopropanol IPA/Water 50:50 WFI, pH 2.5, pH 9.5 Isohexane |
GC-MS GC-MS LC-MS/DAD |
Toluene-d8; 2-fluorobiphenyl; Palmitic acid-d31/Tinuvin 327 |
1 |
| PVC | Unprocessed | Headspace Soxhlet |
NA Isopropanol WFI, pH 2.5 Hexanes |
GC-MS/FID GC-MS/FID |
USP Class 2A, B DMP/anthracene-d10 |
2 |
| PVC | Unprocessed | Sonication | Isopropanol IPA/Water 50:50 WFI, pH 2.5, pH 9.5 Isohexane |
GC-MS LC-MS/DAD |
Irganox 245 | 3 |
| PVC | Unprocessed | Reflux Soxhlet |
Isopropanol IPA/Water 50:50 WFI, pH 2.5, pH 9.5 Hexane |
GC-FID | Fluorene-d10/p-terphenyl | 5 |
| PVC | Unprocessed | Headspace Soxhlet Microwave |
NA Isopropanol IPA/Water 50:50 WFI, pH 2.5, pH 9.5 Isohexane |
GC-MS GC-MS LC-MS/DAD |
Not provided Acenaphtene-d10/DEHP; Not provided |
6 |
| PVC | Processed | Headspace Reflux |
NA Isopropanol IPA/Water 50:50 WFI, pH 2.5, pH 9.5 Isohexane |
GC-MS GC-MS LC-MS/DAD |
Toluene-d8; 2-fluorobiphenyl/palmitic acid-d31/Tinuvin 327; Palmitic acid-d31/Tinuvin 327 |
1 |
| PVC | Processed | Headspace ASE |
NA Isopropanol IPA/Water 50:50 WFI, pH 2.5, pH 9.5 Hexanes |
GC-MS/FID GC-MS/FID |
USP Class 2A, B DMP/anthracene-d10 |
2 |
| PVC | Processed | Soxhlet | Isopropanol IPA/Water 50:50 WFI, pH 2.5, pH 9.5 Isohexane |
GC-MS LC-MS/DAD |
Irganox 245 | 3 |
| PVC | Processed | Microwave Sealed container ASE |
Isopropanol IPA/Water 50:50 WFI, pH 2.5, pH 9.5 |
ICP-MS LC-MS/DAD |
45Sc, 89Y, and 238U | 4 |
| PVC | Processed | Reflux | Isopropanol IPA/Water 50:50 WFI, pH 2.5, pH 9.5 Hexane |
GC-FID | Fluorene-d10/p-terphenyl | 5 |
| PVC | Processed | Microwave Sealed container |
Isopropanol IPA/Water 50:50 WFI, pH 2.5, pH 9.5 Isohexane |
GC-MS | Not provided | 7 |
PE polyethylene, PVC polyvinyl chloride, NA not applicable, WFI water for injection, IPA isopropanol, GC-MS chromatography-mass spectrometry, ICP-MS inductively coupled plasma-mass spectrometry, LC-MS/DAD liquid chromatography-mass spectrometry/diode array detection, GC-MS/FID gas chromatography-mass spectrometry or flame ionization detection, DMP dimethylphthalate, DEHP di(2-ethylhexyl) phthalate, USP United States Pharmacopeia, ASE accelerated solvent extraction
The details for the alternate routine control testing study are listed in Table II. The PP unprocessed resin and component samples were prepared and analyzed at one contract lab and the PC/ABS samples at another. Each lab used material-specific proprietary validated methods with the conditions listed. A total of 38 extractables profiles were generated for PP and 119 for PC/ABS.
Table II.
Test Conditions for Alternate Control Testing Experiments
| Material | Extraction technique | Extraction solvent | Analytical technique/column | Target compound | Contract lab |
|---|---|---|---|---|---|
| PP | ASE | Isopropanol | GC-FID, DB-5; LC-UV, C8 | Irgafos 168; Antioxidant | 8 |
| PC/ABS | ASE | IPA/cyclohexane 95:5 | GC-FID, ZB-35 | Irganox 1076 | 9 |
PP polypropylene, PC/ABS polycarbonate/acrylonitrile butadiene styrene, GC-FID gas chromatography-flame ionization detection, LC-UV liquid chromatography-ultraviolet detection, ASE accelerated solvent extraction, IPA isopropanol
Data Treatment
Reports were prepared by the contract labs that provided both qualitative and quantitative extractable profile results. For PVC and PE, the numerical results from multiple labs were compiled by members of the ELSIE Materials WG. The results from the GC analyses were then evaluated for conformance to the protocol with respect to the demonstration of reaching asymptotic levels for target compounds. Only those conforming data sets were further evaluated.
For PP and PC/ABS samples, two data treatments were undertaken: the qualitative profiles were examined for known profile peaks and new or missing peaks in the chromatograms; a statistical analysis was performed to compare quantitative values for a single material-specific target compound measured in molded components and unprocessed resin. A statistical analysis of variance was completed, taking the molding window as a designed experiment to evaluate the effects of the two molding window variables and the cross product of those two as the input variables that could impact the output value of the target compound concentration. The p value obtained for each effect was evaluated with the expectation that a value greater than 0.05 was an indication of no effect of the molding window variables on the target concentration. Additionally, the percent difference between the target concentrations obtained from the molded component extract and that of the unprocessed resin extract was calculated.
RESULTS AND DISCUSSION
Screening Experiments
The processed and unprocessed materials were evaluated for volatile, semi-volatile, and nonvolatile compounds. The type and level of volatiles observed by headspace GC-MS varied depending on whether the PVC or PE was processed or raw resin. In all cases, the levels of volatiles were extremely low. The results presented in Table III show that some of the same volatiles are present before and after processing the PVC material. The carbonyl compounds are likely formed due to oxidation reactions during analysis since they are present in both materials and processing was performed under nitrogen. Similar results were reported by Hill et al. (13) when thermal desorption was used to evaluate PVC volatiles. The PE volatiles were mostly branched hydrocarbons and present at extremely low levels as shown in Table IV. For both materials, not all compounds were identified at all labs potentially due to differences in instrumentation.
Table III.
Volatiles from PVC
| Prob (%) | Compound | CAS number | Lab | Amount (μg/g) | |
|---|---|---|---|---|---|
| Resin | Processed | ||||
| >80 | Methyl formate | 107-31-3 | 1 | 0.93 | 0.90 |
| 79 | Butyraldehyde | 123-72-8 | 2 | – | 0.43, 0.54 |
| 70 | 2-Butanone | 78-93-3 | 2 | – | 0.26, 0.41 |
| >80 | Valeraldehyde | 110-62-3 | 1, 2 | – | 0.21, 0.47, 0.52 |
| 61 | 2,3-Dihydrofuran | 1191-99-7 | 2 | – | 0.06, 0.07 |
| 65 | Hexanal | 66-25-1 | 1, 2 | 0.33, 0.34, 0.1 | 1.31, 1.35, 0.79 |
| 69 | 3-Heptanone | 106-35-4 | 1, 2 | 0.08, 0.09, 0.1 | 0.52, 0.54, 0.11 |
| >80 | Octanal | 123-13-0 | 1 | – | 0.19 |
| NA | Unknown hydrocarbon | NA | 2 | 0.57, 0.62 | 0.51 |
| NA | Unknown hydrocarbon | NA | 2 | 0.66, 0.71 | 0.64, 0.65 |
| NA | Unknown hydrocarbon | NA | 2 | 1.21, 1.29 | 1.12, 1.15 |
| 23 | 5-Ethyl-2,2,3-trimethylheptane | 62199-06-8 | 2 | 1.60, 1.67 | 1.42, 1.47 |
| NA | Unknown hydrocarbon | NA | 2 | 1.15, 1.25 | 2.80, 3.12 |
NA not applicable, PVC polyvinyl chloride
Table IV.
Volatiles from PE
| Prob (%) | Compound | CAS number | Lab | Amount (μg/g) | |
|---|---|---|---|---|---|
| Resin | Processed | ||||
| >75 | Butyraldehyde | 123-72-8 | 2 | – | 0.26, 0.74 |
| 17 | 2-Butanone | 78-93-3 | 2 | – | 0.07, 0.47 |
| 92 | Valeraldehyde | 110-62-3 | 2 | – | 0.21, 0.33 |
| 47 | 2-Methyl-1-pentanol | 105-30-6 | 1 | 0.15 | |
| 52 | 2-Ethylcyclobutanone | 10374-14-8 | 1 | 0.15 | |
| 43 | 2,4-Dimethylheptane | 2213-23-2 | 1, 2 | 0.07, 0.14, 0.10 | – |
| 28 | 4-Methyloctane | 2216-34-4 | 2 | 0.05, 0.09 | – |
| 43 | 3-Ethylheptane | 15869-80-4 | 2 | 0.04, 0.07 | – |
| 61 | 3,3-Diethylpentane | 1067-20-5 | 1, 2 | 0.14, 0.27, 0.25 | – |
| 25 | 2,3,4-trimethylhexane | 921-47-1 | 1 | 0.19, 0.18 | |
| 43 | 3-Ethyl-3-methylheptane | 17302-01-1 | 1, 2 | 0.12, 0.20, 0.17 | – |
| 64 | Hexylpentyl ether | 32357-83-8 | 1 | 0.18 | – |
| 64 | Tetradecane | 629-59-4 | 1 | 0.18 | – |
| 45 | Nonadecane | 629-92-5 | 1 | 0.36 | – |
PE polyethylene
Both the unprocessed and processed PVC showed a number of extractables resulting from use of different solvents and techniques. The processed material required more time than the unprocessed material to reach asymptotic levels for the same compound as shown in Fig. 4. This same trend was observed for accelerated solvent extraction (ASE; data not shown). This is likely due to the fact that the unprocessed PVC was in the form of pellets and the processed material was cut into pieces that were 3–5 g each, which would have a much smaller surface area to mass ratio. It is possible that the curvature of the surface of the pellets compared to the relative flatness of the processed material may also have contributed to this difference since it has been shown that the reduction from a three-dimensional surface to a two-dimensional surface can result in a change in the rate of solid to liquid diffusion of up to a factor of three (14). The impact on the extractables profile is that many of the compounds are present at significantly higher levels in the unprocessed resin compared to the processed resin.
Fig. 4.
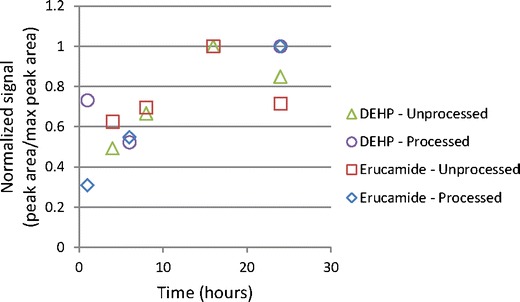
Time course for IPA Soxhlet extraction of PVC (lab 2 and lab 3)
The compounds found in the solvent extracts mirror the known PVC composition: DEHP and its breakdown products (e.g., 2-ethyl-1-hexanol), erucamide, long-chain fatty acids associated with the stearates and epoxidized soybean oil-related compounds found by nonvolatile analysis (results not shown). The plots above show evaluation of semi-volatiles in the PVC processed and unprocessed materials from Soxhlet or ASE extracts with hexane (Fig. 5) and reflux extracts with isopropanol (Fig. 6), 50/50 isopropanol/water (Fig. 7), and water for injection (Fig. 8). The chemical composition of the extracts identified by CAS number is nearly the same as that for the PVC extracts prepared from the same PVC resin composition used in the PQRI study (9). This confirms that regardless of the details of the extraction experiment, the identification of compounds will be reliable. There were noticeable quantitative differences in the levels of the compounds in this study due to extraction solvent and technique and that topic has been discussed in detail elsewhere [see Teasdale et al., Controlled Extraction Studies Applied to Polyvinylchloride and Polyethylene Materials: Conclusions from the ELSIE Controlled Extraction Pilot Study, paper submitted to AAPS PharmSciTech, under review]. As is typically seen for many polymers, the isopropanol extracts had the greatest number of extractables followed by the isopropanol/water mixture, hexane, and then water. In some cases, it appears that the isopropanol has formed an ester with various moieties during extraction. In each extract, there are some compounds that appear only in either the unprocessed PVC (e.g., BHT) or the processed material (e.g., bis(2-ethylhexyl)adipate). The absence of BHT in the processed material could be readily explained by changes due to processing in which antioxidants are used up. In most cases, the unprocessed PVC showed greater concentrations of free fatty acids, except in the case of the hexane extract where they were more readily extracted from the processed PVC. In addition to the additives in the PVC material, the organic extracts from either the processed or unprocessed PVC contained later eluting hydrocarbons, which are most likely polymer-related.
Fig. 5.
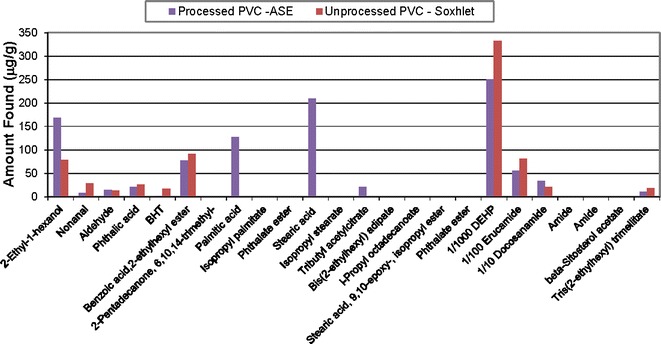
Semi-volatile extractables from processed and unprocessed PVC extracted by ASE or Soxhlet with hexane (lab 2)
Fig. 6.
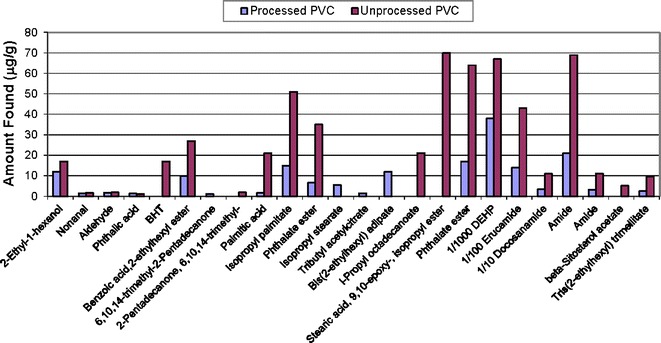
Semi-volatile extractables from processed and unprocessed PVC refluxed in isopropanol (lab 1)
Fig. 7.
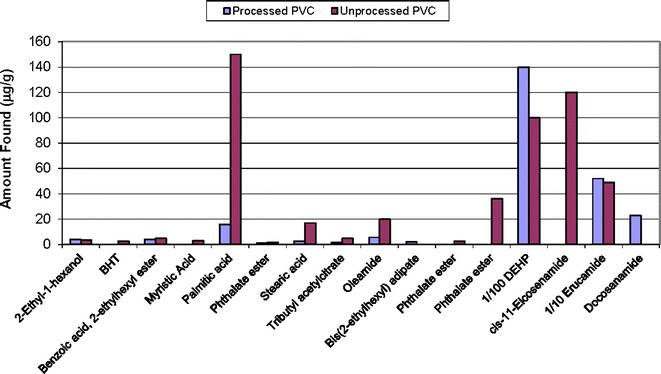
Semi-volatile extractables from processed and unprocessed PVC refluxed in 50/50 water/isopropanol (lab 1)
Fig. 8.
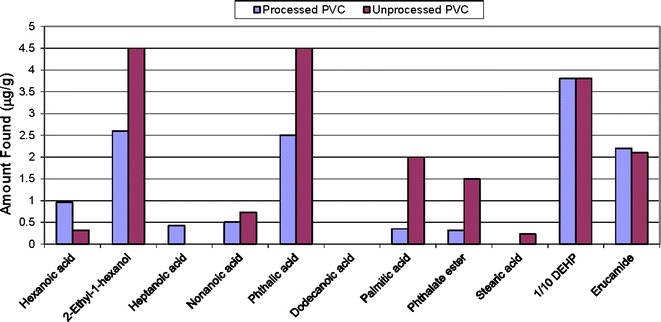
Semi-volatile extractables from processed and unprocessed PVC refluxed in water for injection (WFI) (lab 1). Note: dodecanoic acid was found in pH 9.5 water extracts
In contrast to PVC, the PE materials showed very few extractables, with very low levels. This is consistent with the general trend in nonvolatile residues observed by Albert (15). Depending on the extraction technique, solvent used, and method of quantification at different labs, there was a difference observed in the quantity of total extractables for the unprocessed material. A review of the results when plotted on a normalized scale (see Fig. 9) suggests that the most extractables are obtained using hexane. The low regulatory limit set for the parameter, “substances soluble in hexane,” confirms that low levels of extractables are expected for polyethylene materials (16, 17) and polyolefins in general (18, 19); there continue to be efforts to improve the methodology to measure this parameter (20, 21). The compounds found in common across multiple extraction techniques and solvents are listed in Table V. The majority of these compounds were unsaturated hydrocarbon linear oligomers that were likely released as part of the extraction process with strong solvents. From this, it can be seen that the level of any one extractable was very low. There was minimal analysis of the processed polyethylene. From the data available, the processed PE showed no semi-volatile or nonvolatile extractables above the reporting threshold when extracted by Soxhlet with various solvents. This may be due in part to a combination of the less aggressive extraction technique and a result of the surface area/diffusion differences between processed and unprocessed resin as discussed above for PVC.
Fig. 9.
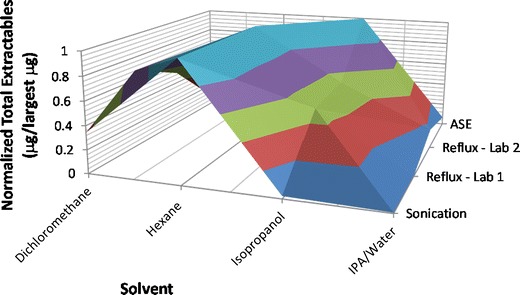
Unprocessed PE total extractables from two different contract labs
Table V.
Extractables from Unprocessed Polyethylene
| Compound | CAS number | Maximum amount (μg/g) |
|---|---|---|
| Undecane | 1120-21-4 | 3.8 |
| Dodecane | 112-40-3 | 1.0 |
| 2-Methylundecane | 7045-71-8 | 2.2 |
| Tridecane | 629-50-5 | 0.44 |
| Tetradecane | 629-59-4 | 1.7 |
| Pentadecane | 629-62-9 | 1.5 |
| Heptadecane | 629-78-7 | 1.1 |
| Octadecane | 593-45-3 | 2.8 |
| Nonadecane | 629-92-5 | 1.2 |
| Eicosane | 112-95-8 | 3.0 |
| 2-Methylnonadecane | 1560-86-7 | 3.7 |
| 3-Methyleicosane | 6418-46-8 | 3.8 |
| Heneicosane | 629-94-7 | 1.5 |
| 3-Methylheneicosane | 6418-47-9 | 3.5 |
| Docosane | 629-97-0 | 2.7 |
| Tricosane | 638-67-5 | 1.9 |
| 2-Methyltricosane | 1928-30-9 | 6.9 |
| 3-Methyltricosane | 13410-45-2 | 4.2 |
| Tetracosane | 646-31-1 | 3.8 |
| Pentacosane | 629-99-2 | 2.8 |
| Hexacosane | 630-01-3 | 5.9 |
| Heptacosane | 593-49-7 | 3.6 |
| Octacosane | 630-02-4 | 5.2 |
| Triacontane | 638-68-6 | 12.2 |
| Dotriacontane | 544-85-4 | 13.6 |
| Tetratriacontane | 14167-59-0 | 11.3 |
Alternate Control Testing Experiments
The extractables from PP and PC/ABS consisted of additives and some polymer related compounds (data not shown for proprietary reasons). The GC-FID qualitative profile comparisons are illustrated in Figs. 10, 11, and 12. The profiles of unprocessed resin were not different than those of the molded components. A second set of PP extractables qualitative profiles were generated with LC-UV and are shown in Fig. 13. The unprocessed resin and molded component LC-UV extractables profiles have the same peaks, although the chemical entities represented are slightly different than those observed by GC-FID. In this case, two of the peaks (labeled “PK1” and “PK2”) are present in greater amounts in the unprocessed resin than in the molded component. These are likely to be additives associated with the molding process since they were found to decrease in components molded at the high temperature and also the center condition. In one case, PK2, the chemical entity is a known antioxidant and its degradation would be expected during molding.
Fig. 10.
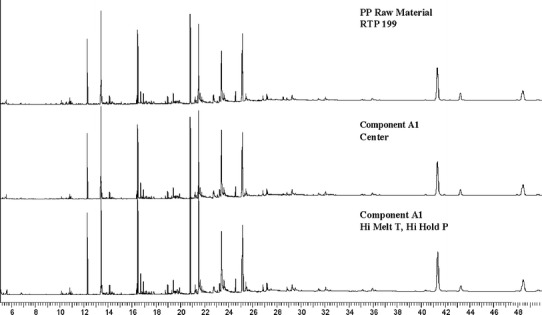
PP component A1 and RTP 199 GC-FID extractables profiles
Fig. 11.
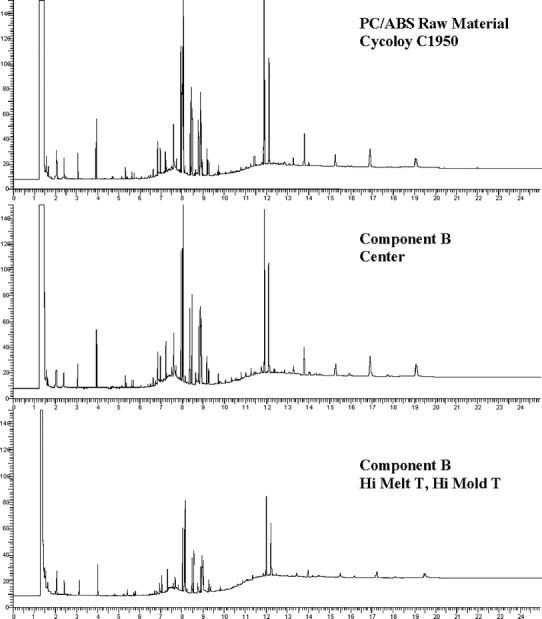
PC/ABS component B and Cycoloy C1950 GC-FID extractables profiles
Fig. 12.
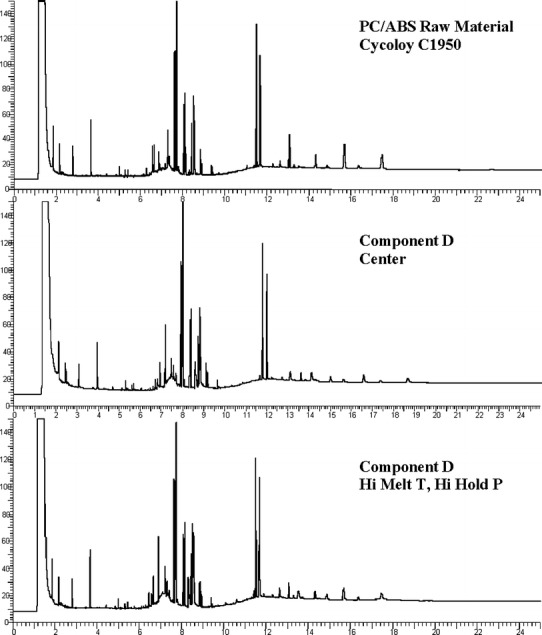
PC/ABS component D and Cycoloy C1950 GC-FID extractables profiles
Fig. 13.
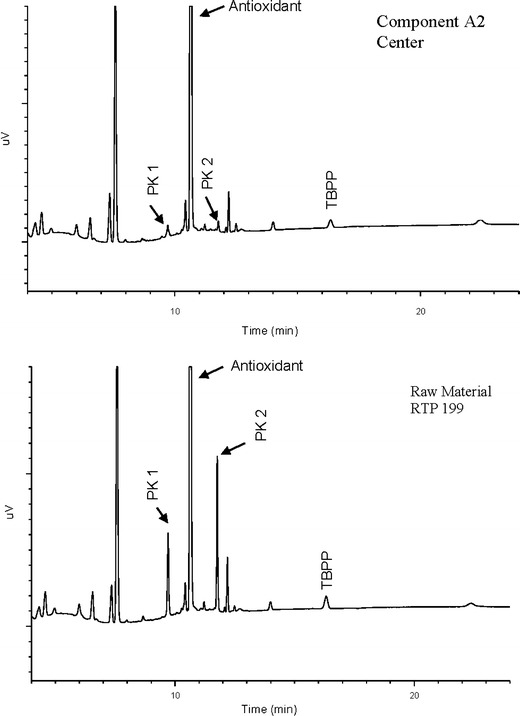
PP component A2 and RTP 199 LC-UV extractables profiles
The quantitative target levels were statistically evaluated for PP and PC/ABS materials. The p values from the ANOVA are summarized in Table VI. The fact that the p values were all greater than 0.05 indicates that none of the molding process parameters had a significant effect on the extractables profile. This was further confirmed by comparison of the target levels, which were at the ppm level in the extracts. As shown in Table VII, the percent differences between unprocessed resin and molded components were generally less than the repeatability of the assay and significantly less than the allowable percent difference between analysts, which was 10 or 25% during validation. The variability in the percent difference observed with GC-FID analysis of PP material extracts was greater than that of the PC/ABS. This is likely due to the chemical stability of the target compound; TBPP (Irgafos 168) is more likely to degrade than OBHP (Irganox 1076) because of its chemical nature. This degradation may be a result of the extraction process itself as it was observed that higher extraction temperatures result in greater degradation of TBPP (data not shown).
Table VI.
p values from Molding Window ANOVA
| Component A1 | Component A2 | Component B | Component C | Component D | |
|---|---|---|---|---|---|
| Melt temperature | 0.8056 | 0.1341 | 0.2650 | 0.3591 | 0.8960 |
| Mold temperature | N/A | N/A | 0.5326 | N/A | N/A |
| Melt T × mold T | N/A | N/A | 0.1290 | N/A | N/A |
| Hold pressure | 0.8751 | N/A | N/A | 0.2731 | 0.7464 |
| Melt T × hold P | 0.6741 | N/A | N/A | 0.3967 | 0.4231 |
| Residence time (MIN) | 0.63 | 0.83 | 5.14 | 1.08 | 5.96 |
| HI melt T (°C) | 196 | 203 | 261 | 293 | 274 |
| Melt T range (°C) | 191–232 | 191–232 | 230–300 | 230–300 | 230–300 |
NA not applicable
Table VII.
Percent Difference in Target Compound Levels in Extracts of Unprocessed Resin Compared to Extracts of Molded Components
| Component | % Difference | % RSD of mean | % RSD of method | Target |
|---|---|---|---|---|
| A1 | 8.3, 20.3, 18.9, 0.5, 2.1 | 10 | 25 | TBPP |
| A2 | 2.7 | 1 | 10 | Antioxidant |
| B | 1.3, 1.9, 3.2, 4.0, 9.9 | 8 | 25 | OBHP |
| C | 2.1, 0.0, 0.2, 0.1, 12.8 | 8 | 25 | OBHP |
| D | 6.9, 8.6, 8.9, 5.5, 2.6 | 1 | 25 | OBHP |
TBPP Tris (2,4-di-tert-butylphenyl) phosphite, OBHP Octadecyl 3-(3,5-di-tert-butyl-4-hydroxyphenyl)propionate
CONCLUSION
The ELSIE Pilot Protocol study showed that there can be differences between the extractables profiles of processed polymer and unprocessed resin. These differences may be attributed to a combination of material differences and variations in methodology used for extract preparation and sample analysis. Overall, the profiles had many chemical entities in common for a given polymer, and it may be useful to screen materials by performing extraction on the unprocessed resin. To establish a comprehensive knowledge space for polymeric materials used in pharmaceutical packaging, delivery systems, or manufacturing components, it is useful to test the processed component as well.
The results obtained from the alternate routine control testing experiments showed that making minor adjustments to the molding process parameters does not have a significant impact on the extractables profile of PP or PC/ABS materials. When a validated quantitative method was used for the preparation and analysis of polyolefin or condensation polymer extracts, there was a qualitative and, in some cases, a quantitative correlation between extractables profiles of the unprocessed resin and molded components. As demonstrated by the quantitative comparisons in the alternate control testing experiments, some of the variability observed may be specific to the material and the target compounds chosen. Depending on the level of quantitative differences and whether such differences are relevant to the use of the component, it may be feasible to replace component testing with unprocessed resin testing. This would only be realistic if other controls were in place to prevent the introduction of chemical entities during molding or other processes.
Taken together, the studies show that the use of a validated material specific method can reduce the variability in the number of compounds and their quantitative levels in an extractables profile. Extraction and analysis of unprocessed resin may be useful for screening materials to support material selection with the understanding that testing of the processed component cannot simply be dismissed. Likewise, with appropriate experimentation and controls in place, it may be possible to justify replacement of routine testing of a processed component with routine testing of unprocessed resin.
Acknowledgments
The authors gratefully acknowledge the support of the material suppliers, contract manufacturers, Bespak and The Tech Group, and the extensive work of the contract labs that performed the experiments: Toxikon Corp., PPD, Aspen Research Corp., Hall Analytical Laboratories, Chemic Laboratories, Inc., West Pharmaceutical Services, Intertek, and Catalent Pharma Solutions. The efforts of ELSIE Materials working group members who compiled the results are much appreciated.
References
- 1.Norwood DL, Paskiet D, Ruberto M, Feinberg T, Schroeder A, Poochikian G, et al. Best practices for extractables and leachables in orally inhaled and nasal drug products: an overview of the PQRI recommendations. Pharm Res. 2008;25(4):727–39. doi: 10.1007/s11095-007-9521-z. [DOI] [PubMed] [Google Scholar]
- 2.Paskiet D, Jenke D, Ball D, Houston C, Norwood DL, Markovic I. The Product Quality Research Institute (PQRI) Leachables and Extractables Working Group Initiatives for Parenteral and Ophthalmic Drug Product (PODP) PDA J Pharm Sci Technol. 2013;67(5):430–47. doi: 10.5731/pdajpst.2013.00936. [DOI] [PubMed] [Google Scholar]
- 3.WHO Expert Committee on Specifications for Pharmaceutical Preparations . “WHO technical report series, no. 981”. Geneva: WHO Press; 2013. [PubMed] [Google Scholar]
- 4.Packaging Technical Committee of the Chemistry. Manufacturing, and Controls Coordinating Commiittee . Guidance for industry: container closure systems for packaging human drugs and biologics. Rockville: US Food and Drug Administration; 1999. [Google Scholar]
- 5.Committee for Medicinal Products for Human Use (CHMP) Committee for Medicinal Products for Veterinary Use (CVMP) Guideline on plastic immediate packaging materials. London: European Medicines Agency; 2005. [Google Scholar]
- 6.Extractables and Leachables Safety Information Exchange, Controlled Extraction Studies on Materials for ELSIE Database Qualitative and Semi-quantitative Studies, 2010.
- 7.Jenke D. Compatibility of pharmaceutical products and contact materials. Hoboken: Wiley; 2009. [Google Scholar]
- 8.Ball DJ, Norwood DL, Stults CLM, Nagao LM. Leachables and extractables handbook: safety evaluation, qualification, and best practices applied to inhalation drug products. Hoboken: Wiley; 2012. [Google Scholar]
- 9.Jenke D, Castner J, Egert T. Extractables characterization for five materials of construction representative of packaging systems used for parenteral and opthalmic drug products. PDA J Pharm Sci Tech. 2013;67(5):448–511. doi: 10.5731/pdajpst.2013.00933. [DOI] [PubMed] [Google Scholar]
- 10.Bohrer D. Sources of contamination in medicinal products and medical devices. Hoboken: Wiley; 2013. [Google Scholar]
- 11.Castellan GW. “Physical Chemistry”, Reading, Addison-Wesley, 1971.
- 12.Kronganz VV, Lee Y-P, Bourassa A. “Kinetics of thermal degradation of poly(vinyl chloride) by color”. Boston: SPE ANTEC; 2011. [Google Scholar]
- 13.Hill S, Shaw B, Wu A. Plasticizers, antioxidants, and other contaminants found in air delivered by PVC tubing used in respiratory therapy. Biomed Chromatogr. 2003;17(4):250–62. [DOI] [PubMed]
- 14.Samuel J, Ottolenghi M, Avnir D. Diffusion-limited reactions at solid–liquid interfaces: effects of surface geometry. J Phys Chem. 1991;95(5):1890–5. doi: 10.1021/j100158a004. [DOI] [Google Scholar]
- 15.Albert DE, “Material and chemical characterization for the biological evaluation of medical device biocompatibility,” in Biocompatibility and performance of medical devices, Philadelphia, Woodhead Publishing, 2012, pp. 65–94.
- 16.“3.1.4 Polyethylene without additives for containers for parenteral preparations and for ophthalmic preparations,” in European Pharmacopoeia.
- 17.“3.1.5 Polyethylene with additives for containers for parenteral preparations and for ophthalmic preparations,” in European Pharmacopoeia.
- 18.“3.1.3 Polyolefines,” in European Pharmacopoeia.
- 19.US Food and Drug Administration, “Title 21, Volume 3, 177.1520,” in Code of Federal Regulations, 2010.
- 20.van Rensburg Q, Luruli N, Sadiku R. Method development for determination of n-hexane solvent extractable materials in polyethylene using FIPA. Macromol Symp. 2012;313–314(1):43–50. doi: 10.1002/masy.201250305. [DOI] [Google Scholar]
- 21.ASTM Subcommittee D20.70, D5227-13 Standard test method for measurement of hexane extractable content of polyolefins, ASTM International, 2013.


