

Abstract
The objective of this study was to develop a solid dispersion based controlled release system for drug substances that are poorly soluble in water. A wax-based disintegration mediated controlled release system was designed based on the fact that an amorphous drug can crystallize out from hydrophilic matrices. For this study, cilostazol (CIL) was selected as the model drug, as it exhibits poor aqueous solubility. An amorphous solid dispersion was prepared to assist the drug to attain a supersaturated state. Povidone was used as carrier for solid dispersion (spray drying technique), hydrogenated vegetable oil (HVO) as wax matrix former, and sodium carboxymethyl cellulose (NaCMC) as a disintegrant. The extreme vertices mixture design (EVMD) was applied to optimize the designed and developed composition. The optimized formulation provided a dissolution pattern which was equivalent to the predicted curve, ascertaining that the optimal formulation could be accomplished with EVMD. The release profile of CIL was described by the Higuchi’s model better than zero-order, first-order, and Hixson-Crowell’s model, which indicated that the supersaturation state of CIL dominated to allow drug release by diffusion rather than disintegration regulated release as is generally observed by Hixson-Crowell’s model. The optimized composition was evaluated for disintegration, dissolution, XRD, and stability studies. It was found that the amorphous state as well as the dissolution profile of CIL was maintained under the accelerated conditions of 40°C/75% RH for 6 months.
KEY WORDS: cilostazol, controlled release, disintegration-mediated controlled release (DMCR), extreme vertices mixture design (EVMD), solid dispersion
INTRODUCTION
A significant percentage of molecular entities in pharmaceutical industry’s drug development program are poorly water-soluble molecules discovered using modern high-throughput screening techniques and also because of the increasing number of complex diseases demanding higher lipophilicity and larger molecular weight (1). Albeit such molecules are highly desirable from therapeutic perspective to treat specific ailments, their poor water solubility and dissolution rate still remain one of the major challenges in pharmaceutical drug development. Such drug substances belonging to Biopharmaceutics Classification System (BCS) Class II category, exhibiting the properties of poor solubility and high permeability, achieve insufficient absorption from the lower part of gastrointestinal tract. Furthermore, in spite of their high permeability, these drugs often have low oral bioavailability because of their slow and incomplete release and poor availability for absorption in gastrointestinal fluid (2). In the past, the industrial thought process for developing such drug substances considered it a high risk program; however, due to their occurrence in large numbers, the direction has shifted towards acceptance with more scientific rigor and making use of solubility improvement techniques for development of drug products (3,4).
Addressing this issue, the pharmaceutical industry has developed multiple methods for increasing the apparent solubility of such poorly aqueous soluble molecules. Conventionally, salt formation was preferred by medicinal and synthetic chemists for weak bases or weak acids (5). Unfortunately, only 20–30% of new molecules form salts easily. As a consequence for the rest of the 70–80% of these entities, an alternative route needs to be developed to improved solubility (6). Additional approaches to improve the apparent solubility of such molecules include prodrugs (7), complex formation with cyclodextrins (8), liposomes (9), solid lipid nanoparticles (10), soft gelatin capsules (11), pH microenvironmental modifiers (12), and high-energy polymorphs (13).
However, these approaches often fail to provide the desired therapeutic concentration for very poorly water-soluble drugs. In contrast to solubilization approaches, one possible approach to increase drug exposure is through the formation of a supersaturated state. And it is not surprising that the last decade has shown the prevalence of scientific literature and marketed products made with drug substances present in supersaturated state using amorphous solid dispersion technique (14). The term solid dispersion has been defined as a dispersion of one or more active in an inert carrier or matrix at the solid state prepared by solvent, melting or solvent–melting method, and the active in solid dispersion can be dispersed as separate molecules, amorphous particles, or crystalline particles while the carrier can be in the crystalline or amorphous state (15).
The technique of using solid dispersions as a strategy to improve the drug absorption was first used in 1961, when Sekiguchi et al. (16,17) reported the use of eutectic mixtures (formed by fusion) capable of enhancing dissolution and absorption rates of certain drugs. Since then, numerous studies have been published on solid dispersions and recently Chau et al. (18) categorized solid dispersions in four categories. The first generation represents crystalline solid dispersions having a crystalline drug dispersed in a crystalline carrier forming a eutectic or monotectic mixture, while the second generation represents solid dispersions containing amorphous carriers (mostly polymers). The third generation represents solid dispersions, wherein the surface active agents or self-emulsifiers are introduced as carriers or additives which exhibit significant improvement in solving the challenges of precipitation and recrystallization as observed in first and second-generation solid dispersions. The fourth generation of solid dispersions represents controlled release solid dispersion containing poorly water-soluble drugs with a short biological half-life, wherein two targets are to be achieved, i.e., solubility enhancement and extended release in a controlled manner (19). The controlled release systems of poorly water-soluble drugs having short half-life are highly desirable as these systems allow a reduction of pill burden, dosing frequency, and food restrictions while maintaining efficacy (20). However, there are very limited scientific literature and marketed products available having controlled release solid dispersion kind of system.
Cilostazol (CIL) is a neutral molecule having an aqueous solubility of 3 μg/mL at 25°C and the apparent permeability estimated by Caco-2 cell methodology is 1.92 × 10⁻⁵ cm/s. Based on the poor solubility and good permeability, CIL is classified as a class II drug as per the Biopharmaceutics Classification System (BCS), which indicate that its absorption is dissolution dependent (21,22). CIL has a half-life of approximately 11–13 h and is approved as immediate release tablets (only formulation) in the US and several European countries under the brand name Pletal® tablets (50 and 100 mg) for the treatment of intermittent claudication with twice a day dosing regimen. Apart from active ingredient, the immediate release tablets also contain carboxymethylcellulose calcium, corn starch, hydroxypropyl methylcellulose, magnesium stearate, and microcrystalline cellulose (21–23). Furthermore, it has been demonstrated that orally administered CIL is absorbed mainly in the upper gastrointestinal tract (Tmax is 2–4 h) and its absorption decreases as it moves to the lower part of gastrointestinal tract. Hence, it is not surprising that the currently marketed formulations of CIL are rapid release tablets because a conventional controlled release formulation limits the absorption time at the desired site of absorption. However, such a rapid release formulation can induce side effects like suppression of the blood coagulation, the promotion of the central blood circulation, inflammation and ulceration actions, depression of blood pressure, the prevention and treatment of asthma and cerebral infarction, and the improvement of the cerebral circulation by suppressing platelet coagulation and dilating the arteries (24).
Amid these backgrounds, it is highly anticipated to develop a controlled release formulation of CIL for once a day administration. However, a conventional system of controlling the release of CIL may not work because of the poor solubility and absorption from the lower part of gastrointestinal tract (25). Hence, a combination of solid dispersion and controlled release techniques appears promising for this objective as supersaturation of drug can be achieved using this methodology. Conversely, it has been known in the prior art that maintaining supersaturation level is difficult for longer duration of time (for controlled release formulations) as the amorphous drug recrystallizes in the presence of water (26). Therefore, in the present study, to evade the recrystallization of CIL from the controlled release formulation, disintegration mediated wax matrix controlled release system was selected. In this system, povidone (PVP) was selected as a carrier (to prepare the amorphous solid dispersion), hydrogenated vegetable oil (HVO; a wax) as the controlled release component, and sodium carboxymethyl cellulose (NaCMC) as the disintegrant to develop the disintegration mediated wax matrix controlled release tablets. HVO, the major release controlling component, is safe and approved as per USFDA for 261 mg as maximum daily intake by oral route (http://www.accessdata.fda.gov/scripts/cder/iig/getiigWEB.cfm). Conceptually, the waxy material confines the penetration of water to the surface layer of the tablet, and the disintegrant swells with the penetrated water, and then SD (solid dispersion) granules located on the surface leaches out from the tablet and enter into dissolution medium. This process of tablet surface penetration by water, swelling of disintegrant, and leaching out of SD granules continues and ensures the complete release of CIL. The prepared disintegration mediated controlled release tablets of CIL were evaluated for dissolution profiles and x-ray diffraction studies to understand and endorse the concept.
MATERIAL AND METHODS
Materials
Cilostazol (CIL) was a generous gift from Daewoong Pharmaceuticals Co. (Hyderabad, India). Povidone (Plasdone® K-29/32) and sodium carboxymethyl cellulose (Blanose® 7MF-PH) were purchased from ISP Corporation, India. Microcrystalline cellulose (Avicel® PH 101) was purchased from FMC Biopolymer, India; while hydrogenated vegetable oil (Cutina® HR) was purchased from BASF India and magnesium stearate (vegetable grade) from Ferro Corporation, India. Acetonitrile, methanol, and water (all HPLC grade) were procured from Merck. All other chemicals were of laboratory reagent grade.
Preparation of Solid Dispersion
A binary (CIL and povidone) solid dispersion in 1:4 composition was prepared by spray drying technology using a laboratory-scale instrument (LU-228 Advanced spray drier, Labultima, Mumbai, India). The drug and polymer were dissolved in dichloromethane (10% w/w). The spray dryer was equipped with a spray nozzle of 0.7-mm diameter and a peristaltic pump to feed the substrate. The solutions were sprayed using a feed rate of 2–5 g/min, at an atomization pressure of 0.8 bars, an inlet temperature of 130°C, and an outlet temperature of 80°C.
Preparation of Disintegration Mediated Controlled Release Tablets
To prepare disintegration mediated controlled release (DMCR) tablets, HVO was melted at 70–80°C in stainless steel container in a paraffin bath using controlled heating. To this melted HVO, CIL, or CIL and povidone (in control trials); or solid dispersion (in model formulations) was added along with NaCMC and MCC; and mixed with stainless steel rod to ensure proper mixing. The mixed melt was immediately cooled in ice bath maintained around 5°C. The cooled material was milled using mortar and pestle and screened through sieve no. 30 (600 microns). The sieved material was mixed with magnesium stearate to prepare the lubricated blend for compression. The lubricated blend in all the compositions was white to off-white in color and had good flow with compressibility index ranging from 22 to 25%. The lubricated blends were compressed using eight-station rotary compression machine (Karnavati Engg, Ahmedabad, India) with convex punches of 22.5 × 9-mm dimensions into tablets of 900-mg weight. The target hardness was kept around 15–20 kP and yielded in tablets with friability less than 0.3% (100 revolutions; at 25/4 min).
Experimental Design
For optimizing the release profile of the solid dispersion based disintegration mediated controlled release tablet formulation and evaluation of the influence of each variant on dissolution profile, the extreme vertices mixture design (EVMD) was applied (27) using Minitab® 16.0 software. The three variants for this design were HVO (X1), NaCMC (X2), and MCC (X3). The total amount of these variants (X1 + X2 + X3) was maintained constant at 390 mg. The critical variant and response variables are listed in Table I. The range of each composition variable was assessed based on the preliminary experiments executed for designing and developing the disintegration mediated controlled release tablets.
Table I.
Variants in the Extreme Vertices Mixture Design
| Formulation variables | Levels (mg) | ||
|---|---|---|---|
| Low | High | ||
| X 1 | Fraction of HVO in total excipients | 50 | 300 |
| X 2 | Fraction of NaCMC in total excipients | 0 | 20 |
| X 3 | Fraction of MCC in total excipients | 70 | 340 |
| Response variables | Constraints | ||
| Y 1h | Percent dissolved in 1 h | 05% ≤ Y 1h ≤ 25% | |
| Y 4h | Percent dissolved in 4 h | 40% ≤ Y 1h ≤ 60% | |
| Y 8h | Percent dissolved in 8 h | 65% ≤ Y 1h ≤ 85% | |
| Y 12h | Percent dissolved in 12 h | 90% ≤ Y 1h ≤ 110% | |
The amount of solid dispersion (CIL and PVP in 1:4) was fixed at 500 mg. The amount of total excipients was fixed at 390 mg. X1 + X 2 + X3 = 390 mg
According to EVMD, 14 model formulations were randomly designed by Minitab® wherein the design was selected with 2 degree of freedom, augmented at center and axial points and replicated at center point. The drug release percent at 1, 4, 8, and 12 h were selected as response variables to detect the burst effect and ensure complete drug release. The composition of all model formulations is summarized in Table II along with the respective responses for dissolution time point.
Table II.
The Composition and Responses of Model Formulations
| Run | X 1 (HVO) | X 2 (NaCMC) | X 3 (MCC) | Y 1h | Y 4h | Y 8h | Y 12h |
|---|---|---|---|---|---|---|---|
| 1 | 50.00 | 10.00 | 330.00 | 72 | 100 | 101 | 101 |
| 2 | 237.50 | 5.00 | 147.50 | 4 | 27 | 55 | 81 |
| 3 | 175.00 | 10.00 | 205.00 | 8 | 32 | 62 | 95 |
| 4 | 300.00 | 20.00 | 70.00 | 11 | 36 | 73 | 100 |
| 5 | 175.00 | 0.00 | 215.00 | 6 | 29 | 52 | 78 |
| 6 | 300.00 | 10.00 | 80.00 | 5 | 29 | 47 | 69 |
| 7 | 175.00 | 20.00 | 195.00 | 21 | 60 | 99 | 100 |
| 8 | 112.50 | 5.00 | 272.50 | 11 | 54 | 88 | 99 |
| 9 | 50.00 | 0.00 | 340.00 | 69 | 99 | 100 | 101 |
| 10 | 300.00 | 0.00 | 90.00 | 0 | 8 | 24 | 40 |
| 11 | 50.00 | 20.00 | 320.00 | 85 | 100 | 101 | 101 |
| 12 | 112.50 | 15.00 | 262.50 | 15 | 63 | 94 | 101 |
| 13 | 237.50 | 15.00 | 137.50 | 7 | 35 | 81 | 99 |
| 14 | 175.00 | 10.00 | 205.00 | 6 | 28 | 57 | 91 |
Data Analysis
Model Fitting
The drug release (in percent) at 1, 4, 8, and 12 h (responses) of all model formulations were analyzed by Minitab® software. For a three component mixture design, specific models studied were linear, quadratic, and special cubic. The mathematical model, fitting the data best, was selected based on the comparisons of several statistical parameters including the standard error of estimate (S), the multiple correlation coefficient (R2), adjusted multiple correlation coefficient (adjusted R2), and the predicted residual sum of square (PRESS). Among them, PRESS indicates how well the model fits the data, and for the chosen model, it should be small in comparison to the other models (28).
Linear model
| 1 |
Quadratic model
| 2 |
Special cubic model
| 3 |
Release Kinetics
To evaluate the release kinetics, different kinetic equations (zero-order, first-order, and Higuchi and Hixson-Crowell equation) were applied. The best fit with higher correlation (r2 > 0.98) was considered for selecting the specific release kinetics for the individual formulation. Furthermore, in order to understand the mechanism of drug release from the solid dispersion based disintegration mediated wax matrix system, the dissolution data of the optimized formulation was fitted according to the well-known exponential Korsmeyer-Peppas equation (29), which is often used to describe the drug release:
| 4 |
Where Mt/M∞ is the fraction of drug release at time t, and k is the kinetic constant, n is the release exponent. The release exponent (n) is used in general to assess the mechanism of drug release from different kind of matrix systems; however, for determining this exponent, one should use only the initial portion of the release curve (Mt/M∞ < 0.6). For tablets, n value between 0.43 and 0.5 indicates Fickian (case I) diffusion-mediated release, for n value between 0.5 and 0.89 non-Fickian (Anomalous) release, coupled diffusion and polymer matrix relaxation, for n = 1 (zero-order kinetics) represents purely matrix relaxation or erosion-mediated release, while n is typically >0.89 for super case II type (first-order) (30).
Evaluation of Similarity Factor of Release Profiles
To compare the release profiles of CIL, the similarity factor (f2) was calculated per the following equation (30)
| 5 |
Where Rt and Tt are the percent drug dissolved at each time point for the sample and the reference products, respectively, n is the number of dissolution sampling points, and t is the time sample index. The two dissolution profiles are considered similar when the f2 value is more than 50 (50 < f2 < 100).
Disintegration Test
The disintegration test was carried out as per the United States Pharmacopeia (USP). One tablet was tested in 900 mL of purified water with 0.3% SLS, which was maintained at 37 ± 0.5°C. At each sampling time, an aliquot of the dissolution medium was withdrawn for testing the concentration of CIL, and the tested DCMT was removed from the beaker. The tablet was dried at 30°C till a constant weight was achieved, and the amount of disintegration (% disintegrated) was calculated on weight basis and the concentration of CIL in the aliquot was measured by at 257 nm using double-beam UV–vis spectrophotometer (Shimadzu, UV-2450).
Dissolution Studies
Dissolution studies were conducted using the US Pharmacopeia (USP) apparatus II, paddle stirring method at a speed of 50 rpm (Electrolab, TDT-08 L, Mumbai, India). Dissolution media (degassed and maintained at 37 ± 0.5°C) used was 900 mL of water with 0.3% SLS. Dissolution samples were analyzed at 257 nm using double-beam UV–vis spectrophotometer (Shimadzu, UV-2450). Dissolution samples were collected at 1, 2, 4, 6, 8, 10, and 12 h through 0.45 μm nylon membrane filter (Axiva, SF1510613, India) and suitably diluted. The volume of dissolution medium was adjusted to 900 mL with 5 mL of fresh dissolution medium for the 5 mL aliquot withdrawn for testing. A stock solution was prepared in 100-mL volumetric flask by dissolving 45 mg of CIL in 5 mL of methanol and sonicated for 3 min and then the volume was made up with diluent (water and methanol in 4:1). Standard was prepared by diluting 2 mL of stock solution and 2 mL of dissolution media in 50-mL volumetric flask and making the volume with diluent. For all the dissolution studies, each test was conducted on 6 units. The mean and SD of dissolved percent were calculated.
X-ray Powder Diffraction
The X-ray powder diffraction (pXRD) solid-state pattern of CIL, placebo tablets, and product tablets was measured with D8 Advance (Bruker, USA) using an online recorder (PM 8203A). Radiations were generated from CuKα source and filtered through Ni filters with a wavelength of 0.154 nm at generator current of 20 mA and voltage of 35 kV; while LynxEye being the detector. The instrument was operated over the 2θ range of 2–50° at step size of 0.015°.
Stability Studies
To assess the stability of the prototype formulation, tablets were packed and induction sealed in HDPE bottles. The packaged tablets were exposed to accelerated conditions of 40°C/75% RH for a period of 6 months. The initial and exposed stability samples were tested for XRD and dissolution studies.
RESULTS AND DISCUSSION
Design and Development of 12-H Release Profile
In order to design a slid dispersion based controlled release tablet formulation for once a day administration, a disintegration mediated controlled release system was selected so that the amorphous CIL is maintained in supersaturation state for longer duration and to prevent recrystallization for the desired period of time (26). For preparing, solid dispersion of CIL, povidone was selected as the carrier based on previous work (31). To design the disintegration mediated controlled release system, HVO was selected as the matrix former to extend the release and NaCMC as disintegrating agent so that the waxy material limits the penetration of water to the surface layer of tablet, and the disintegrant swells with the penetrated water and allows SD granules (containing amorphous CIL) located on the tablet surface to leach out into the dissolution medium. A constant rate of tablet disintegration can be achieved by repeating the processes of water penetration and swelling/separating of SD granules. Since the design concept was selected with solid dispersion plus wax matrix tablet, vital emphasis was assigned on the selection of diluent to improve the compressibility of this kind of tablet formulation. Hence, for this reason, MCC was selected as the diluent (32).
To evaluate this design concept, few formulations were made containing solid dispersions as well as the controls along with placebo. Two control formulations were made; one with crystalline CIL (no povidone; D1) and another containing mixture of crystalline CIL and povidone (D2). The formulations D3 and D4 represent the compositions having CIL in amorphous state made by solid dispersion using spray drying technology. A placebo formulation (CIL absent; D5) was prepared using the same manufacturing process to assess and compare the crystalline versus amorphous nature of the formulations. The composition details of these formulations are detailed in Table III. These formulations were evaluated for dissolution profile and XRD studies. To conclude and make decision, in addition to the designed formulations, CIL (crystalline), solid dispersion of CIL (with povidone), and placebo were also evaluated for XRD.
Table III.
Composition for Assessing the Disintegration Mediated Controlled Release Design
| S. no. | Compositions | D1 | D2 | D3 | D4 | D5 |
|---|---|---|---|---|---|---|
| Ingredient | mg/tab | mg/tab | mg/tab | mg/tab | mg/tab | |
| 1 | CIL | 100.00 | 100.00 | |||
| 2 | PVP | 400.00 | 400.00 | |||
| 3 | SD (CIL:PVP::1:4) | 500.00 | 500.00 | |||
| 4 | HVO | 250.00 | 250.00 | 250.00 | 150.00 | 250.00 |
| 5 | NaCMC | 5.00 | 5.00 | 5.00 | 15.00 | 5.00 |
| 6 | MCC | 535.00 | 135.00 | 135.00 | 225.00 | 235.00 |
| 7 | Magnesium stearate | 10.00 | 10.00 | 10.00 | 10.00 | 10.00 |
| Tablet weight | 900.00 | 900.00 | 900.00 | 900.00 | 900.00 |
Figure 1 depicts the comparative XRD patterns of these formulations along with the XRD patterns of pure crystalline CIL, solid dispersion of CIL, and PVP (1:4) and placebo. It was observed from the XRD patterns that the representative peak of CIL in the region of 9–24° of 2-theta values is radically different from the representative peaks of placebo matrix. In addition to this, the XRD spectra of solid dispersion follows a hallow pattern confirming the absence of any crystalline behavior of CIL. Furthermore, in formulation D1 and D2, where no solid dispersion was attempted to have CIL in amorphous state, the representative peak of CIL in the region of 9–24° of 2-theta are well exhibited and confirms that CIL is indeed present in crystalline from. In comparison to the formulations D1 and D2, the formulation D3 follows the XRD pattern observed in case of placebo and confirming that the amorphous nature of CIL because of solid dispersion approach was maintained in tablet as well even after processing through hot melt granulation (33,34).
Fig. 1.
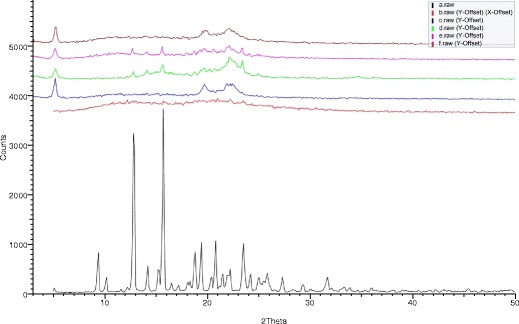
XRD pattern of drug (a), solid dispersion (b), placebo-D5 (c), designed formulation D1 (d), designed formulation D2 (e), and designed formulation D3 (f)
The dissolution profiles of the four formulations are depicted in Fig. 2. From the comparative dissolution profiles, it was observed that while the solid dispersion based formulations (D3 and D4) resulted in complete release of CIL, the formulations not having CIL in amorphous state did not exhibit complete release (D1 and D2) even in the presence of sufficient sink conditions. Even though the composition of formulation D1, D2, and D3 was similar except the presence or absence of amorphous state of CIL, still the extent of drug release in D1 and D2 formulations was just around 30%. This aspect for poor drug release from these matrices may be correlated with the importance of wettability (35–37). Since the crystalline form is poorly water soluble and formulating this form into wax-based matrix does not allow the drug to get wet and available for diffusion through the insoluble wax matrix. Such issue of poor solubility is generally resolved by incorporating solubilizers or surfactants in the wax matrix or making use of amorphous drug or have drug in amorphous state by solid dispersion technique. Furthermore, the comparative release profile of formulations D3 and D4 was significantly different (f2-factor <50), even though complete drug release was observed in both these formulations, and this aspect can be correlated with the compositional difference between these formulation indicating the role of HVO and NaCMC to tailor the release profile. On the basis of the XRD study and dissolution profiling, it was concluded that using solid dispersion technique supersaturation can be achieved for a poorly water-soluble drug and the same state can be maintained in wax-based matrix tablet. On the contrary, without supersaturation of drug, the drug release does not happen as the wax matrix does not allow the insoluble drug to come out of the wax matrix. Furthermore, the release profile of CIL in disintegration mediated wax matrix can be tailored by optimizing the levels of HVO and NaCMC.
Fig. 2.
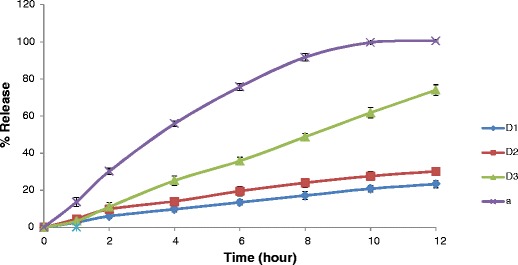
Comparative dissolution profiles of designed formulations
Optimization of 12-H Release Profile
In accordance with the above studies, to tailor the release profile of solid dispersion based disintegration mediated wax matrix, both hydrogenated vegetable oil (HVO) and NaCMC are critical components. Furthermore, since this is a wax-based matrix and contains solid dispersion in good amount (50% of 900 mg tablet), the selection of diluent is another key component to provide sufficient compressibility of the final blend. In the preliminary experimentation, it was found that at least 5% of MCC is required to provide sufficient hardness to such big size tablets. Therefore, HVO, NaCMC, and MCC were selected as the study variables. To achieve the prototype formulation with 12-h release profile by optimizing the raw formulation with these three components, an extreme vertices mixture design was applied. The 14 runs (Table II) of the design were fabricated and analyzed for the dissolution profiles (Figs. 3, 4, and 5).
Fig. 3.
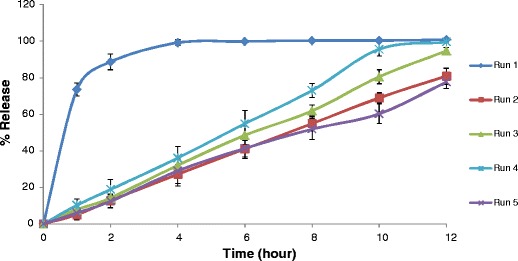
Comparative dissolution profiles of experimental run 1–5
Fig. 4.

Comparative dissolution profiles of experimental run 6–10
Fig. 5.

Comparative dissolution profiles of experimental run 11–14
For an optimal controlled release dosage form, a minimal burst effect for most of the period of drug being release and finally a complete release is required in the specified period. To obtain an optimally controlled release of CIL (in amorphous supersaturate state), an EVMD utilizing polynomial equations was applied. The casual factors for the EVMD were HVO (X1), NaCMC (X2), and MCC (X3) and the response variable were the drug release (%) at 1, 4, 8, and 12-h time points (Table II). The wide differences for the response variables (Y1h, Y4h, Y8h, and Y12h) indicated that the factor combinations resulted in different drug release rates. The casual and response variables were related using the polynomial equation and statistical analysis through Minitab® software. As depicted in Table IV, the approximation of the response components was better described by quadratic model in comparison to linear and special cubic models because its PRESS was smallest in comparison to other factors like S, R2, and adjusted R2.
Table IV.
Optimal Regression Equation for each Response Variable
| Model | Coefficient | Y 1h | Y 4h | Y 8h | Y 12h |
|---|---|---|---|---|---|
| b1(X 1) | 46 | 26 | −1 | 7 | |
| b2(X 2) | 9705 | 5018 | 5270 | −4325 | |
| b3(X 3) | 107 | 136 | 116 | 107 | |
| b12 (X 1 X 2) | −10234 | −4568 | −3990 | 6,245 | |
| b13 (X 1 X 3) | −306 | −227 | −21 | 67 | |
| B23 (X 2 X 3) | −9778 | −5106 | −5486 | 4,346 | |
| b123 (X 1 X 2 X 3) | 197 | 2,825 | 3,715 | −1663 | |
| Linear | S | 18.91 | 14.26 | 11.31 | 10.79 |
| R 2 | 0.6419 | 0.8148 | 0.8221 | 0.6823 | |
| Adjusted R 2 | 0.5767 | 0.7811 | 0.7898 | 0.6245 | |
| PRESS | 6,963.18 | 3763.68 | 2,528.04 | 2,798.92 | |
| Quadratic | S | 9.97 | 7.26 | 9.26 | 4.14 |
| R 2 | 0.9275 | 0.9651 | 0.9132 | 0.9659 | |
| Adjusted R 2 | 0.8822 | 0.9433 | 0.8589 | 0.9446 | |
| PRESS | 2,462.15 | 1,955.48 | 2,239.08 | 510.958 | |
| Special cubic | S | 10.66 | 6.96 | 8.81 | 3.94 |
| R 2 | 0.9276 | 0.9719 | 0.9312 | 0.9730 | |
| Adjusted R 2 | 0.8655 | 0.9479 | 0.8722 | 0.9498 | |
| PRESS | 4,842.10 | 2,854.08 | 1,822.74 | 517.368 | |
| Regression equations of the fitted (quadratic) modela
Y 1h = 0.11 X1 + 24.883X2 + 0.275X3 − 0.067 X1X2 − 0.002X1X3 − 0.064 X2X3 Y 4h = 0.067X1 + 12.866X2 + 0.347X3 − 0.030 X1X2 − 0.001X1X3 − 0.034 X2X3 Y 8h = − 0.003X1 + 13.510X2 + 0.298X3 − 0.026 X1X2 − 0.001X1X3 − 0.036 X2X3 Y 12h = 0.018X1–11.091X2 + 0.274X3 + 0.410 X1X2 + 0.001X1X3 + 0.028 X2X3 | |||||
aOnly the terms with statistical significance are included
The combined effect of casual factors on the individual response variable is depicted in the contour plots (Fig. 6a–d). The contour plots are very expressive to project the effect of the different casual factors on the specific response variable. A positive sign on coefficient indicates a synergistic effect while a negative sign indicates an antagonistic effect on the response. A larger coefficient value means that the casual factor has more dominating influence on the response. In accordance with Table IV, individually, NaCMC (X2) plays a major role in designing the drug release at dissolution time points of 1, 4, and 8 h because being a disintegrant, it has to continuously help the matrix to leach out from the tablet surface and make the drug available for dissolution, and its role becomes less important at 12-h time point where most of the matrix is already disintegrated. In comparison to NaCMC, individually, the HVO (X1) is dominating at 1- and 4-h time points where it helps to control the drug release due to its hydrophobic nature (wax matrix). Furthermore, as the tablet matrix disintegrates more than 50% at 8- and 12-h time points, its role becomes insignificant. Individually, MCC (X3) appears significant; however, its role remains the same throughout the dissolution period as it is added for better compressibility and it may not be affecting the dissolution profile. For the interaction parameters, X1X2, X2X3, and X1X3, the statistics prove that while all the three parameters act antagonistic to control the release profile at 1-, 4-, and 8-h time points, all the three factors are synergistic for complete (or nearly complete) release at 12-h time point. This appears obvious in the outlook that while HVO has strong binding affinity (wax matrix) to control the release, whereas both NaCMC and MCC has disintegrating property to break the matrix. Using the dissolution data of the model 14 formulations, the contour plots were generated at 1, 4, 8, and 12 h along with overlay contour plot (Fig. 6a–e).
Fig. 6.
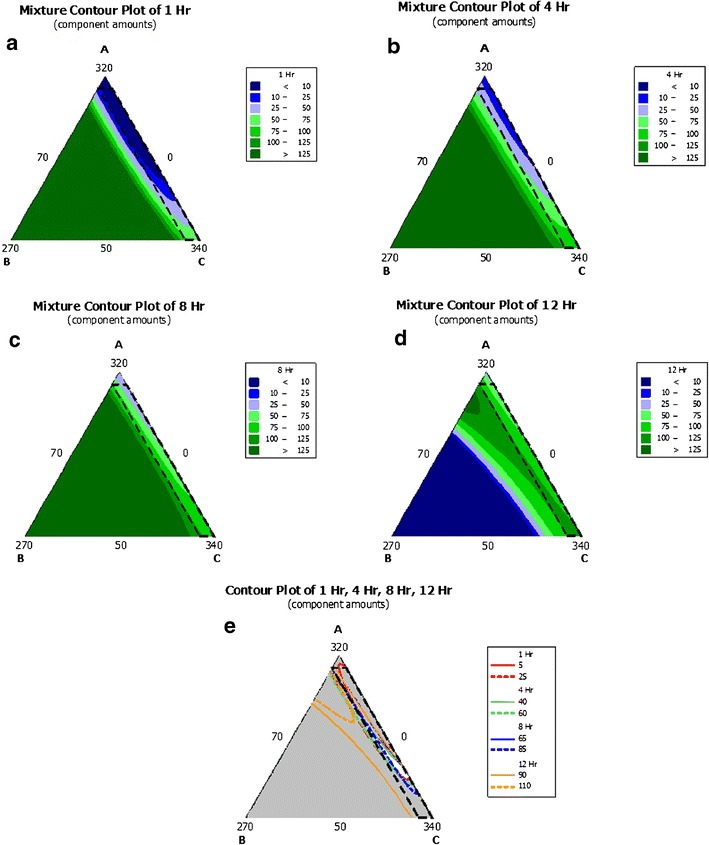
a–e The triangular-dimensional contour diagrams illustrating the effect of HVO, NaCMC, and MCC on the release of Cilostazol; a 1-h drug release percent, b 4-h drug release percent, c 8-h drug release percent, d 12-h drug release percent, and e overlay plot
Conventionally, for a specified period of time, an optimal controlled release formulation must maintain a minimal burst effect for initial phase, a controlled behavior for longer duration, and should release more than 85% of drug at the last time point. Therefore, the range of responses of controlled release matrix tablet were restricted to 5% < Y1h < 25%; 40% < Y4h < 60%; 65% < Y8h < 85%; 90% < Y12h < 110% (Table I). Setting these as the target constraint response for the optimal dissolution profile, the Minitab® software computed (using response optimizer) a global solution with X1, X2, and X3 values of 137.21, 8.28, and 244.50 mg, respectively (overall desirability of about 85%), to yield drug release response at Y1h, Y4h, Y8h, and Y12h of 15.15, 47.71, 75.99, and 97.33%, respectively (Fig. 7). To verify these values, the global solution (optimum formulation) was prepared according the above values of the factors and subjected to the dissolution test. The dissolution profiles of the optimized and predicted formulations are presented in Fig. 8.
Fig. 7.
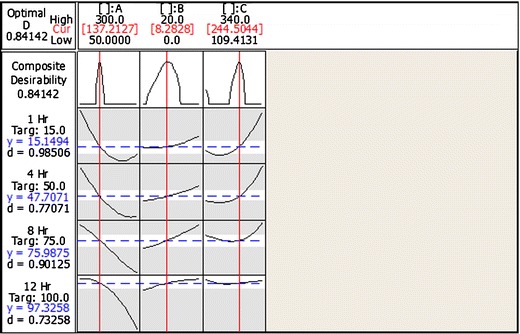
Optimization plot for the best formulation
Fig. 8.

Comparative dissolution profiles of predicted and observed formulations
Both profiles were compared using the USFDA recommended similarity factor (f2), and the value of f2 was 74 and above the critical value (50) indicating an equivalence to the release profile of the optimum formulation and the predicted profile. This clearly establishes that optimization by using EVMD is advisable for optimizing solid dispersion based disintegration mediated controlled release matrix tablet of poorly water-soluble drugs. To further understand the dissolution behavior of this solid dispersion based disintegration mediated wax matrix, disintegration test was performed in purified water with 0.3% SLS to have sufficient sink conditions. The samples were collected from the batch after 1, 2, 3, 4, 6, 8, 10, and 12 h and analyzed for drug release and compared the dissolution profile against the predicted one as shown in Fig. 8. The dissolution profile generated from the disintegration test was faster than the predicted dissolution profile; however, it was not statistically different as per the similarity factor (f2 = 56). Contrary to this, the dissolution profile generated from the disintegration test was significantly different (f2 = 49) from the one observed in the dissolution apparatus for the same formulation. The faster dissolution profile as per the disintegration test may be because of the vigorous shear design of the disintegration apparatus as compared to the dissolution apparatus.
Release Rate Kinetics
As per the cumulative percent drug released versus time plots, while formulation runs 2, 3, 4, 5, 10, and 14 followed zero-order, run 6 and 13 followed Higuchi’s, and run 1, 6, 7, 8, 9, 11, and 12 followed Hixson-Crowell release kinetics, none of the formulation run followed first-order release kinetics (Table V). For all the 14 design formulations, the correlation coefficient (r2) for the selected release rate kinetics ranged from 0.724 to 0.998. Overall, this design concept (solid dispersion based disintegration mediated wax matrix) appears to be following mixed release behavior of drug diffusion (Higuchi), drug dissolution (zero-order), and surface erosion (Hixson-Crowell) and which correlates with that even though CIL is a poorly water-soluble drug, and its design into amorphous solid dispersion provides it in supersaturated state which allows it to follow zero-order rate kinetics. Furthermore, because of the wax-based matrix and disintegration mediation, the supersaturated amorphous CIL has the tendency to diffuse (Higuchi), as well as surface erosion (Hixson-Crowell).
Table V.
Release Rate Constant and Linearity of CIL Release Formulations
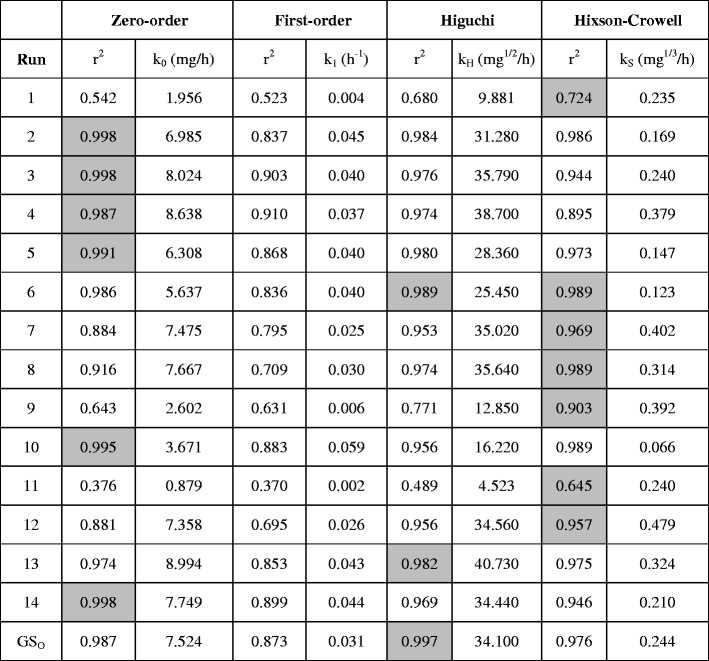
Highlighted grey cell indicates the release kinetics a particular formulation run follows
GS O global solution observed
Conventionally, mechanism of drug release from wax matrices has been a matter of debate since wax-based matrix systems tend to be crude and more heterogeneous than other kind of matrixes. For example, in some cases, it has been reported that the mechanism of release from wax matrices involves the leaching of drug by the eluting medium, while others indicated that it is diffusion controlled and is best described by Higuchi model (30,38). In the current study, the release exponent (n) of the optimized solid dispersion based disintegration mediated wax matrix (Global solution observed; GSo) was 0.85 (r2 = 0.999 and K = 0.132), suggesting a non-Fickian (anomalous) release, with reasonably an equal preponderance of the diffusion and zero-order mechanisms. Furthermore, for this optimized formulation, as per different drug release constant (Table V), it is best described by Higuchi’s equation (r2 = 0.997).
Stability Studies
In the previous section, it was found that solid dispersion of CIL and povidone produced CIL in amorphous phase as confirmed by the XRD study, and when this solid dispersion was used to prepare the disintegration mediated controlled release tablet, it helped to maintain CIL in supersaturation state and provided a 12-h release profile which followed Higuchi release kinetics. It was a good outcome of designing the 12-h release profile of CIL by making its solid dispersion with povidone and converting the solid dispersion into disintegration mediated controlled release tablet. Furthermore, it was established with dissolution testing that this system provided release profile consistently for 12-h due to the supersaturation state of CIL being maintained in the tablet dosage from during the dissolution run. As it is known in the prior art that amorphous systems are inclined to solid-state conversion and it is not uncommon of amorphous form to convert into low-energy crystalline state during shelf-life due to individual or multivariate effect of temperature, moisture, light, etc. Hence, monitoring the physical or solid state stability of amorphous systems is imperative (39). To assess the impact of heat, moisture, and storage period, the prototype formulation (global solution observed; GSo) was studied for stability as per International Conference on Harmonization (ICH) recommendations (40) in sealed HDPE bottle pack at accelerated conditions of 40°C/75% RH for a period of 6 months and with testing plan of initial, 1, 3, and 6 months. The exposed stability samples were studied for dissolution profile to assess the impact on release profile and XRD study for assessing any solid-state conversion.
The dissolution profile of exposed samples were compared to the dissolution profile at initial stage and it was observed that there was no significant change in the dissolution profile when the prototype formulation was exposed to accelerated conditions of 40°C/75% RH for a period of 6 months in sealed HDPE bottle pack (Fig. 9). The comparison of dissolution profile was done by calculating the similarity factor (f2-factor) and it was observed that the f2-factor for 1-, 3-, and 6-month samples were, respectively, 75, 88, and 56. An f2-factor of more than 50 indicates similarity of drug release. Furthermore, the release profile for the 6-month samples was slightly slower than the release profile at initial stage; however, statistically, it is not significant (f2 > 50). To further asses and understand the solid-state characteristics of the prototype formulation, the XRD pattern of the exposed samples (1, 3, and 6 months) was quite similar to the XRD pattern of the initial samples (Fig. 10) and the representative peak of CIL in the region of 9–24° of 2-theta values were not observed for 1 and 3 months exposed samples, confirming the absence of any presence of crystalline phase of CIL (33). However, in the case of 6-month exposed sample, a tendency of appearance of representative peak of CIL was seen indicating to the phase separation time of amorphous to crystalline conversion and this behavior correlates with the relatively slower dissolution profile of the 6-month exposed sample.
Fig. 9.

Comparative dissolution profiles of initial and exposed formulations in stability testing
Fig. 10.

XRD pattern of initial formulation (a) and exposed formulations—1 month (b), 3 months (c), and 6 months (d)
CONCLUSION
For developing a controlled release system for poorly water-soluble drug CIL, a solid dispersion based, disintegration mediated wax-based matrix was designed. Using this system, the release of CIL was controlled without recrystallization and complete release was attained. The wax matrix controlled the release, while disintegrant allowed the matrix to leach out from the tablet and to make the drug available for dissolution. The crude formulation was optimized by EVMD to predict the optimal formulation. The optimal formulation followed the Higuchi’s release rate constant and the mechanism of drug release was found to be diffusion of the drug (supersaturation) from the insoluble matrix. It was concluded that the disintegration mediated controlled release can be optimized with multiple response optimization utilizing polynomial equations. The predicted formulation was compared with the actual formulation regarding the dissolution profile and disintegration test release and found comparable. The optimized formulation was studied for stability in HDPE pack for a period of 6 months at accelerated conditions of 40°C/75% RH and concluded that the optimized formulation did not change significantly for dissolution profile and amorphous character of CIL in the formulation.
Acknowledgments
Conflict of Interest
The authors declare no conflict of interest.
References
- 1.Keserü GM, Makara GM. The influence of lead discovery strategies on the properties of drug candidates. Nat Rev Drug Dis. 2009;8:203–12. doi: 10.1038/nrd2796. [DOI] [PubMed] [Google Scholar]
- 2.Huanga L-F. Impact of solid state properties on developability assessment of drug candidates. Adv Drug Del Rev. 2004;56:321–34. doi: 10.1016/j.addr.2003.10.007. [DOI] [PubMed] [Google Scholar]
- 3.Kipp JE. The role of solid nanoparticle technology in the parenteral delivery of poorly water-soluble drugs. Int J Pharm. 2004;284:109–22. doi: 10.1016/j.ijpharm.2004.07.019. [DOI] [PubMed] [Google Scholar]
- 4.Singh A, Worku ZA, Van den Mooter G. Oral formulation strategies to improve solubility of poorly water-soluble drugs. Exp Opin Drug Deliv. 2011;8:1361–78. doi: 10.1517/17425247.2011.606808. [DOI] [PubMed] [Google Scholar]
- 5.Serajuddin ATM. Salt formation to improve drug solubility. Adv Drug Deliv Rev. 2007;59:603–16. doi: 10.1016/j.addr.2007.05.010. [DOI] [PubMed] [Google Scholar]
- 6.Serajuddin, A.T.M., Pudipeddi, M. Salt-selection strategies. In: Stahl PH, Wermuth CG, editors. Handbook of Pharmaceutical Salts Properties, Selection and Use. 2nd ed. Weinheim: Wiley-VCH; 2011. p. 135–160.
- 7.Yalkowsky SH. Solubility and Solubilization in Aqueous Media. New York: Oxford University Press; 1998. [Google Scholar]
- 8.Loftsson T, Duchene D. Cyclodextrins and their pharmaceutical applications. Int J Pharm. 2007;329:1–11. doi: 10.1016/j.ijpharm.2006.10.044. [DOI] [PubMed] [Google Scholar]
- 9.Yang T, Cui FD, Choi MK, Cho JW, Chung SJ, Shim CK, et al. Enhanced solubility and stability of PEGylated liposomal paclitaxel: in vitro and in vivo evaluation. Int J Pharm. 2007;338(1–2):317–26. doi: 10.1016/j.ijpharm.2007.02.011. [DOI] [PubMed] [Google Scholar]
- 10.Potta SG, Minemi S, Nukala RK, Peinado C, Lamprou DA, Urquhart A, et al. Development of solid lipid nanoparticles for enhanced solubility of poorly soluble drugs. J Biomed Nanotechnol. 2010;6:634–40. doi: 10.1166/jbn.2010.1169. [DOI] [PubMed] [Google Scholar]
- 11.Gullapalli RP. Soft Gelatin Capsules. J Pharm Sci. 2010;99:4107–48. doi: 10.1002/jps.22151. [DOI] [PubMed] [Google Scholar]
- 12.Tran PHL, Tran HTT, Lee B-J. Modulation of micro-environmental pH and crystallinity of ionisable Telmisartan using alkalizers in solid dispersions for controlled release. J Control Rel. 2008;129:59–65. doi: 10.1016/j.jconrel.2008.04.001. [DOI] [PubMed] [Google Scholar]
- 13.Singhal D, Curatolo W. Drug polymorphism and dosage form design: a practical perspective. Adv Drug Deliv Rev. 2004;56(3):335–47. doi: 10.1016/j.addr.2003.10.008. [DOI] [PubMed] [Google Scholar]
- 14.Chris Brougha RO, Williams III. Amorphous solid dispersions and nano-crystal technologies for poorly water-soluble drug delivery. Int J Pharm. 2013;453:157–66. doi: 10.1016/j.ijpharm.2013.05.061. [DOI] [PubMed] [Google Scholar]
- 15.Leuner C, Dressman J. Improving drug solubility for oral delivery using solid dispersions. Eu J Pharm Bhipharm. 2000;50:47–60. doi: 10.1016/S0939-6411(00)00076-X. [DOI] [PubMed] [Google Scholar]
- 16.Sekiguchi K, Obi N. Studies on absorption of eutectic mixture I: a comparison of the behaviour of eutectic mixture of sulfathiazole and that of ordinary sulfathiazole in man. Chem Pharm Bull. 1961;9:866–72. doi: 10.1248/cpb.9.866. [DOI] [Google Scholar]
- 17.Sekiguchi K, Obi N, Ueda Y. Studies on absorption of eutectic mixtures II: absorption of fused conglomerates of chloramphenicol and urea in rabbits. Chem Pharm Bull. 1964;12:134–9. doi: 10.1248/cpb.12.134. [DOI] [PubMed] [Google Scholar]
- 18.Chau Le-Ngoc V, Chulhun P, Beom-Jin L, Vo CL-N, Park C, Lee B-J. Current trends and future perspectives of solid dispersions containing poorly water-soluble drugs. Eu. J. Pharm. Bhipharm. 2013;85:799–813. doi: 10.1016/j.ejpb.2013.09.007. [DOI] [PubMed] [Google Scholar]
- 19.Huang J, Wigent RJ, Schwartz JB. Nifedipine molecular dispersion in microparticles of ammonio methacrylate copolymer and ethylcellulose binary blends for controlled drug delivery: effect of matrix composition. Drug Dev Ind Pharm. 2006;32:1185–97. doi: 10.1080/03639040600832827. [DOI] [PubMed] [Google Scholar]
- 20.Aceves JM, Cruz R, Hernandez E. Preparation and characterization of furosemide-Eudragit controlled release systems. Int J Pharm. 2000;195:45–53. doi: 10.1016/S0378-5173(99)00303-8. [DOI] [PubMed] [Google Scholar]
- 21.Money SR, Herd JA, Isaacsohn JL, Davidson M, Cutler B, Heckman J, et al. Effect of cilostazol on walking distances in patients with intermittent claudication caused by peripheral vascular disease. J Vasc Surg. 1998;27:267–75. doi: 10.1016/S0741-5214(98)70357-X. [DOI] [PubMed] [Google Scholar]
- 22.Shimizu T, Osumi T, Niimi K, Nakagawa K. Physico-chemical properties and stability of cilostazol. Arzneimittelforschung. 1985;35:1117–23. [PubMed] [Google Scholar]
- 23.Dawson DL. Comparative effects of cilostazol and other therapies for intermittent claudication. Am J Cardiol. 2001;87:19D–27. doi: 10.1016/S0002-9149(01)01673-3. [DOI] [PubMed] [Google Scholar]
- 24.Pratt CM. Analysis of the cilostazol safety database. Am J Cardiol. 2001;87:28D–33. doi: 10.1016/S0002-9149(01)01719-2. [DOI] [PubMed] [Google Scholar]
- 25.Jinno JJ, Kamada N, Miyake M, Yamada K, Mukai T, Odomi M, et al. Effect of particle size reduction on dissolution and oral absorption of a poorly water-soluble drug, cilostazol, in beagle dogs. J Control Rel. 2006;11:56–64. doi: 10.1016/j.jconrel.2005.11.013. [DOI] [PubMed] [Google Scholar]
- 26.Pokharkar VB, Mandpe LP, Padamwar MN, Ambike AA, Mahadik KR, Paradkar A. Development, characterization and stabilization of amorphous form of a low Tg drug. Powder Technol. 2006;167:20–5. doi: 10.1016/j.powtec.2006.05.012. [DOI] [Google Scholar]
- 27.Johnson AD, Anderson VL, Peck GE. A statistical approach for the development of an oral controlled-release matrix tablet. Pharm Res. 1990;7(10):1092–7. doi: 10.1023/A:1015911721455. [DOI] [PubMed] [Google Scholar]
- 28.Ho HO, Chen LC, Lin HM, Sheu MT. Penetration enhancement by menthol combined with a solubilization effect in a mixed solvent system. J Control Rel. 1998;51:301–11. doi: 10.1016/S0168-3659(97)00184-3. [DOI] [PubMed] [Google Scholar]
- 29.Korsmeyer RW, Gurny R, Doelker E, Buri P, Peppas NA. Mechanisms of solute release from porous hydrophilic polymers. Int J Pharm. 1983;15:25–35. doi: 10.1016/0378-5173(83)90064-9. [DOI] [PubMed] [Google Scholar]
- 30.Reza MS, Abdul Quadir M, Haider SS. Comparative evaluation of plastic, hydrophobic and hydrophilic polymers as matrices for controlled-release drug delivery. J Pharm Pharmaceut Sci. 2003;6:282–91. [PubMed] [Google Scholar]
- 31.Verma S and Rudraraju VS, A systematic approach to design and prepare solid dispersion of poorly water soluble drug, AAPS. Pharm. Sci. Tech. (doi:10.1208/s12249-014-0093-z). [DOI] [PMC free article] [PubMed]
- 32.Huang YB, Tsai YH, Yanga WC, Changa JS, Pao-Chu Wua PC, Takayamab K. Once-daily propranolol extended-release tablet dosage form: formulation design and in vitro/in vivo investigation. Eu J Pharm Biopharm. 2004;58:607–14. doi: 10.1016/j.ejpb.2004.03.037. [DOI] [PubMed] [Google Scholar]
- 33.Bley H, Fussneggerb B, Roland Bodmeiera R. Characterization and stability of solid dispersions based on PEG/polymer blends. Int J Pharm. 2010;390:165–73. doi: 10.1016/j.ijpharm.2010.01.039. [DOI] [PubMed] [Google Scholar]
- 34.Eerdenbrugh BV, Speybroeck MV, Mols R, Houthoofd K, Martens JA, Froyen L, et al. Itraconazole/TPGS/Aerosil®200 solid dispersions: characterization, physical stability and in vivo performance. Eu J Pharm Sci. 2009;38:270–8. doi: 10.1016/j.ejps.2009.08.002. [DOI] [PubMed] [Google Scholar]
- 35.Dredan J, Fekete R, Zelko R, Racz I, Marton S. Effect of the wettability characteristics of polyethylene glycol derivatives on the drug release of wax matrices. Pharmazie. 2000;55(12):925–7. [PubMed] [Google Scholar]
- 36.Peh KK, Wong CF, Yuen KH. Possible mechanism for drug retardation from glyceryl monostearate matrix system. Drug Dev Ind Pharm. 2000;26(4):447–50. doi: 10.1081/DDC-100101252. [DOI] [PubMed] [Google Scholar]
- 37.Dennis AB, Farr SJ, Kellaway IW, Taylor G, Davidson R. In vivo evaluation of rapid release and sustained release gelucire capsule formulations. Int J Pharm. 1990;65:85–100. doi: 10.1016/0378-5173(90)90013-T. [DOI] [Google Scholar]
- 38.Dakkuri A, Schroeder HG, Deluca PP. Sustained release from inert wax matrices II: Effects of surfactants on tripellenamine hydrochloride release. J Pharm Sci. 1978;67:354–8. doi: 10.1002/jps.2600670321. [DOI] [PubMed] [Google Scholar]
- 39.Strydoma S, Liebenberga W, Yub L, de Villiers M. The effect of temperature and moisture on the amorphous-to-crystalline transformation of stavudine. Int J Pharm. 2009;379:72–81. doi: 10.1016/j.ijpharm.2009.06.012. [DOI] [PubMed] [Google Scholar]
- 40.ICHQ1A (R2), Stability testing of new drug substances and products. International Conference on Harmonisation, Geneva, 2003.