Abstract
Total-variation (TV) minimization reconstructions can significantly reduce noise and streaks in thoracic four-dimensional cone-beam computed tomography (4D CBCT) images compared to the Feldkamp-Davis-Kress (FDK) algorithm currently used in practice. TV minimization reconstructions are, however, prone to over-smoothing anatomical details and are also computationally inefficient. The aim of this study is to demonstrate a proof of concept that these disadvantages can be overcome by incorporating the general knowledge of the thoracic anatomy via anatomy segmentation into the reconstruction. The proposed method, referred as the anatomical-adaptive image regularization (AAIR) method, utilizes the adaptive-steepest-descent projection-onto-convex-sets (ASD-POCS) framework, but introduces an additional anatomy segmentation step in every iteration. The anatomy segmentation information is implemented in the reconstruction using a heuristic approach to adaptively suppress over-smoothing at anatomical structures of interest. The performance of AAIR depends on parameters describing the weighting of the anatomy segmentation prior and segmentation threshold values. A sensitivity study revealed that the reconstruction outcome is not sensitive to these parameters as long as they are chosen within a suitable range. AAIR was validated using a digital phantom and a patient scan, and was compared to FDK, ASD-POCS, and the prior image constrained compressed sensing (PICCS) method. For the phantom case, AAIR reconstruction was quantitatively shown to be the most accurate as indicated by the mean absolute difference and the structural similarity index. For the patient case, AAIR resulted in the highest signal-to-noise ratio (i.e. the lowest level of noise and streaking) and the highest contrast-to-noise ratios for the tumor and the bony anatomy (i.e. the best visibility of anatomical details). Overall, AAIR was much less prone to over-smoothing anatomical details compared to ASD-POCS, and did not suffer from residual noise/streaking and motion blur migrated from the prior image as in PICCS. AAIR was also found to be more computationally efficient than both ASD-POCS and PICCS, with a reduction in computation time of over 50% compared to ASD-POCS. The use of anatomy segmentation was, for the first time, demonstrated to significantly improve image quality and computational efficiency for thoracic 4D CBCT reconstruction. Further developments are required to facilitate AAIR for practical use.
Keywords: cone-beam CT, image reconstruction, 4D imaging
1. Introduction
In image-guided radiation therapy (IGRT), the linear accelerator (linac)-mounted cone-beam computed tomography (CBCT) imaging unit allows the tumor position to be verified immediately prior to treatment. However, conventional three-dimensional (3D) CBCT suffers from motion blur in the thoracic region due to respiratory motion. Four-dimensional (4D) CBCT is an emerging imaging technique used to resolve tumor motion. In 4D CBCT, projection images are sorted into phase-correlated subsets (or “phase bins”) corresponding to different respiratory phases, from which temporally resolved images are reconstructed (Sonke et al, 2005). The use of 4D CBCT improves both target coverage and normal tissue avoidance in thoracic IGRT (Harsolia et al, 2008).
The reconstruction of high quality 4D CBCT images is difficult because of the sparse angular sampling caused by projection allocation. It was found in a previous study that the development of better reconstruction algorithms represents the most effective strategy for improving image quality in thoracic 4D-CBCT for IGRT applications at the current stage (Shieh et al, 2014). In current practice, projection images in each phase bin are reconstructed into a 3D volume using the Feldkamp-Davis-Kress (FDK) algorithm (Feldkamp et al, 1984), which is essentially an approximate filtered backprojection. Despite its computational efficiency, FDK produces severe noise and streaking artifacts in 4D CBCT images due to projection under-sampling. The Mckinnon-Bates method (Mckinnon and Bates, 1981; Leng et al, 2008a; Zheng et al, 2011) reduces noise and streaking by exploiting the motion blurred yet high signal-to-noise ratio (SNR) 3D CBCT image. However, the overall improvement in image quality is limited, and residual motion artifacts remain an issue (Bergner et al, 2010).
Total-variation (TV) minimization reconstruction has been shown to be efficient for noise and streaking reduction for CT and CBCT images (Sidky and Pan, 2008; Choi et al, 2010; Ritschl et al, 2011). A commonly used framework for iterative TV minimization reconstruction is the adaptive-steepest-descent projection-onto-convex-sets (ASD-POCS) algorithm (Sidky and Pan, 2008), which consists of iterative alternations between a projection-onto-convex-sets (POCS) component to enforce the data fidelity constraint and a TV minimization component to reduce noise/streaking. Although TV minimization reconstruction results in much less noise and streaking artifacts compared to FDK and MKB, it is prone to over-smoothing fine anatomical structures as the TV minimization component tends to reduce intensity variations due to both noise/streaking and anatomical structures indistinguishably. In addition, TV minimization reconstruction often converges slowly, making it computationally inefficient and unfeasible for clinical use (Bergner et al, 2010).
By incorporating certain prior knowledge of the volume of interest into the reconstruction, a noise- and streak-reduced yet sharper solution image and a better computational efficiency can be achieved. In the prior image constrained compressed sensing (PICCS) algorithm (Chen et al, 2008), prior knowledge is incorporated by imposing similarity between the solution image and a high SNR prior image. This additional constraint accelerates the convergence towards a solution image that shares similar high SNR traits with the prior image. In 4D CBCT, the motion blurred 3D CBCT image and the MKB image are suitable prior image choices (Leng et al, 2008b), as both are reasonable estimates of the reconstructed volume, and are higher in SNR than the FDK image. However, as the solution is often biased towards the prior image due to the stiff similarity constraint, the reconstruction may suffer from migration of residual motion artifacts and noise/streaking from the prior image (Bergner et al, 2010).
Another type of prior knowledge strategy involves the minimization of spatially adaptive TV. By applying a spatial weighting based on the gradient information of the image to the TV calculation, TV minimization can be suppressed adaptively at certain regions/pixels to preserve edges and structures. The gradient information exploited, such as the magnitude of the image gradient (Strong et al, 1997) or the difference curvature (Chen et al, 2010), can be viewed as the prior knowledge for edge detection. These strategies are widely applied in image restoration (Chantas et al, 2010; Dong et al, 2013; Yuan et al, 2013), and have also been demonstrated for low-dose CT reconstructions (Tian et al, 2011; Liu et al, 2012). However, gradient based edge detection is not robust to conspicuous artifacts and spatially inhomogeneous noise, both of which are commonly seen in 4D CBCT.
To adaptively suppresses over-smoothing of anatomical structures and reduce noise/streaking in TV minimization, our approach is to approximately identify anatomical structures of interest from the image and use them as a prior. The thoracic region consists of several distinct anatomical structures of interest in a CT or CBCT image: soft tissue, lungs/airways, bony anatomy, and pulmonary details tumors, vessels, and bronchus walls inside the lungs). These structures can be visually identified based on general a priori knowledge of the thoracic anatomy, i.e. the likely attenuation coefficients, positions, and shapes of each structure. By exploiting general anatomical knowledge, anatomical structures can also be automatically segmented via strategies such as intensity thresholding, connectivity analysis, region growing, and morphological operators (Haas et al, 2008; van Rikxoort et al, 2009; Volpi et al, 2009; Vandemeulebroucke et al, 2012). The use of a CT anatomy segmentation prior has been demonstrated for improving the performance of PET reconstruction (Chan et al, 2009, 2014). However, the use of a 4D CBCT anatomy segmentation prior is hindered by its relatively low accuracy due to the inferior image quality of 4D CBCT images, and, to the best of our knowledge, has not been previously investigated.
In this paper, we demonstrate a proof of concept that the use of a 4D CBCT anatomy segmentation prior can considerably improve 4D CBCT image reconstruction. We present a novel thoracic 4D CBCT image reconstruction method that improves on the blurry anatomy and low computational efficiency of conventional TV minimization methods. The proposed method, referred as the anatomical-adaptive image regularization (AAIR), is based on the ASD-POCS TV minimization framework, but with a heuristic anatomical-adaptive TV minimization step that utilizes a thoracic 4D CBCT anatomy segmentation method. Sec. 2 describes the theory, implementation and performance evaluation of AAIR. In Sec. 3, the effects of the reconstruction parameters on the performance of AAIR are studied. Then, AAIR was demonstrated with the reconstructions of a digital phantom and a patient scan, and compared qualitatively as well as quantitatively to FDK, ASD-POCS, and PICCS. Finally in Sec. 4, the limitations and potential future developments of AAIR are discussed.
2. Methods
2.1. The theory of AAIR
The core concept of AAIR is the use of general anatomical knowledge in the reconstruction via an anatomy segmentation prior. In this study, the anatomy segmentation prior is used to modify the ASD-POCS TV minimization framework, replacing the conventional TV minimization component with a heuristic anatomical-adaptive TV minimization component. In the following sections, the ASD-POCS TV minimization framework (cf. Sec. 2.1.1), the anatomical-adaptive TV minimization component (cf. Sec. 2.1.2), and the anatomy segmentation method (cf. Sec. 2.1.3) in AAIR are discussed. Finally, the implementation of AAIR is summarized in Sec. 2.1.4.
2.1.1. The ASD-POCS TV minimization framework
The AAIR method is based on the ASD-POCS TV minimization iterative framework, which is a constrained optimization method for solving a solution image with minimized TV. Denoting the image as f⃗, the measured projection data as p̃, and the forward projection operator as R, the constrained optimization problem is defined as
| (1) |
where ε is the maximum discrepancy between the projection data and the forward projections of the solution image, and TV is defined as
| (2) |
where
| (3) |
and where r, s, t are the three dimensional spatial indices.
The implementation of ASD-POCS consists of iterative alternations between two major components – the POCS component and the TV minimization component. The POCS component enforces the positivity constraint f⃗ ≥ 0 and the data fidelity constraint ‖Rf⃗ − p̃‖ ≤ ε in every iteration, and is realized by applying either an algebraic reconstruction technique (ART) (Gordon et al, 1970) or simultaneous algebraic reconstruction technique (SART) (Andersen and Kak, 1984) step. Following every POCS step, TV is minimized by a few iterations of gradient steepest-descent (GSD) steps. The TV GSD step is approximated by that derived in the literature (Niu and Zhu, 2012)
| (4) |
where δ is a small positive number to avoid singularities in the calculation, and was set to the machine epsilon (≈ 2 × 10⁻¹⁶) in this study. At the end of each iteration, the POCS step size and the TV minimization step size are adaptively reduced to achieve balance between the two components. Detailed descriptions of the step size reduction schemes can be found in Sidky and Pan (2008).
2.1.2. Anatomical-adaptive TV minimization
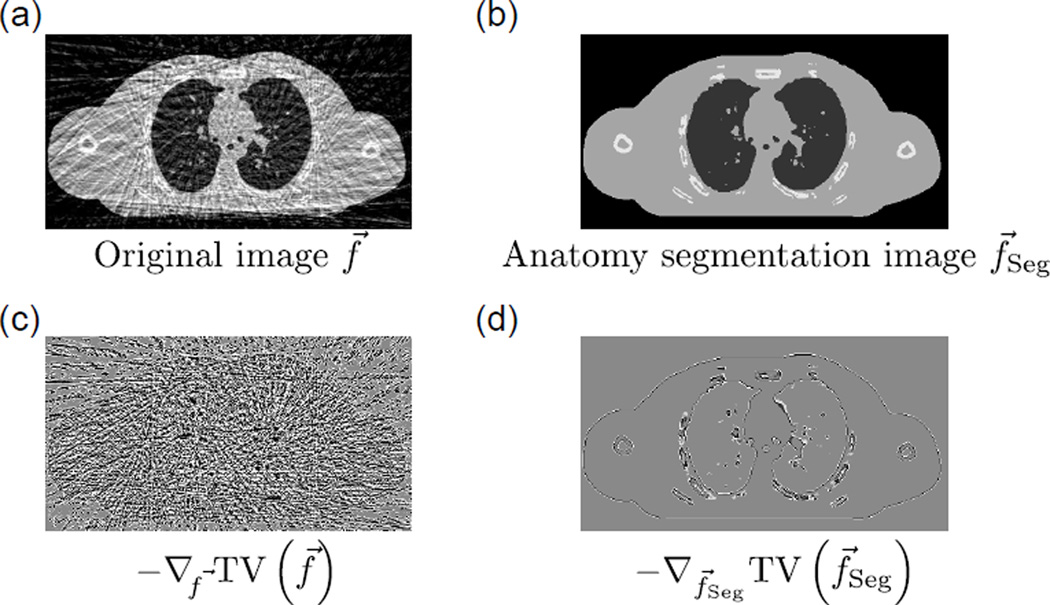
TV is essentially the sum of pixel intensity variations (cf. equation (2)) regardless of whether the intensity variation of a pixel is attributed to noise/streaking or the presence of anatomical structures. In other words, the TV GSD step (cf. equation (4) and Fig. 2(c)) reduces all intensity variations indistinguishably since it has no knowledge of the difference between anatomical structures and noise/streaking, and thus often causes loss of image details due to over-smoothing.
Figure 2.
(a) A noisy image f⃗. (b) f⃗Seg, the anatomy segmentation image of f⃗. (c) −∇f⃗ TV (f⃗), the TV GSD step of f⃗. (d) −∇f⃗Seg TV (f⃗Seg), the TV GSD step of f⃗Seg, which represents over-smoothing of the major anatomical structures that should be avoided.
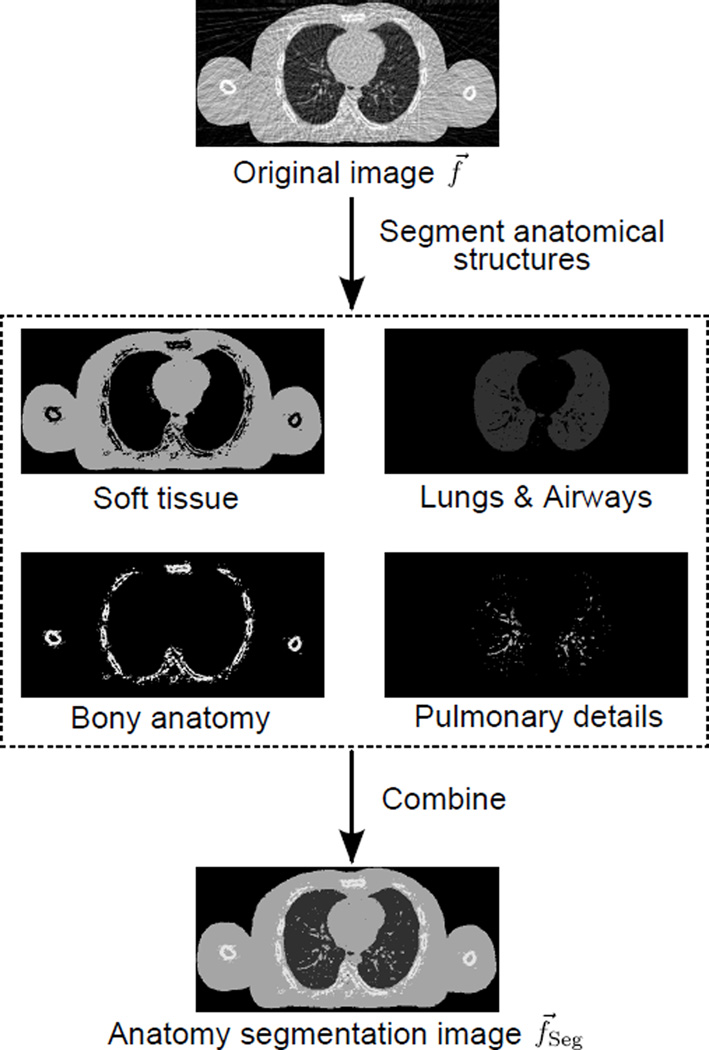
It is possible to reduce over-smoothing if some of the anatomical structures can be roughly identified or segmented before the TV GSD step. In this study, we propose the use of an “anatomy segmentation image” as a reference image for over-smoothing reduction. The anatomy segmentation image, as illustrated in Fig. 1 and Fig. 2(b), is a “simplified sketch” of the updated solution image f⃗ in each iteration, with only the major anatomical structures (i.e. soft tissue, lungs/airways, bony anatomy, and pulmonary details) segmented from f⃗ and represented by their likely attenuation coefficients. The acquisition of the anatomy segmentation image f⃗Seg from f⃗ is critical to the AAIR method, and is discussed in detail in Sec. 2.1.3. It is worth mentioning that although f⃗Seg is obtained from f⃗ itself, the use of f⃗Seg as a reference image does incorporate additional a priori knowledge into the reconstruction, since the anatomy segmentation process relies on the general knowledge of the thoracic anatomy, i.e. the likely positions, shapes, and attenuation coefficients of anatomical structures.
Figure 1.
An illustration of how the anatomy segmentation image f⃗Seg can be obtained from segmenting the soft tissue, lungs/airways, bony anatomy, and pulmonary details in the updated solution image f⃗.
There are potentially various ways to incorporate the anatomy segmentation image into the reconstruction. In this study, we adopt a naive approach to demonstrate a proof of concept that the use of the anatomy segmentation image can considerably improve the reconstruction performance. Consider the term −∇f⃗Seg TV (f⃗Seg) (cf. Fig. 2(d)), which is the TV GSD step of f⃗Seg (cf. Fig. 2(b)). Since f⃗Seg contains only major anatomical structures that can be confidently identified from f⃗, −∇f⃗Seg TV (f⃗Seg) represents edges of the major structures that should be preserved. In addition to edge preserving, the approximate directions and magnitudes of the image gradients at the edges are also encoded in −∇f⃗Seg TV (f⃗Seg), since f⃗Seg not only comprises the segmented anatomies, but also their likely attenuation coefficients. A natural choice to avoid over-smoothing is therefore to subtract −∇f⃗Seg TV (f⃗Seg) from the TV GSD step to obtain an “anatomical-adaptive” TV minimization step:
| (5) |
where λ is the prior weighting controlling the weighting of the anatomy segmentation prior term, −∇f⃗Seg TV (f⃗Seg) (higher λ corresponds to higher weighting). In practice, λ is gradually reduced from unity as the TV GSD step size decreases, so that the impact of the anatomy segmentation prior is greater when the TV GSD step is more prone to over-smoothing. This λ reduction scheme allows the anatomy segmentation image to render considerable improvement in the reconstruction performance while not biasing the solution towards inaccuracies in the segmentation image. The reduction scheme for λ is discussed in Sec. 2.1.4.
An important property of equation (5) is that the anatomy segmentation prior term only affects edges that are identified in f⃗Seg (cf. Fig. 2(d)). For anatomical structures that are “missed” in the segmentation process, the ∇f⃗ TV (f⃗Seg) term vanishes at the corresponding pixels, and equation (5) simply reduces to the conventional TV GSD step. In other words, equation (5) aims to ”preserve structures as much as possible” while not imposing similarity between f⃗ and f⃗Seg.
Replacing the TV GSD step with the anatomical-adaptive TV minimization step can potentially improve reconstruction performance in the following aspects. Firstly, it can greatly mitigate the majority of over-smoothing, leading to a sharper image. Secondly, it allows adoption of a larger TV minimization step size without severely over-smoothing the image, thus enabling more rapid reduction in noise and streaking artifacts. Last but not least, it enhances contrast and sharpness for not only objects that are well identified in f⃗Seg, but potentially also for some small objects that are missed in the segmentation process. This can be explained by viewing the POCS step as a one-iteration SART reconstruction using the image in the previous iteration as the initial image. Even though the anatomical-adaptive TV minimization step alone only results in improvements at major anatomical structures that are identified in f⃗Seg, an improved initial image for the one-iteration SART reconstruction implies an improved outcome of the POCS step, the benefits of which may include better recovery of details whether identified or missed in the anatomy segmentation step.
2.1.3. Anatomy segmentation
The anatomy segmentation image is obtained by segmenting the four major anatomical structures – soft tissue, lungs/airways, bony anatomy, and pulmonary details – from the updated solution f⃗ in every iteration. For the purpose of AAIR reconstruction, a reasonable anatomy estimation is sufficient to considerably improve the reconstruction performance. Thus, the anatomy segmentation method utilized in AAIR is mainly based on simple intensity thresholding and pixel connectivity strategies, and does not aim for a perfectly accurate segmentation. The step-by-step segmentation details are given below.
Estimate representative attenuation coefficients: The attenuation coefficients in CBCT images can be unreliable due to scatter contamination, objects outside the field-of-view (FOV), and calibration issues. As a result, the optimal intensity threshold values may be scan dependent, and need to be selected on a scan-by-scan basis. The 3D motion blurred FDK image offers a reliable estimate of the representative attenuation coefficient of each anatomical structure since it contains much less noise than the 4D images, i.e. similar but more concentrated distributions of pixel values within regions compared to that of the 4D images (see Fig. 3). Before every 4D AAIR reconstruction, subregions of the soft tissue, lungs, and bony anatomy in the 3D FDK image were manually selected to estimate the representative attenuation coefficients of anatomical structures by the mean pixel values of the selected regions. It is worth mentioning that this step does not require accurate delineation and is not time-consuming since any subregions with reasonable sizes (≳ 20 pixels) would result in similarly reliable estimates due to the concentrated distributions of pixel values. The representative attenuation coefficients of the soft tissue, lungs, and bony anatomy were then used for intensity threshold value selection in later steps.
Soft tissue: The soft tissue was segmented by pixels with attenuation coefficients higher than the soft tissue attenuation threshold ISoft. ISoft was chosen to be half-way between the estimated lung and soft tissue attenuation coefficients in order to exclude most of the lung pixels preserving most of the soft tissue pixels as shown in Fig. 3. Then, only the largest connected area in the thresholded mask was labeled as soft tissue, so that noise/streaking exterior to the patient and mis-included lung regions were removed. Soft tissue pixels mis-excluded by intensity thresholding due to noise can be later restored in the lung segmentation step.
Lungs/airways: Once the soft tissue has been segmented, the rest of the low attenuation regions belong to either the background or the lungs/airways. To eliminate the background, for every axial slice, a background removal operator starts multiple searches from the pixels on the four boundaries, each search moving towards the center along the anterior-posterior (AP) or left-right (LR) direction. Once a search encounters the soft tissue region, pixels preceding the first soft tissue pixel are identified as background and eliminated from the image. Having removed the background, the rest of the low attenuation regions are attributed to the lungs/airways and some soft tissue regions mis-excluded in the previous step due to noise. Since the lungs and airways are in general much larger in volume than noise, only regions with connected volume larger than the lung/airway volume threshold VLung ≈ 100 mm3 were labeled as lungs/airways, and the rest of the regions were re-labeled as soft tissue.
Pulmonary details: Pulmonary details refer to any contrast objects inside the lung, e.g. tumors, vessels, bronchus walls. In general, pulmonary details are similar in attenuation coefficients to soft tissue. However, pulmonary details often suffer from loss of contrast either due to their small sizes or motion artifacts. Thus, compared to the soft tissue attenuation threshold, a slightly lower threshold value IPulmonary, which was chosen to be around 90% of ISoft, was used to segment pulmonary details inside the lungs.
Bony anatomy: The bony anatomy can be roughly segmented by pixels with attenuation coefficients higher than the bone attenuation threshold IBone. IBone was chosen to be one-third of the way between the estimated bone and soft tissue attenuation coefficients. To remove the majority of the mis-included soft tissue due to the highly overlapped intensity distributions (cf. Fig. 3), a reference segmentation of the bony anatomy was first acquired by segmenting the 3D FDK image. Since the 3D FDK image has almost no overlapped intensity distributions due to its much lower level of noise/streaking, and does not suffer from significant motion artifacts in the bony anatomy, the attenuation thresholded result alone is sufficient to render an accurate reference segmentation. A “search region” was then constructed to account for respiratory motion by extending the reference segmentation in the coronal, sagittal, and axial directions by approximately 2 mm, 2 mm, and 5 mm, respectively. Finally, the attenuation thresholded segmentation of the 4D image was masked with the search region to give a more accurate segmentation of the bony anatomy.
Combine segmentations: Anatomical structures are assigned their representative attenuation coefficients estimated in the first step, and combined to give the anatomy segmentation image, as illustrated in Fig. 1. The pulmonary details are represented by the soft tissue attenuation coefficient. This implies that whether certain contrast objects within the lungs are labeled as pulmonary details (if isolated from the lung boundaries) or soft tissue (if attached to the lung boundaries) do not affect the reconstruction outcomes.
Figure 3.
The attenuation coefficient histograms of anatomical structures in (a) the phantom FDK images and (b) the patient FDK images (see Sec. 2.2.1 and Sec. 2.2.2 for details of the phantom and patient data). The histograms were obtained via manual delineation of the anatomies. All the curves are normalized to a peak value of unity. Histograms for both 4D FDK images (solid curves) and the 3D motion blurred FDK image (dashed curves) are shown. The intensity thresholding parameters used in this study are also shown by the dotted vertical lines.
It is worth mentioning that since the soft tissue and the lungs/airways are in general large connected regions, their segmentation outcomes are reasonably robust to noise and the selection of ISoft due to the connectivity constraints (see Appendix A for more details). In contrast, segmentation outcomes of the pulmonary details and bony anatomy are relatively more sensitive to the selection of IPulmonary and IBone due to the highly overlapped intensity distributions (cf. Fig. 3) and the lack of connectivity constraint. The effects of IPulmonary and IBone on AAIR reconstructions are discussed in more detail in Sec. 3.1.2.
2.1.4. Implementation of AAIR
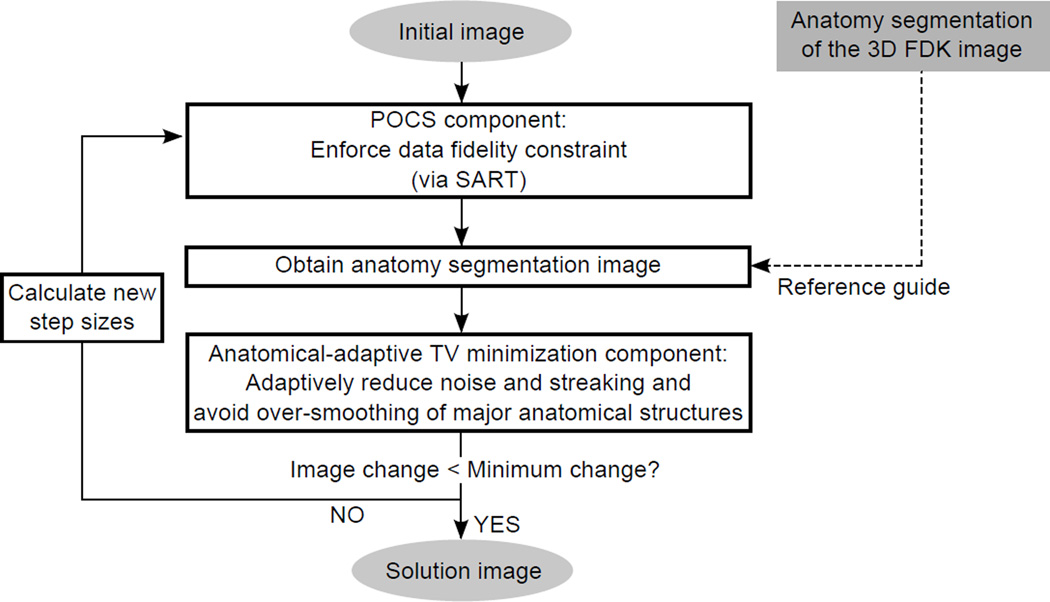
The implementation of AAIR is summarized in Fig. 4. Prior to the iterative process, the 3D FDK image is reconstructed, and its anatomy segmentation image is acquired as a reference guide to the anatomy segmentation of the 4D images (cf. Sec. 2.1.3). Then, the iterative process is usually initialized from either a zero image or a FDK image. Each iteration starts with a POCS component (realized as SART (Andersen and Kak, 1984)) to enforce the data fidelity constraint. Then, the anatomy segmentation image of the POCS updated image is acquired, with which a few steps (typically ≈ 20) of equation (5) are applied to the POCS updated image. At the end of each iteration, the iterative process either ceases and returns the POCS updated image if the norm of the image change in one iteration is small enough, or calculates new POCS/TV step sizes and the prior weighting λ before continuing to the next iteration. See the pseudo code in Appendix B for more details.
Figure 4.
A flowchart illustrating the AAIR method.
The selection schemes for the POCS and TV step sizes are described in detail in Sidky and Pan (2008). The prior weighting λ was initialized to be unity, and was gradually reduced with the TV step size α, using a heuristic update scheme
| (6) |
where k is the current iteration number, and γ > 0 is the impact factor determining how rapidly λ is reduced. A higher γ slows the reduction of λ, resulting in an overall greater impact of the anatomy segmentation prior. The effects of λ and γ on AAIR reconstructions are discussed in more detail in Sec. 3.1.1.
We would like to point out that although the anatomical-adaptive TV minimization step was designed to minimize TV while preserving structures as discussed in Sec. 2.1.2, there is no theoretical proof regarding the convergence of the method to a solution with minimized TV, since equation (5) is not the TV GSD step. Theoretical analysis of the convergence properties of AAIR is difficult because there is no direct numerical relation between f⃗ and f⃗Seg. Nevertheless, the iterative behavior of AAIR in terms of reconstruction accuracy was numerically investigated and is discussed in Sec. 3.1.
2.2. Performance assessment
AAIR was applied to both a digital phantom dataset and a clinical patient dataset for performance evaluation. For comparison, both datasets were also reconstructed with FDK, ASD-POCS and PICCS.
2.2.1. Phantom data
We simulated a realistic ten-phase 4D thoracic phantom using the XCAT digital phantom (Segars et al, 2010). Ten ground truth images were generated with 5122 voxels ((0.88 mm)2 voxel size) in 128 axial slices (2 mm slice thickness). A spherical tumor with a diameter of 12 mm was placed in the lower lobe of the right lung near the mediastinum. The scan geometry was chosen according to the Varian On-Board Imager (Varian Medical Systems, Palo Alto, CA) half-fan acquisition mode Lu et al (2007). In order to exclude any respiratory binning related motion artifacts and only focus on the effect of the reconstruction methods, the projections were generated from forward projecting the ten discrete ground truth images instead of a continuously breathing phantom, and each respiratory phase was later reconstructed with the projections that were forward projected from the corresponding ground truth image. The scan duration was 250 s, in which 50 respiratory cycles of 5 s were included. A total of 1200 half-fan projection images were generated, covering an angular range of 360° and each with a dimension of 256 × 128 and pixel size of 1.552 × 3.104 mm2. Monoenergetic 120 keV photon beam with Poisson noise modeling 30000 photons per ray was simulated for projection acquisition. The reconstruction voxel size was the same as that of the ground truth images.
2.2.2. Patient data
AAIR was also applied to a clinical scan from a stereotactic body radiation therapy patient. The scan was acquired with the Elekta Synergy (Elekta Oncology Systems Ltd, Crawley, UK) full-fan acquisition mode. Due to the limited FOV of full-fan acquisition, the left lung was truncated in the reconstructed image. The mean photon energy was approximately 60 keV, with a tube voltage of 120 kVp and filtration of 3.5 mm aluminum + 0.1 mm copper. It should be noted that the observed attenuation coefficients (cf. Fig. 3) are lower than that expected for this energy range, possibly due to calibration issues and scatter contamination. The scan duration was approximately 4 minutes, in which 71 respiratory cycles (free breathing) were included. The scan contains a total of 1340 projection images, covering an angular range of 200°. The dimension of the projection image was 5122 with a pixel size of (0.8 mm)2. The projection images were sorted into ten phase bins using a projection intensity based sorting method (Kavanagh et al, 2009). The reconstructed image contained 128 axial slices with a slice spacing of 2 mm, each slice containing 5122 voxels with a voxel size of (0.5 mm)2.
2.2.3. Reconstruction details
The FDK algorithm is a simple filtered backprojection method and requires no input parameter. The reconstruction filter was the standard RamLak kernel. For each iterative method, the parameters were adjusted to render the best image quality, and are outlined below.
For the ASD-POCS reconstruction, the initial TV minimization step size, α, was set to 0.05 (phantom case) and 0.1 (patient case). The TV reduction factor, αred, was set to 0.8 for both the phantom and patient cases. The threshold for TV reduction, rmax, was set to 0.9 (phantom case) and 0.8 (patient case). The residual error tolerance for TV reduction, tol, was set to 0.11 (phantom case) and 1.25 (patient case). The POCS reduction factor, βred, was set to 0.99 for both the phantom and patient case.
For the PICCS reconstruction, the 3D motion blurred FDK image was used as the prior image with a prior weighting factor λPICCS of 0.5 as adopted by Chen et al (2008). There is no step size reduction scheme for PICCS, and therefore α was set to be 0.025 (phantom case) and 0.004 (patient case), which is relatively small compared to that of ASD-POCS.
For the AAIR reconstruction, the anatomy segmentation prior allows the use of a larger initial TV minimization step size without over-smoothing anatomical details. Thus, α was set to 0.2 (phantom case) and 0.4 (patient case). Since this renders much more rapid removal of noise and streaking artifacts than ASD-POCS, a smaller TV reduction factor of 0.4 was used to accelerate the reconstruction without sacrificing image quality. The other parameters were set to be the same as that of ASD-POCS.
For all three iterative methods, the 4D FDK image of the corresponding phase was used as the initial image. The POCS step was realized as SART (Andersen and Kak, 1984). The stopping criterion was the norm of the image change in one iteration dropping below 2 × 10⁻⁴ mm−1 for the phantom case and 2.5 × 10⁻⁴ mm−1 for the patient case. Twenty steps were used for the regularization component, in which ASD-POCS applies equation (4), AAIR applies equation (5), and PICCS applies the GSD step of the objective function combining TV and the similarity between f⃗ and the prior image f⃗Prior, viz.
| (7) |
The reconstructions were computed on a dual Intel Xeon E5-2687W CPU with a clock speed of 3.1 GHz each. All the reconstructions were performed using our in-house MATLAB codes, with the FDK backprojection, forward projection, and SART modules from the Reconstruction Toolkit developed by Rit et al (2014).
2.2.4. Image quality metrics
The reconstruction accuracy of the digital phantom was assessed by the similarity between the reconstructed image, f⃗, and the ground truth (GT) image, f⃗GT, using two metrics. The first metric, the mean absolute difference (MAD), measures similarity relative to ground truth on a pixel-by-pixel basis, and is mathematically defined by
| (8) |
where N is the number of image pixels. A lower MAD indicates higher similarity with the ground truth image, hence better image quality. The second metric, the structural similarity (SSIM) index, measures human visual perception to degradation of structural information, and is more clinically relevant than MAD. SSIM ranges from 0 to 1, with a higher value indicating higher similarity with the ground truth image. A detailed definition of SSIM can be found in (Wang et al, 2004). In this study the mean SSIM value over all axial slices was used.
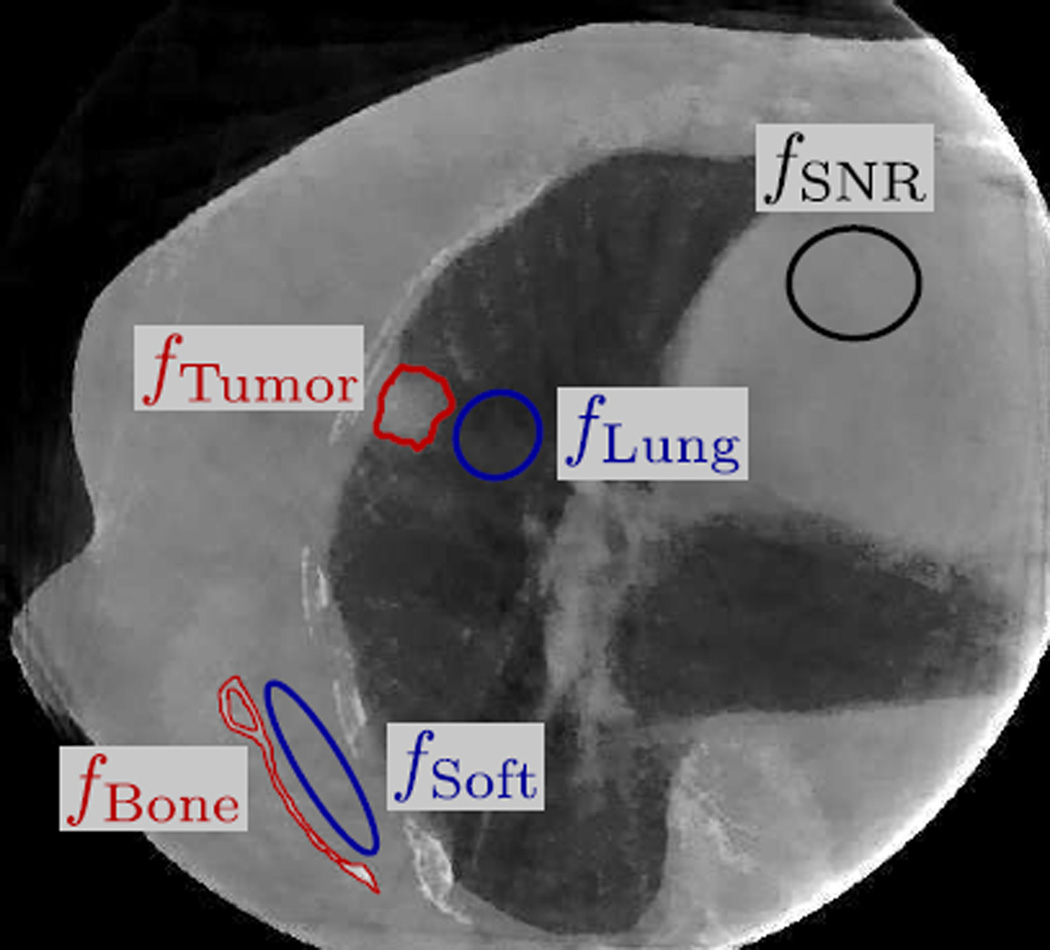
The image quality of the reconstructed patient image was assessed by the level of noise and streaking and the visibility of anatomical structures. The level of noise and streaking was quantified by the signal-to-noise ratio (SNR). SNR was calculated over a selected uniform region over 25 continuous axial slices, the set of pixel values belonging to which is denoted by fSNR (cf. Fig. 5), using the following formula
| (9) |
where SD denotes standard deviation. The visibility of anatomical structures was quantified by the contrast-to-noise ratio (CNR) of the tumor and the bony anatomy. To calculate CNR, the tumor and the part of the scapula in the axial slices where the tumor was visible were first manually delineated from the reconstructed image. The scapula was chosen for bone CNR calculation because it can be clearly delineated in all reconstructed images. A lung region near the tumor and a soft tissue region near the scapula were selected as the “background”. Denoting the sets of pixel values of the tumor, scapula, lung, and soft tissue as fTumor, fBone, fLung, and fSoft (cf. Fig. 5), the tumor and bone CNRs can be calculated by
| (10) |
| (11) |
with both of them evaluated in all axial slices (≈ 15 slices) where the tumor was visible. It should be noted that both SNR and CNR are used as surrogates to assess potential gain in image quality, since direct measurements are not feasible without a ground truth.
Figure 5.
The selected region fSNR in the patient images for calculating SNR, and fBone, fTumor, fSoft, and fLung for calculating CNRs.
3. Results
The iterative behaviors of AAIR are first investigated in Sec. 3.1 using the digital phantom. Then, in Sec. 3.2, AAIR is compared with FDK, ASD-POCS, and PICCS in terms of image quality using the image quality metrics described in Sec. 2.2.4. Finally, the computational efficiency of AAIR is compared with that of ASD-POCS and PICCS in Sec. 3.3.
3.1. Sensitivity of AAIR to reconstruction parameters
3.1.1. Prior weighting λ and the impact factor γ
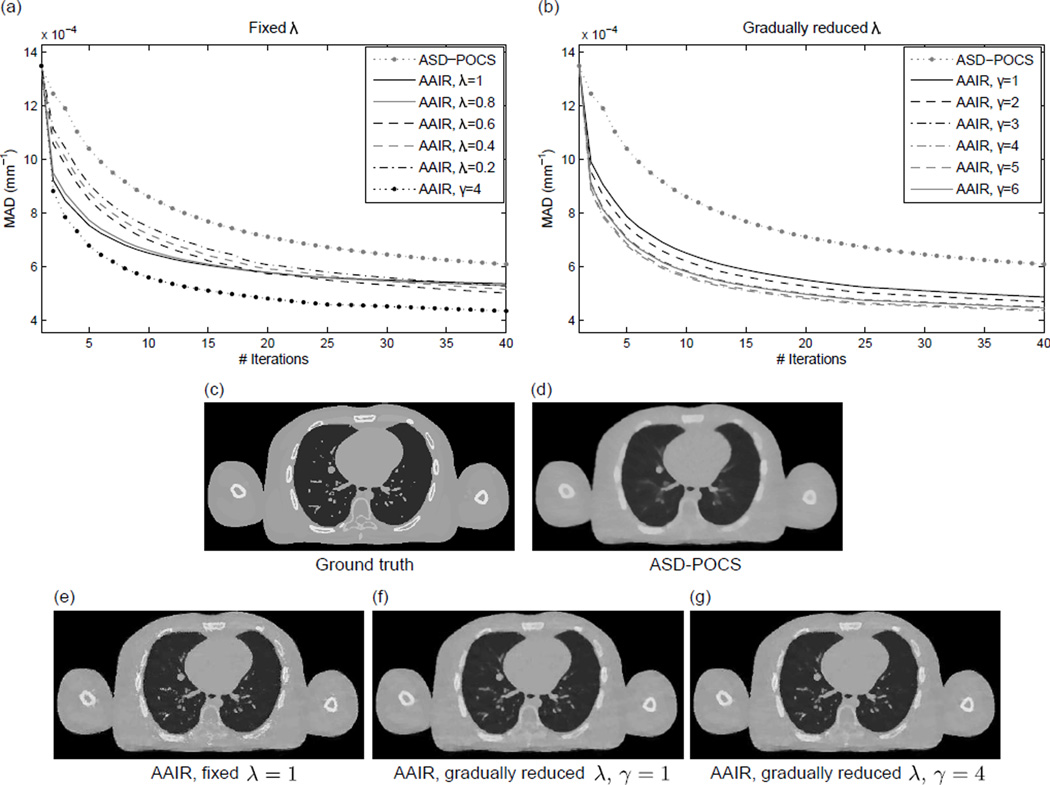
The weighting of the anatomy segmentation prior is controlled by λ. In this section, the effects of λ are investigated using the digital phantom in two scenarios: (i) adopting different fixed λ values, and (ii) adopting the λ reduction scheme described in equation (6) with different γ values.
The MAD values between the 20% phase ground truth and the corresponding AAIR reconstructions adopting different constant λ values are plotted w.r.t. iteration number in Fig. 6(a). Results from the other phases show similar trends, and are not included. It is worth mentioning that these results only illustrate the gradual reduction in the discrepancies between the ground truth and the reconstructed images rather than demonstrating the reconstruction convergence. All the AAIR reconstructions resulted in noticeably lower MAD values than conventional ASD-POCS. More specifically, larger λ values (λ = 0.8, 1) resulted in more rapid decrease in MAD in early iterations, but only limited improvements in later iterations. This is because a large λ is prone to slightly biasing the solution towards any small inaccuracies in the segmentation (e.g. tiny noise-like structures around the bony anatomy in Fig. 6(e)), while a smaller λ allows for more flexibility to correct for those inaccuracies as the algorithm iterates. This motivated the use of the λ reduction scheme, which integrates the rapid decrease in MAD of large λ values in early iterations and the flexibility of small λ values in later iterations. It can be seen in Fig. 6(a) that the λ reduction scheme (γ = 4) significantly outperformed all the other cases.
Figure 6.
(a) The mean absolute difference (MAD) values between the ground truth (digital phantom 20% phase) and AAIR reconstructions adopting different constant λ values plotted w.r.t. iteration number. The results of the ASD-POCS and AAIR reconstructions using the λ reduction scheme (γ = 4) (cf. equation (6)) are included as references. (b) Similarly to (a), but with all the AAIR results obtained using the λ reduction scheme and with different γ values. Both (a) and (b) only illustrate the gradual reduction in the discrepancies between the ground truth and the reconstructed images rather than demonstrating the reconstruction convergence. (c) and (d) are the ground truth and ASD-POCS images of the 20% digital phantom images, respectively. (e)–(g) are the corresponding AAIR images adopting a fixed λ = 1 and the λ reduction scheme with γ = 1 and γ = 4, respectively. (C/W = 0.0115/0.023 mm−1)
The effects of adopting the λ reduction scheme with different γ values are shown in Fig. 6(b). All the AAIR curves behaved similarly in early iterations (iteration number < 3) since λ was initiated to be unity for all cases. As the algorithm iterated, the MAD values began to diverge. In particular, the decrease in MAD was slightly smaller for γ = 1 and γ = 2, while the other larger γ values were found to perform similarly well. This can be expected since a smaller γ value leads to more rapid reduction in λ (cf. equation (6)), and therefore an overall smaller impact of the anatomy segmentation prior. Consequently, images reconstructed with small γ values (e.g. Fig. 6(f)) are prone to over-smoothing like ASD-POCS images, while images reconstructed with reasonably large γ values (e.g. Fig. 6(g)) benefit significantly from the anatomy segmentation prior.
Out of all the results, γ = 4 was found to produce the lowest MAD value. This suggests that the choice of γ = 4 not only enables sufficient impact of the anatomy segmentation prior, but also allows for flexibility to correct for inaccuracies in the segmentation as the algorithm iterates. Nevertheless, it should be noted that the results were very similar for γ ∈ [3, 6], indicating that the reconstruction outcome is not sensitive to the choice of γ within this range. For both the digital phantom and patient results presented in Sec. 3.2, γ = 4 was used.
3.1.2. Segmentation parameters
The AAIR method relies on the general anatomical knowledge encoded in the anatomy segmentation image. It is therefore crucial to investigate the effects of segmentation parameters on reconstruction outcomes. As mentioned in Sec. 2.1.3, the segmentation of soft tissue and lungs/airways are reasonably tolerant to the selection of parameters due to the connectivity constraints. However, the segmentation of the smaller structures, i.e. the bony anatomy and the pulmonary details, can be sensitive to the choice of IBone and IPulmonary. Specifically, smaller values of IBone and IPulmonary may lead to noisy segmentation, while larger values often fail to capture low contrast objects.
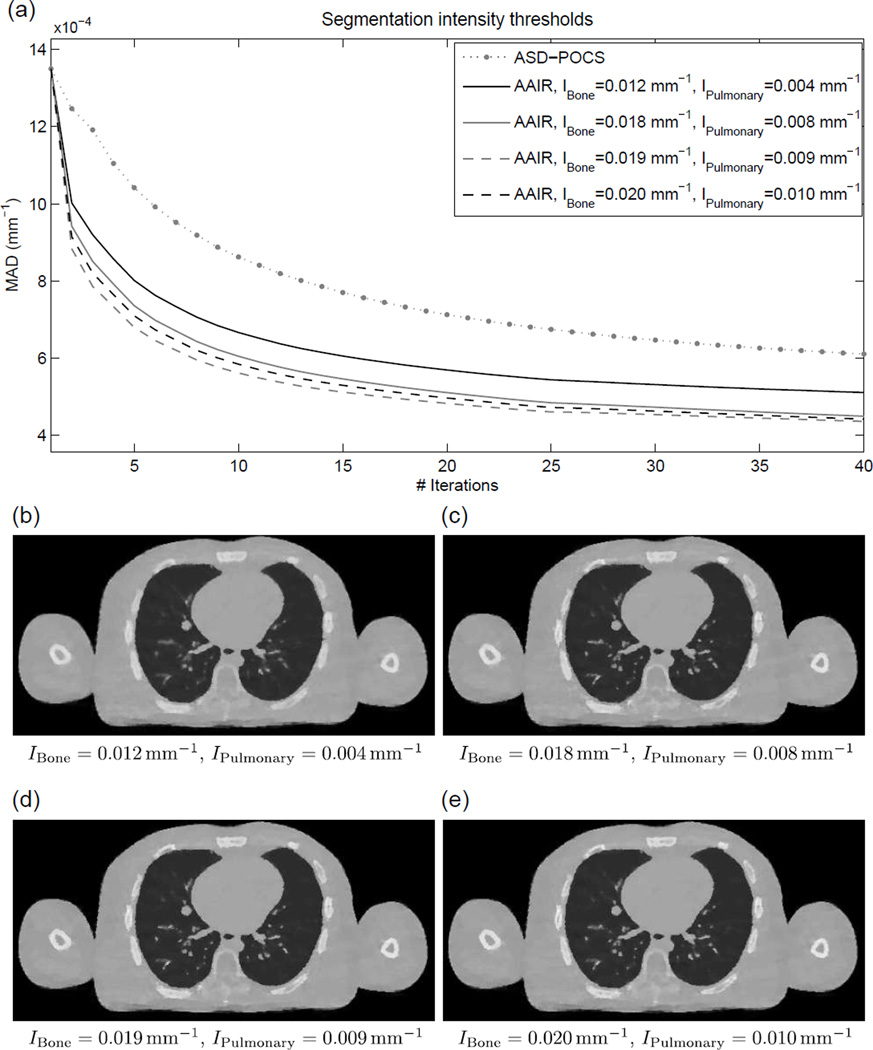
In this section, three sets of reasonable segmentation parameters for the phantom data, (IBone, IPulmonary) ∈ {(0.018, 0.008), (0.019, 0.009), (0.020, 0.010)mm−1}, were investigated (with (IBone, IPulmonary) = (0.019, 0.009) directly estimated by the methods described in Sec. 2.1.3). In addition, a set of purposely exaggerated parameters, (IBone, IPulmonary) = (0.012, 0.004)mm−1, was also included to investigate the effects of extremely inappropriate segmentation parameters on reconstruction outcomes. In can be seen in Fig. 7(a) that except for (IBone, IPulmonary) = (0.012, 0.004)mm−1, all other three sets of parameters resulted in very similar MAD values. The corresponding reconstructed images (cf. Fig. 7(c–e)) also show no observable qualitative differences. In comparison, the exaggerated parameter set (IBone, IPulmonary) = (0.012, 0.004)mm−1 resulted in considerably higher MAD values. The reconstructed image (cf. Fig. 7(b)) is also slightly but noticeably blurrier than the other three cases. Nevertheless, all four sets of parameters performed better than ASD-POCS. These results suggest that the reconstruction outcomes of AAIR are not very sensitive to the segmentation parameters as long as the parameters are within a reasonable range. In appropriate parameters may fail to capture fine anatomical structures, thereby making the reconstruction prone to more over-smoothing like in ASD-POCS.
Figure 7.
(a) The mean absolute difference (MAD) values between the ground truth (digital phantom 20% phase) and AAIR reconstructions using different intensity thresholds in the anatomy segmentation process (for the bony anatomy and the pulmonary details) plotted w.r.t. iteration number. The curves only illustrate the gradual reduction in the discrepancies between the ground truth and the reconstructed images rather than demonstrating the reconstruction convergence. The result of the ASD-POCS reconstruction is included as a reference. (b)–(e) are the corresponding AAIR reconstructed images, with the intensity thresholds used in each case labeled. All the results were reconstructed using the λ reduction scheme with γ = 4. (C/W = 0.0115/0.023 mm−1)
3.2. Image quality
3.2.1. Phantom data
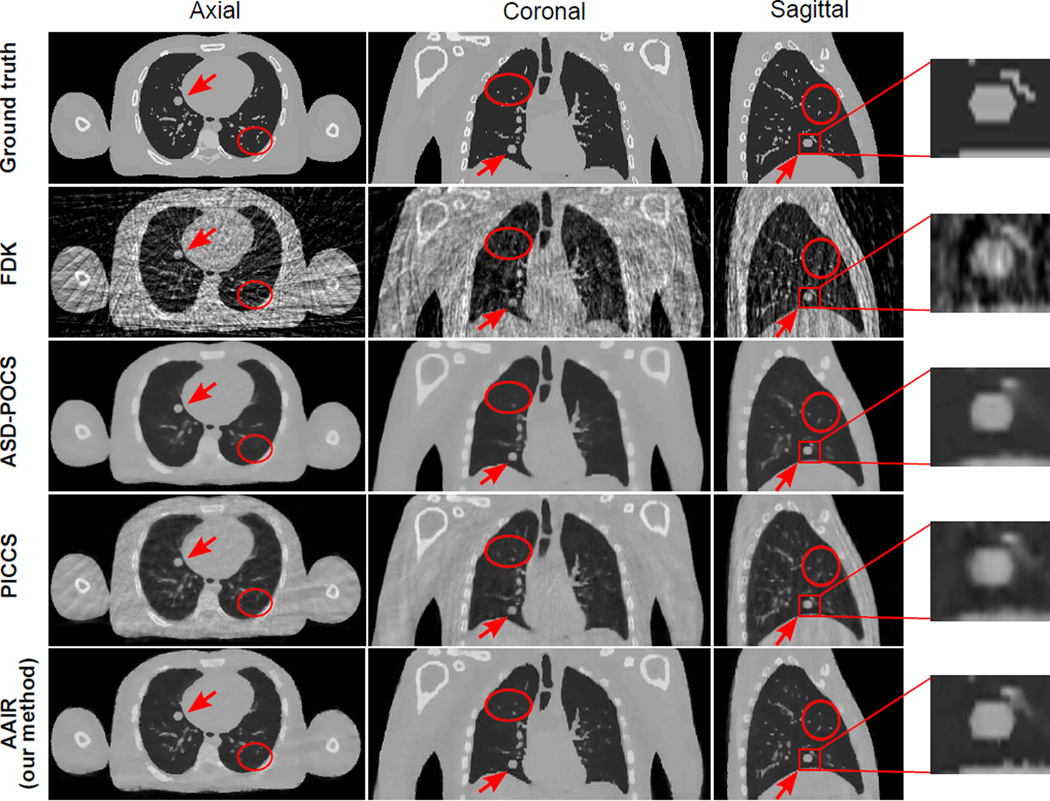
The 20% phase (mid-exhale) of the reconstructed digital phantom images are displayed in Fig. 8. Images of the other phases are included in Fig. C1 in Appendix C. In terms of noise and streaking, all three iterative methods (ASD-POCS, PICCS, and AAIR) performed significantly better than FDK. The ASD-POCS image has the lowest level of noise and streaking, closely followed by the AAIR image, in which minor streaking artifacts can be observed but barely influence the visibility of any details. Among the three iterative algorithms, the PICCS image contains the most noise and streaking artifacts inherited from the prior image. In terms of blurring, the ASD-POCS image shows the worst contrast and sharpness of the bony anatomy and pulmonary details due to over-smoothing, which is expected as TV minimization smooths all intensity variations indistinguishably. The PICCS image has a much improved overall contrast and sharpness compared to the ASD-POCS image. In particular, the bony anatomy in the PICCS image is the clearest among all four reconstructed images. Nevertheless, the contrast of the pulmonary details is slightly worse than that of FDK, which is likely due to motion blur inherited from the prior image. AAIR is much less prone to over-smoothing compared to ASD-POCS, and does not suffer from motion blur inherited from the prior image as in PICCS. AAIR thus rendered the best contrast of pulmonary details. The bony anatomy appears to be slightly blurrier in the AAIR image compared to the PICCS image, but is considerably clearer than that in the FDK and ASD-POCS images.
Figure 8.
The ground truth image and the FDK, ASD-POCS, PICCS and AAIR reconstructed images (with 50 half-fan projections) of the digital phantom (20% phase). The tumor is highlighted by an red arrow and by the sagittal zoom-in on the right. The red circles highlight regions where AAIR resulted in noticeable improvements. (C/W = 0.0115/0.023 mm−1)
Figure C1.
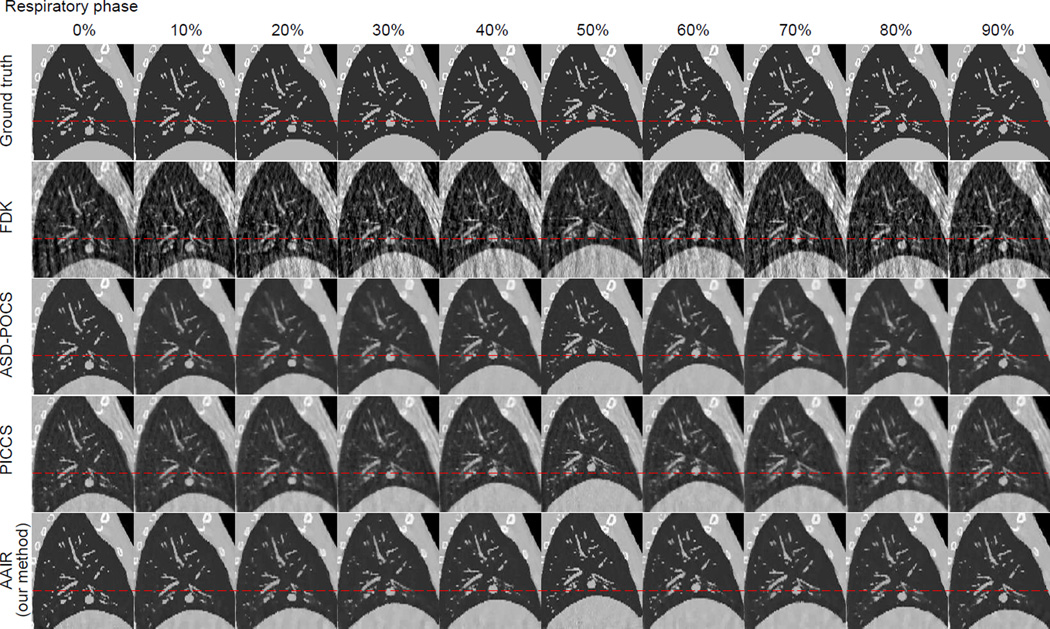
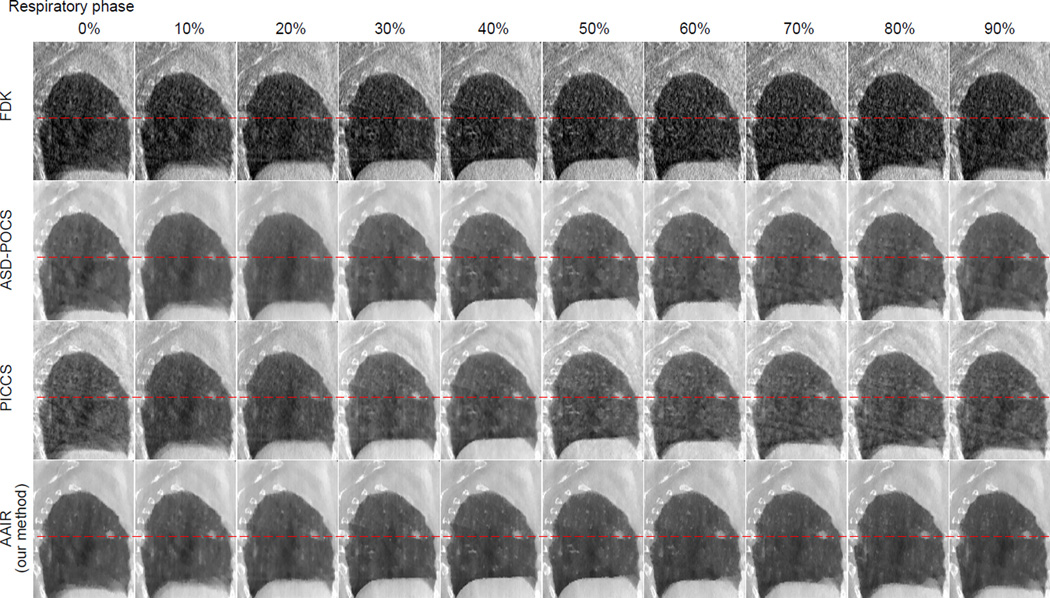
All ten phases of the ground truth, FDK, ASD-POCS, PICCS, and AAIR reconstructions of the digital phantom in sagittal view. The red dashed lines were added to help the observation of the tumor motion. (C/W = 0.0115/0.023 mm−1)
Regions highlighted by the red circles also demonstrate how AAIR can potentially improve the visual inspections of the reconstructed images. Although the pulmonary details in these regions can be observed in the FDK image, they can barely be confidently identified from the surrounding noise and streaks without the ground truth as a reference. On the other hand, these details are either lost in the ASD-POCS image, or suffer from degraded contrast and sharpness in the PICCS image. With significant reduction in noise and streaks but no apparent over-smoothing, the AAIR image offers the best visibility of these details. The sagittal zoom in also shows that AAIR rendered the most accurate and distinct reconstruction of the tumor shape. ASD-POCS “over-polished” the edges, resulting in a reasonably defined but blunt contour. PICCS was unable to restore a distinct tumor contour due to motion blur. The FDK image is heavily corrupted by noise and streaking artifacts, making it difficult to delineate the tumor. However, it is worth mentioning that the vessel near the tumor was the most accurately reconstructed with FDK.
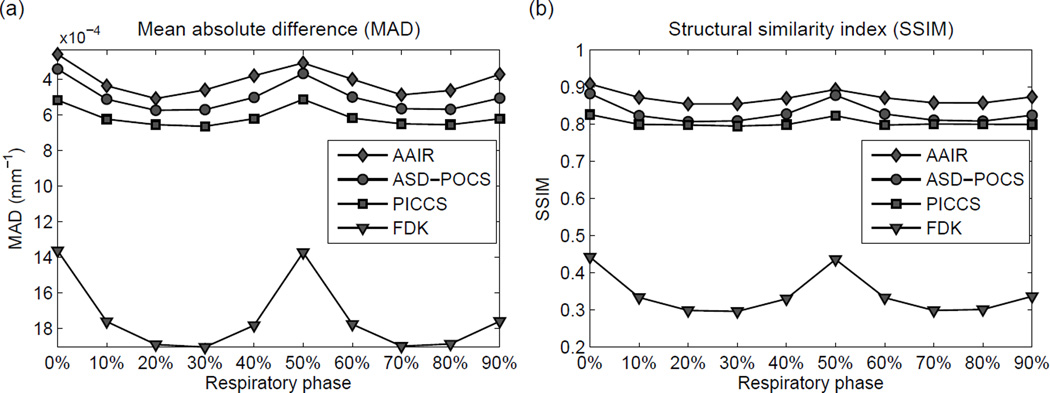
The reconstruction performances for all ten phases were quantitatively investigated using MAD and SSIM (c.f. Sec. 2.2.4 for detailed definitions). Fig. 9(a) and Fig. 9(b) show that AAIR had the best quantitative performances (lowest MAD and highest SSIM), followed by ASD-POCS, PICCS, and FDK, for all phases. These results suggest that AAIR rendered the most accurate reconstruction of the ground truth from both a pixel-by-pixel and a visual perception aspect. However, it should be noted that the quantitative analysis does not necessarily imply the usability of the images. For example, the PICCS images, despite having worse quantitative performances than ASD-POCS, appear to have better visibility of fine details. For all four reconstruction methods, the best quantitative performances are observed in the 0% (end inhale) and 50% (end exhale) phases as expected, since they are in general allocated the most projections (300 half-fan projections in our case). Compared to ASD-POCS, the gain in image quality of AAIR is also the smallest for end inhale/exhale phases, and largest for mid-inhale/exhale phases, implying that the use of the anatomy segmentation prior is more beneficial for phases allocated less projections.
Figure 9.
(a) The mean absolute differences (MAD) of all ten phases of the reconstructed phantom images. A lower MAD indicates a more accurate reconstruction of the ground truth. Note that the y-axis has been inverted so that an upward trend corresponds to better image quality. (b) The structural similarity (SSIM) indices of all ten phases of the reconstructed phantom images. A higher SSIM indicates a more accurate reconstruction of the ground truth.
3.2.2. Patient data
The 20% phase (mid-exhale) of the reconstructed patient images are displayed in Fig. 10. Images of the other phases are included in Fig. C2 in Appendix C. All three iterative methods rendered significant improvements in image quality compared to FDK in terms of noise and streaking reduction. However, it should be noted that in this study the FDK filter was the standard RamLak kernel, whereas in practice FDK is usually used with a Hanning smoothing window to slightly suppress noise and streaks. Among the three iterative methods, the PICCS image exhibits the most noise and streaking artifacts, most likely inherited from the prior image. Unlike the phantom case, no apparent motion blur can be observed at the tumor in the patient PICCS image, most likely because the tumor has very little motion in this particular scan (cf. Fig. C2 for 4D images), favoring the use of the 3D motion blurred image prior. The ASD-POCS image is smoother than the PICCS image, but suffers from slight blurring of the bony anatomy. The AAIR image not only exhibits the least noise and streaking artifacts, but also shows the best contrast and sharpness. Fine pulmonary details, especially those highlighted by the red circles, can be much better identified in the AAIR image than in the FDK image as a result of the significant reduction in noise and streaks, and also have more distinct contours than in the ASD-POCS and PICCS images as a result of the improved contrast and sharpness. Nevertheless, it should be kept in mind that without a ground truth for the patient data, there is no guarantee that AAIR resulted in the most accurate reconstructions.
Figure 10.
The FDK, ASD-POCS, PICCS and AAIR reconstructed images (with 73 full-fan projections) of the 20% phase patient image. The tumor is highlighted by an red arrow and by the sagittal zoom-in on the right. The red circles highlight regions where AAIR resulted in potential improvements in the visibility of fine details. (C/W = 0.01/0.02 mm−1)
Figure C2.
All ten phases of the FDK, ASD-POCS, PICCS, and AAIR reconstructions of the patient scan in sagittal view. The red dashed lines were added to help the observation of the tumor motion. (C/W = 0.01/0.02 mm−1)
SNR and CNR were used as surrogates to assess potential improvements in the visibility of details due to reduction in noise, streaks, or blurring, and are showed in Fig. 11. It can be seen that for all reconstruction methods, the image quality metrics are in general higher at phases allocated more projections, i.e. end inhale (0%) and end exhale (50%), similarly to that observed in the phantom study (cf. Fig. 9). All three iterative methods performed considerably better than FDK. Both ASD-POCS and PICCS resulted in lower SNR and CNR values than AAIR, with ASD-POCS slightly outperforming PICCS in SNR and CNR of the tumor. However, PICCS performed slightly better than ASD-POCS in terms of CNR of the bony anatomy in some phases, which can be expected since the use of the 3D motion blurred prior image is likely to benefit the reconstruction quality of relatively static structures more. AAIR reconstructions have the highest SNR and CNR values for all ten phases, corroborating the best visibility of details observed in Fig. 10. Once again, the SNR and CNR results provide some evidence of the potential improvements in image quality by AAIR, but do not guarantee the accuracy of the reconstruction since there is no ground truth.
Figure 11.
The (a) SNR values, (b) CNR values of the tumor, (c) CNR values of the bony anatomy of all ten phases of the patient images.
3.3. Computational efficiency
The computational efficiency of AAIR was compared to that of the other iterative algorithms, i.e. ASD-POCS and PICCS, by the total computation time. The total computation time was recorded as the sum of the time spent on the major operations – SART, TV gradient calculation, and anatomy segmentation (AAIR only). The computation time and its components for the 20% phase are shown in Fig. 12 as an example. It can be seen that for 3D images, the TV gradient calculation is the most computationally expensive and accounts for the majority of the computation time. Consequently, PICCS required more computation time than that suggested by its small number of iterations because it computes double the amount of TV gradients than ASD-POCS in each iteration. More specifically, for a 20-step TV minimization per main iteration, the number of TV gradients computed in each method is: 20 for ASD-POCS, 21 for AAIR (one additional calculation for the anatomy segmentation prior, cf. equation (5)), and 40 for PICCS (2 × 20 since there are two TV terms in the objective function, cf. equation (8)). In contrast, AAIR is more computationally economical as it reduces the number of iterations for the relatively low cost of only one additional TV gradient calculation and one computationally cost-effective anatomy segmentation step per iteration. For all three iterative methods the POCS component was more time consuming in the patient case than in the phantom case, which is due to the larger dimension of the patient projection image (5122 vs. 256 × 128). It should be noted that the computation time occupied by each operation may vary depending on factors such as code optimizations and computer hardware specifications.
Figure 12.
The total computation time of each iterative reconstruction for 20% phase of the (a) phantom data, and (b) patient data. The total computation time was calculated as the sum of the time spent on the SART and TV gradient calculations, as well as the anatomy segmentation operation in the case of AAIR. The number of iterations required for each reconstruction is also shown.
The computation time for all ten phases is compared and displayed in Fig. 13. Computation time is in general higher for phases allocated more projections (end inhale 0% and end exhale 50%) because the time required for the POCS step increases with the number of projections. For all phases, AAIR required the least computation time to reach the stopping criterion, and was in general more than two times faster than ASD-POCS. This indicates that in addition to improving image quality, the use of the anatomy segmentation prior is also beneficial to reducing reconstruction time. The computation time of PICCS was also considerably reduced compared to ASD-POCS, except for a few phases of the patient case. It is worth mentioning that other step size selection schemes and optimization algorithms have been proposed for PICCS (Lauzier et al, 2012), and may improve computational performance than that found in this study.
Figure 13.
The total computation time of each iterative reconstruction for all ten phases of the (a) phantom data, and (b) patient data.
4. Discussion
We have introduced a novel thoracic 4D CBCT image regularization method, i.e. the AAIR method, which builds on and overcomes some limitations of conventional TV minimization reconstructions by exploiting the general anatomical knowledge of the thoracic region in the form of an anatomy segmentation prior. The anatomy segmentation prior helps the reconstruction algorithm roughly identify and adaptively preserve anatomical structures of interest, thereby not only avoiding loss of contrast, but also allowing the use of a larger step size of the smoothing process for more rapid noise and streaking removal. As a result, the incorporation of the anatomy segmentation prior improves both image quality and computational efficiency as demonstrated by both the phantom and patient cases.
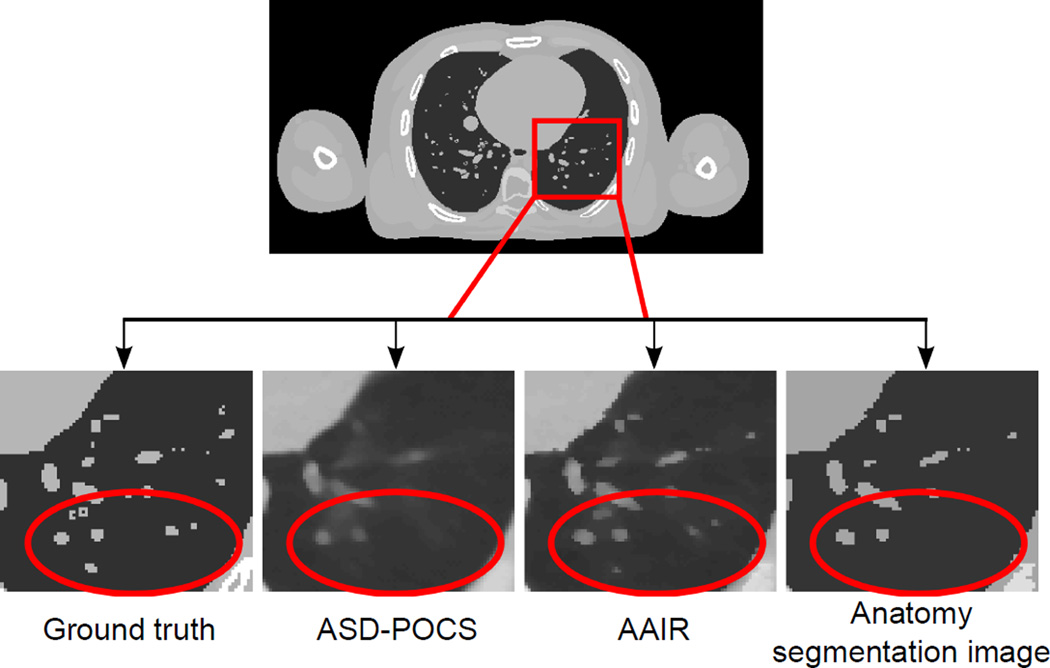
The main difference between ASD-POCS and AAIR is that an anatomy segmentation prior term is used to preserve structures that are identified in the segmentation process (cf. equation (5) and Fig. 2(d)). However, it is important to point out that AAIR can potentially improve the reconstruction of details missed in the segmentation process as well. This is because by preserving some of the anatomical structures in the anatomical-adaptive TV minimization step, the POCS step that follows is initialized with an improved image, which may then lead to global improvements in the image quality. An example is shown in Fig. 14, in which AAIR was able to recover some of the tiny vessels in the digital phantom even without them being identified in the anatomy segmentation image.
Figure 14.
Zoom in views of the digital phantom images illustrating that the use of the anatomy segmentation prior can improve the reconstruction of fine details even if they are missed in the segmentation process. The anatomy segmentation image displayed was acquired from the last iteration of the AAIR reconstruction. (C/W = 0.0115/0.023 mm−1)
The main purpose of this work is to demonstrate a proof of concept that the use of an anatomy segmentation prior can improve thoracic 4D CBCT reconstruction. For this purpose, the anatomy segmentation image was incorporated into the reconstruction using a heuristic method (cf. equation (5)). The heuristic method has some desirable properties as described in Sec. 2.1.2, and its iterative behavior was also numerically demonstrated to be stable provided that the parameters are selected within a certain range. Nevertheless, a limitation of this method is that there is no theoretical proof of the convergence of AAIR, making AAIR not reliable for practical use, yet. Thus, future work involves implementing the anatomy segmentation prior with an improved framework with desirable theoretical properties.
The anatomy segmentation method used in this work is simple and largely based on intensity thresholding, the potential limitation of which is that the segmentation outcome may be sensitive to the intensity thresholding parameters. AAIR was therefore tested with a few segmentation parameter sets, and was found to be robust as long as the parameters were within a reasonable range. The simple anatomy segmentation method was demonstrated to be sufficient to render significant improvements in the reconstruction performance. That said, AAIR is expected to benefit from more advanced segmentation methods (Haas et al, 2008; van Rikxoort et al, 2009; Volpi et al, 2009; Vandemeulebroucke et al, 2012). For example, techniques such as region growing or morphological operators may enable accurate segmentation even in early iterations, sparing the need for recomputing the segmentation in every iteration.
There are a few other limitations of AAIR. Firstly, the anatomy segmentation prior helps the reconstruction “make the best use of” the projections allocated to that phase, but does not utilize information encoded in projections allocated to other phases. Thus, in extreme under-sampling cases, AAIR is unlikely to recover anatomical details that are not contained in the projections. Secondly, the improvements in image quality were mainly observed in terms of visibility of high contrast objects such as tumors and vessels in the lungs, but not for differentiation between low contrast structures such as tumors in soft tissues since they are difficult to segment from 4D CBCT images. These limitations can be improved by combining AAIR with methods that utilize information from additional projections or scans such as PICCS (using the 3D motion blurred image or the planning CT as the prior) (Chen et al, 2008; Leng et al, 2008b) or projection sharing (O’Brien et al, 2014). Thirdly, AAIR was only tested with a standard clinical 4D acquisition protocol in this study, and its performance in extremely low dose or sparse sampling scenarios is yet to be investigated. It is possible that in these challenging cases the inferior image quality leads to faulty anatomy segmentation which could potentially bias the solution. Lastly, despite the much improved computational efficiency, it still takes 15 minutes or more for AAIR to reconstruct a single phase. Further efficiency gains can be realized through GPU implementation, which may speed up the reconstruction process by a factor of 20 or more (Jia et al, 2010; Tian et al, 2011), thereby potentially facilitating AAIR for practical use.
SNR and CNR were used as surrogates to assess potential improvements in image quality for the patient scan in the absence of a ground truth, the limitation of which is that the quantitative results do not necessarily represent the accuracy of the reconstruction and the clinical usability of the images. Furthermore, the improved CNR values of the tumor and the bony anatomy imply but do not guarantee better visibilities of fine anatomical details. These limitations can be overcome by simulating clinical CBCT scans with a realistic noise model (Wang et al, 2014), in which case a ground truth is available, and clinically relevant metrics such as the detectability index (Popescu and Myers, 2013) can be calculated.
It is noteworthy that although AAIR is presented for thoracic 4D CBCT reconstruction, the core concept of AAIR, i.e. exploiting general anatomical knowledge in the form of anatomy segmentation, is not limited to thoracic CBCT scans, and may also be applied to other anatomical regions and imaging modalities.
5. Conclusion
In this paper, we demonstrated, for the first time, a proof of concept that the use of anatomy segmentation can improve thoracic 4D CBCT reconstruction. The proposed Anatomical-Adaptive Image Regularization (AAIR) method incorporates the anatomy segmentation prior into the ASD-POCS framework by a heuristic approach. Using a phantom and a patient study, we have shown that compared to other iterative methods, AAIR not only significantly improves image quality in terms of reconstruction accuracy, signal-to-noise ratio, and contrast-to-noise ratio, but also shortens the computation time by over 50% compared to conventional TV minimization methods. Further development in AAIR is required to facilitate AAIR for practical use.
Acknowledgments
This project is supported by an NHMRC Australia Fellowship, Cancer Institute NSW Early Career Fellowship, NHMRC project grant 1034060, US NCI P01CA116602, and an International Postgraduate Research Scholarship. We thank Jeff Barber, Dr Fiona Hegi-Johnson, and Dr Roland Yeghiaian-Alvandi for providing the patient data. We thank the anonymous reviewers for their valuable comments which helped improve the paper.
Appendix A. Soft tissue segmentation with connectivity constraints
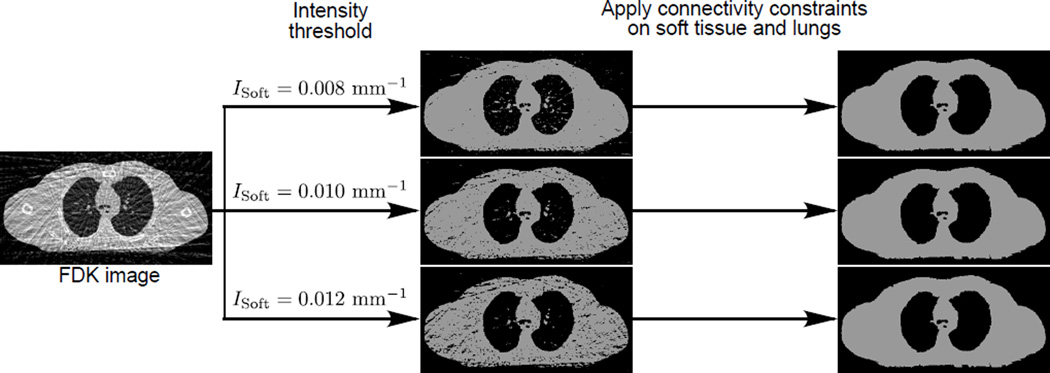
Fig. A1 shows the segmentation of soft tissue with different values of ISoft before and after the connectivity constraints of the soft tissue and lungs are applied. It can be seen that although different values of ISoft may produce very different thresholded images, the connectivity constraints were able to correct for the mis-included and mis-excluded regions, leading to almost identical segmentation results. Thus, soft tissue segmentation is in general not sensitive to the selection of ISoft.
Figure A1.
The segmentation of soft tissue (phantom data) with different values of ISoft before and after the connectivity constraints of the soft tissue and lungs are applied.
Appendix B. Pseudo code for AAIR
In the pseudo code below, N is the number of reconstructed pixels, M is the number of projections, and p̃ is the projection set with pi being its element.
| 1: | β(1) ← 1; βred ← 0.99; α(1) ← 0.05; αred ← 0.9; | ||
| 2: | tol ← 0.11; NTV ← 20; rmax ← 0.9; | ||
| 3: | λ(1) ← 1; γ ← 4; | ||
| 4: | MaxIteration ← 1000; Δfmin ← 2 × 10⁻⁴; | ||
| 5: | f⃗(0) ← f⃗FDK | ⊲ Use FDK image as the initial image | |
| 6: | for k ← 1, MaxIteration do | ⊲ main loop | |
| 7: | for j ← 1,N do | ⊲ POCS step via SART with positivity constraint. | |
| 8: | |||
| 9: | end for | ||
| 10: | |||
| 11: | |||
| 12: | res(k) ← ‖p̃ − Rf⃗(k)‖ | ||
| 13: | if k = 1 then | ||
| 14: | ⊲ Initialize TV step size | ||
| 15: | end if | ||
| 16: | ← AnatomySegmentation (f⃗(k)) | ||
| 17: | for kTV ← 1,NTV do | ||
| 18: | |||
| 19: | f⃗(k) ← f⃗(k) + α(k)d⃗fAATV | ||
| 20: | end for | ||
| 21: | |||
| 22: | if then | ⊲ Stopping criterion | |
| 23: | break; | ||
| 24: | else | ||
| 25: | β(k+1) ← β(k) × βred | ⊲ Calculate new step sizes | |
| 26: | if and res(k) > tol then | ||
| 27: | α(k+1) ← α(k) × αred | ||
| 28: | end if | ||
| 29: | |||
| 30: | end if | ||
| 31: | end for | ||
| 32: |
return
|
||
Appendix C. 4D reconstructed phantom and patient images
Fig. C1 and Fig. C2 show the sagittal views of all ten phases of the reconstructed images for the phantom and the patient cases, respectively.
References
- Andersen A, Kak A. Simultaneous algebraic reconstruction technique (SART) - a superior implementation of the ART algorithm. Ultrasonic Imaging. 1984;6(1):81–94. doi: 10.1177/016173468400600107. [DOI] [PubMed] [Google Scholar]
- Bergner F, Berkus T, Oelhafen M, Kunz P, Pan T, Grimmer R, Ritschl L, Kachelriess M. An investigation of 4D cone-beam CT algorithms for slowly rotating scanners. Med. Phys. 2010;37(9):5044–5053. doi: 10.1118/1.3480986. [DOI] [PubMed] [Google Scholar]
- Chan C, Fulton R, Barnett R, Feng DD, Meikle S. Postreconstruction nonlocal means filtering of whole-body PET with an anatomical prior IEEE Trans. Image Process. 2014;33(3):636–650. doi: 10.1109/TMI.2013.2292881. [DOI] [PubMed] [Google Scholar]
- Chan C, Fulton R, Feng DD, Meikle S. Regularized image reconstruction with an anatomically adaptive prior for positron emission tomography. Phys. Med. Biol. 2009;54(24):7379–7400. doi: 10.1088/0031-9155/54/24/009. [DOI] [PubMed] [Google Scholar]
- Chantas G, Galatsanos N, Molina R, Katsaggelos A. Variational Bayesian Image Restoration With a Product of Spatially Weighted Total Variation Image Priors. IEEE Transactions on Image Processing. 2010;19(2):351–362. doi: 10.1109/TIP.2009.2033398. [DOI] [PubMed] [Google Scholar]
- Chen GH, Tang J, Leng S. Prior image constrained compressed sensing (PICCS): A method to accurately reconstruct dynamic CT images from highly undersampled projection data sets. Med. Phys. 2008;35(2):660–663. doi: 10.1118/1.2836423. [DOI] [PMC free article] [PubMed] [Google Scholar]
- Chen Q, Montesinos P, Sen Sun Q, Heng PA, Xia DS. Adaptive total variation denoising based on difference curvature. Image Vision. Comput. 2010;28(3):298–306. [Google Scholar]
- Choi K, Wang J, Zhu L, Suh TS, Boyd S, Xing L. Compressed sensing based cone-beam computed tomography reconstruction with a first-order method. Med. Phys. 2010;37(9):5113–5125. doi: 10.1118/1.3481510. [DOI] [PMC free article] [PubMed] [Google Scholar]
- Dong W, Yang X, Shi G. Compressive sensing via reweighted TV and nonlocal sparsity regularisation. Electron. Lett. 2013;49(3):184–185. [Google Scholar]
- Feldkamp L, Davis L, Kress J. Practical cone-beam algorithm. J. Opt. Soc. Am. A Opt. Image. Sci. Vis. 1984;1(6):612–619. [Google Scholar]
- Gordon R, Bender R, Herman G. Algebraic reconstruction techniques (ART) FOR 3-dimensional electron microscopy and X-ray photography. J. Theor. Biol. 1970;29(3) doi: 10.1016/0022-5193(70)90109-8. 471–&. [DOI] [PubMed] [Google Scholar]
- Haas B, Coradi T, Scholz M, Kunz P, Huber M, Oppitz U, Andre L, Lengkeek V, Huyskens D, van Esch A, Reddick R. Automatic segmentation of thoracic and pelvic CT images for radiotherapy planning using implicit anatomic knowledge and organ-specific segmentation strategies. Phys. Med. Biol. 2008;53(6):1751–1771. doi: 10.1088/0031-9155/53/6/017. [DOI] [PubMed] [Google Scholar]
- Harsolia A, Hugo GD, Kestin LL, Grills IS, Yan D. Dosimetric advantages of four-dimensional adaptive image-guided radiotherapy for lung tumors using online cone-beam computed tomography. Int. J. Radiat. Oncol. 2008;70(2):582–589. doi: 10.1016/j.ijrobp.2007.08.078. [DOI] [PubMed] [Google Scholar]
- Jia X, Lou Y, Li R, Song WY, Jiang SB. GPU-based fast cone beam CT reconstruction from undersampled and noisy projection data via total variation. Med. Phys. 2010;37(4):1757–1760. doi: 10.1118/1.3371691. [DOI] [PubMed] [Google Scholar]
- Kavanagh A, Evans PM, Hansen VN, Webb S. Obtaining breathing patterns from any sequential thoracic x-ray image set. Phys. Med. Biol. 2009;54(16):4879–4888. doi: 10.1088/0031-9155/54/16/003. [DOI] [PubMed] [Google Scholar]
- Lauzier PT, Tang J, Chen GH. Prior image constrained compressed sensing: Implementation and performance evaluation. Med. Phys. 2012;39(1):66–80. doi: 10.1118/1.3666946. [DOI] [PMC free article] [PubMed] [Google Scholar]
- Leng S, Tang J, Zambelli J, Nett B, Tolakanahalli R, Chen GH. High temporal resolution and streak-free four-dimensional cone-beam computed tomography. Phys. Med. Biol. 2008b;53(20):5653–5673. doi: 10.1088/0031-9155/53/20/006. [DOI] [PMC free article] [PubMed] [Google Scholar]
- Leng S, Zambelli J, Tolakanahalli R, Nett B, Munro P, Star-Lack J, Paliwal B, Chen GH. Streaking artifacts reduction in four-dimensional cone-beam computed tomography. Med. Phys. 2008a;35(10):4649–4659. doi: 10.1118/1.2977736. [DOI] [PMC free article] [PubMed] [Google Scholar]
- Liu Y, Ma J, Fan Y, Liang Z. Adaptive-weighted total variation minimization for sparse data toward low-dose x-ray computed tomography image. reconstruction Phys. Med. Biol. 2012;57(23):7923–7956. doi: 10.1088/0031-9155/57/23/7923. [DOI] [PMC free article] [PubMed] [Google Scholar]
- Lu J, Guerrero TM, Munro P, Jeung A, Chi PCM, Balter P, Zhu XR, Mohan R, Pan T. Four-dimensional cone beam CT with adaptive gantry rotation and adaptive data sampling. Med. Phys. 2007;34(9):3520–3529. doi: 10.1118/1.2767145. [DOI] [PubMed] [Google Scholar]
- Mckinnon G, Bates R. Towards imaging the beating heart usefully with a conventional CT scanner. IEEE Trans. Biomed. Eng. 1981;28(2):123–127. doi: 10.1109/TBME.1981.324785. [DOI] [PubMed] [Google Scholar]
- Niu T, Zhu L. Accelerated barrier optimization compressed sensing (ABOCS) reconstruction for cone-beam CT: Phantom studies. Med. Phys. 2012;39(7):4588–4598. doi: 10.1118/1.4729837. [DOI] [PMC free article] [PubMed] [Google Scholar]
- O’Brien RT, Kipritidis J, Shieh CC, Keall PJ. Optimizing 4dcbct projection allocation to respiratory bins. Phys. Med. Biol. 2014;59(19):5631. doi: 10.1088/0031-9155/59/19/5631. [DOI] [PubMed] [Google Scholar]
- Popescu LM, Myers KJ. CT image assessment by low contrast signal detectability evaluation with unknown signal location. Med. Phys. 2013;40(11) doi: 10.1118/1.4824055. [DOI] [PubMed] [Google Scholar]
- Rit S, Oliva MV, Brousmiche S, Labarbe R, Sarrut D, Sharp GC. The Reconstruction Toolkit (RTK), an open-source cone-beam CT reconstruction toolkit based on the Insight Toolkit (ITK) J. Phys.: Conf. Ser. 2014;489(1):012079. [Google Scholar]
- Ritschl L, Bergner F, Fleischmann C, Kachelriess M. Improved total variation-based CT image reconstruction applied to clinical data. Phys. Med. Biol. 2011;56(6):1545–1561. doi: 10.1088/0031-9155/56/6/003. [DOI] [PubMed] [Google Scholar]
- Segars WP, Sturgeon G, Mendonca S, Grimes J, Tsui BMW. 4D XCAT phantom for multimodality imaging research. Med. Phys. 2010;37(9):4902–4915. doi: 10.1118/1.3480985. [DOI] [PMC free article] [PubMed] [Google Scholar]
- Shieh CC, Kipritidis J, O’Brien RT, Kuncic Z, Keall PJ. Image quality in thoracic 4D cone-beam CT: A sensitivity analysis of respiratory signal, binning method, reconstruction algorithm, and projection angular spacing. Med. Phys. 2014;41(4) doi: 10.1118/1.4868510. [DOI] [PMC free article] [PubMed] [Google Scholar]
- Sidky EY, Pan X. Image reconstruction in circular cone-beam computed tomography by constrained, total-variation minimization. Phys. Med. Biol. 2008;53(17):4777–4807. doi: 10.1088/0031-9155/53/17/021. [DOI] [PMC free article] [PubMed] [Google Scholar]
- Sonke J, Zijp L, Remeijer P, van Herk M. Respiratory correlated cone beam CT. Med. Phys. 2005;32(4):1176–1186. doi: 10.1118/1.1869074. [DOI] [PubMed] [Google Scholar]
- Strong D, Blomgren P, Chan T. Spatially adaptive local feature-driven total variation minimizing image restoration. Proc. SPIE Annu. Meeting. 1997;3167:222–233. [Google Scholar]
- Tian Z, Jia X, Yuan K, Pan T, Jiang SB. Low-dose CT reconstruction via edge-preserving total variation regularization. Phys. Med. Biol. 2011;56(18):5949–5967. doi: 10.1088/0031-9155/56/18/011. [DOI] [PMC free article] [PubMed] [Google Scholar]
- van Rikxoort EM, de Hoop B, Viergever MA, Prokop M, van Ginneken B. Automatic lung segmentation from thoracic computed tomography scans using a hybrid approach with error detection. Med. Phys. 2009;36(7):2934–2947. doi: 10.1118/1.3147146. [DOI] [PubMed] [Google Scholar]
- Vandemeulebroucke J, Bernard O, Rit S, Kybic J, Clarysse P, Sarrut D. Automated segmentation of a motion mask to preserve sliding motion in deformable registration of thoracic CT. Med. Phys. 2012;39(2):1006–1015. doi: 10.1118/1.3679009. [DOI] [PubMed] [Google Scholar]
- Volpi S, Antonelli M, Lazzerini B, Marcelloni F, Stefanescu D. Segmentation and reconstruction of the lung and the mediastinum volumes in CT images. ISABEL 2009. 2009:1–6. [Google Scholar]
- Wang AS, Stayman JW, Otake Y, Vogt S, Kleinszig G, Khanna AJ, Gallia GL, Siewerdsen JH. Low-dose preview for patient-specific, task-specific technique selection in cone-beam CT. Med. Phys. 2014;41(7) doi: 10.1118/1.4884039. [DOI] [PMC free article] [PubMed] [Google Scholar]
- Wang Z, Bovik A, Sheikh H, Simoncelli E. Image quality assessment: From error visibility to structural similarity. IEEE Trans. Image Process. 2004;13(4):600–612. doi: 10.1109/tip.2003.819861. [DOI] [PubMed] [Google Scholar]
- Yuan Q, Zhang L, Shen H. Regional spatially adaptive total variation super-resolution with spatial information filtering and clustering. IEEE Trans. Image Process. 2013;22(6):2327–2342. doi: 10.1109/TIP.2013.2251648. [DOI] [PubMed] [Google Scholar]
- Zheng Z, Sun M, Pavkovich J, Star-Lack J. Fast 4D cone-beam reconstruction using the McKinnon-Bates algorithm with truncation correction and nonlinear filtering. Proc. SPIE. 2011;7961 79612U–79612U–8. [Google Scholar]


