

Abstract
BACKGROUND: Low blood glucose and HbA1c levels are recommended in the literature on management of diabetes. However, data have shown that low blood glucose is associated with serious adverse effects for the patients and the recommendation has been criticized. Therefore, this article revisits the relationship between HbA1c and all-cause mortality by a meta-analysis of observational studies. AIM: The aim of this study is to determine whether there is a J- or U-shaped non-linear relationship between HbA1c and all-cause mortality in type 2 diabetes patients, implying an increased risk to premature all-cause mortality at high and low levels of HbA1c. METHODS: A comprehensive literature search was conducted using PubMed, Medline, and Cochrane Library databases with strict inclusion/exclusion criteria. The published adjusted hazard ratios (HR) with 95% confidence intervals of all-cause mortality for each HbA1c category and per study were analyzed. Fractional polynomial regression was used with random effect modeling to assess the non-linear relationship of the HR trends between studies. Seven eligible observational studies with a total of 147,424 participants were included in the study. RESULTS: A significant J-shaped relationship was observed between HbA1c and all-cause mortality. Crude relative risk for all-cause mortality identified a decreased risk per 1% increase in HbA1c below 7.5% (58 mmol/mol) (0.90, CI 0.86-0.94) and an increased risk per 1% increase in HbA1c above 7.5% (58 mmol/mol) (1.04, CI 1.01-1.06). Observational studies revealed a J-shaped relationship between HbA1c and all-cause mortality, equivalent to an increased risk of mortality at high and low HbA1c levels. CONCLUSIONS: This increased mortality at high and low HbA1c levels has significant implications on investigating optimum clinical HbA1c targets as it suggests that there are upper and lower limits for creating a 'security zone' for diabetes management.
Keywords: type 2 diabetes, HbA1c, all-cause mortality, meta-analysis, non-linear regression, body mass index, risk factor, cardiovascular disease, comorbidity
Abbreviations: ACCORD - Action to Control Cardiovascular Risk for Diabetes; ADVANCE - Action in Diabetes and Vascular Disease: Preterax and Diamicron Modified Release Controlled Evaluation; BMI - body mass index; CI - confidence interval; HbA1c - glycosylated hemoglobin A; HR - hazard ratio; PRISMA - Preferred Reporting Items for Systematic Re-views and Meta-Analyses; RR - relative risk; WHO - World Health Organization
1. Introduction
Type 2 diabetes (T2D) is one of the most serious burdens on public health in terms of mortality, morbidity, and cost to the health care system. The increase in prevalence of chronic diseases such as cardiovascular disease, hypertension, and obesity in both developed and developing nations highlights the increasing global burden, to which T2D is contributing as a common comorbidity [1]. The projected financial burden and mortality associated with complications of diabetes are evidence enough that early detection and minimization of T2D adverse effects are critical measures worldwide [2].
Glycosylated hemoglobin (HbA1c) is used as a screening tool of diabetes in clinical practice throughout the United Kingdom, United States, and Australia [3, 4]. The World Health Organization (WHO) has specified cut-off values for diagnosis of specific stages of diabetes [5]; it has not, however, published recommendations on the appropriate target HbA1c values for the management of the disease. This is largely due to the unclear and conflicting literature reporting about the HbA1c/mortality relationship.
The research in this area was dominated by clinical trials up to 2008, which gave rise to the different and frequently commentated conclusions. Many clinical trials suggest a decrease in all-cause mortality as HbA1c values decrease [6-8], while others suggest that there is no association [9-11]. The debate has continued because of the early cessation of the Action to Control Cardiovascular Risk for Diabetes (ACCORD) trial [12], because there was an increased mortality in the treatment group that included patients who were trying to achieve low HbA1c levels. Since 2008, a number of meta-analyses have been conducted on these clinical studies to highlight further the conflicting results [13-19].
Several observational studies have explored the HbA1c and all-cause mortality relationship since the publication of prior clinical trials and subsequent meta-analyses; these studies present interesting results. All studies show an increase in all-cause mortality with HbA1c values, where only the degree and pattern of association differ. Whilst most studies highlight a linear relationship [20-29], several studies report a J- or U-shaped relationship [30-34], indicating an increased all-cause mortality at lower HbA1c levels similar to that seen in the ACCORD trial.
The difference between the conclusions drawn from clinical trials and observational studies deserves further investigation. The need for a meta-analysis in observational studies has been long reported [35]. Despite two meta-analyses reporting a linear relationship [36, 37], there is no analysis investigating the overall trend and allowing for a non-linear relationship. Observational studies have the ability to detect patterns of mortality over a larger range of HbA1c values than current clinical trial results. A meta-analysis flexibly utilizing statistical methods will allow deeper investigation of the HbA1c and all-cause mortality relationship to seek for potential causes of a non-linear relationship based on the available data.
The objective of this meta-analysis is to determine whether there is a J- or U-shaped relationship between HbA1c and all-cause mortality in T2D patients within observational studies.
2. Methods
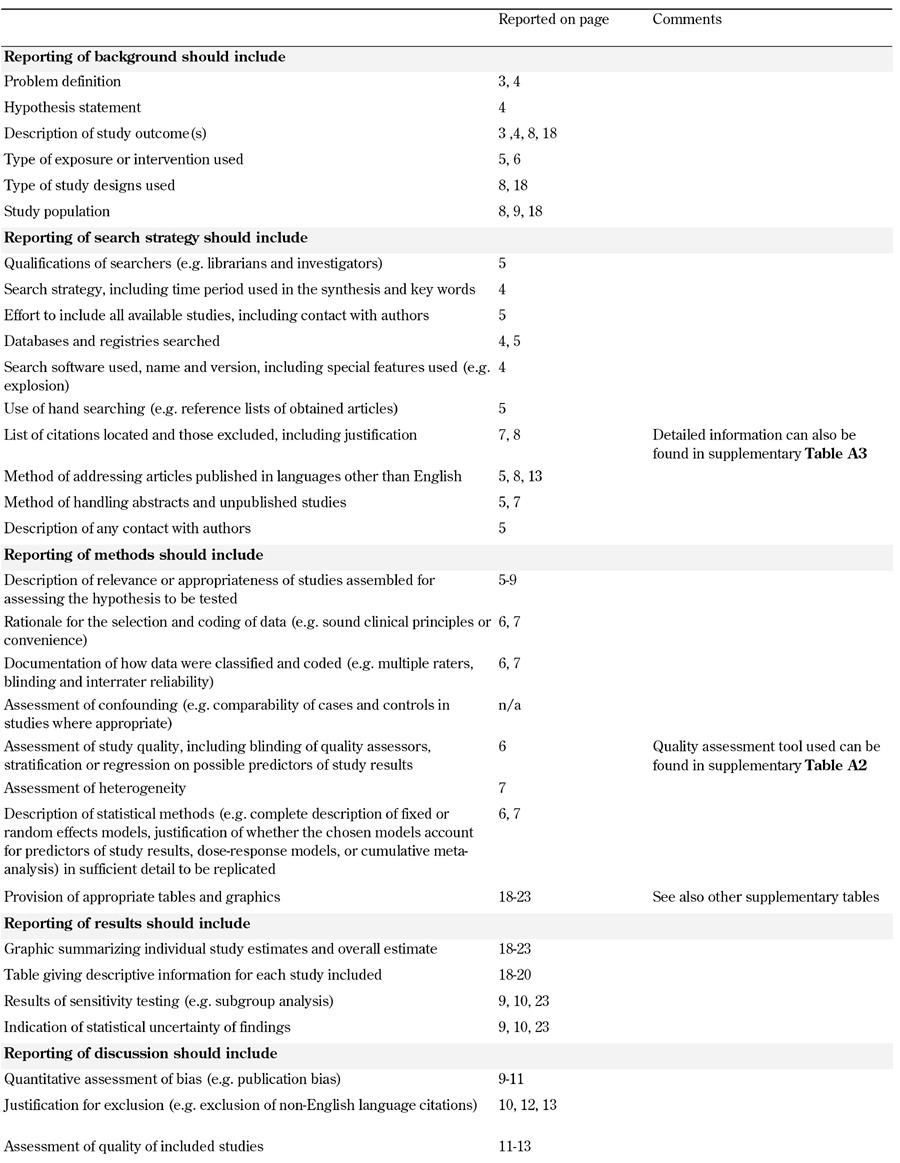
This meta-analysis was conducted according to the PRISMA statement [38], and the proposed reporting (MOOSE) checklist and recommendations of the Observational Studies in Epidemiology group (Table A1, in the Appendix) [39].
Table A1. MOOSE checklist.
2.1 Study selection
A systematic literature search was conducted in May 2013 utilizing PubMed, Medline (OVID), EMBASE, and Cochrane Library databases. A combination of the following MeSH terms were used: 'diabetes mellitus, type 2', 'diabetes complications', 'haemoglobin A, glycosylated', 'mortality', 'survival', 'aged', and 'adult', using 'AND' and 'OR' for appropriate combinations.
The contents of 2,255 publications identified by literature search were reviewed independently by each of the authors to determine whether they met the eligibility criteria. Studies were eligible for inclusion when they satisfied the following criteria:
1. HbA1c levels measured at baseline.
2. Patients with diagnosed T2D included.
3. Study population consisted of adult or aged patients.
4. Hazard ratios (HRs) recorded for all-cause mortality.
5. Study design classified as observational study.
6. HRs available for more than two HbA1c categories, ranges, or values.
7. Human study.
8. Written in the English language.
Studies were excluded when they fulfilled one or more of the following criteria:
1. HR or relative risk (RR) of all-cause mortality for HbA1c were not exposure variables.
2. Not conducted on adult patients with diabetes.
3. HbA1c not measured at baseline.
4. Measured HR in only two HbA1c categories.
5. Produced results as HR per 1% increase in HbA1c.
If the full-text could not be found through the searched databases, journals were contacted directly. Full texts of all necessary articles were acquired and reviewed.
The selection was carried out in the following three steps (Figure 1):
Figure 1.
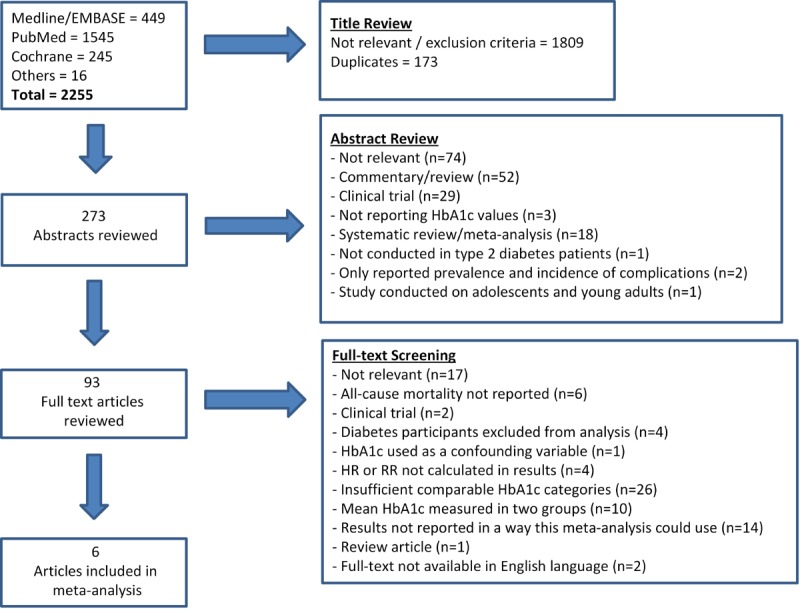
Systematic literature search flow chart.
1. Each of the titles was screened for relevance using exclusion criteria.
2. Duplicates were removed and abstracts were reviewed within inclusion and exclusion criteria.
3. A thorough full-text review of the remaining publications was conducted to determine whether the studies met the inclusion criteria.
Reference lists, citations, and review articles were manually reviewed for additional studies. These titles and abstracts were similarly screened and subsequently included if they satisfied the eligibility criteria. Experts were also asked to identify additional studies. See Figure 1 for a summary of the screening and literature review process.
The correspondent author of one study was contacted to request unpublished information necessary for the meta-analysis [40]. However, the information was not supplied and therefore the study was excluded.
2.2 Quality assessment
To determine the methodological quality of the studies included in the meta-analysis, we used modified criteria recommended by BioMed Central for study evaluation [41]. The following criteria were used for evaluating study quality:
1. Source of information, including the time of data collection.
2. Study designs, including type of study, appropriateness to answer research questions, measurement of exposure, ascertainment of outcomes, statistical techniques, and control for confounding factors.
3. Valid interpretation of results.
4. Discussion.
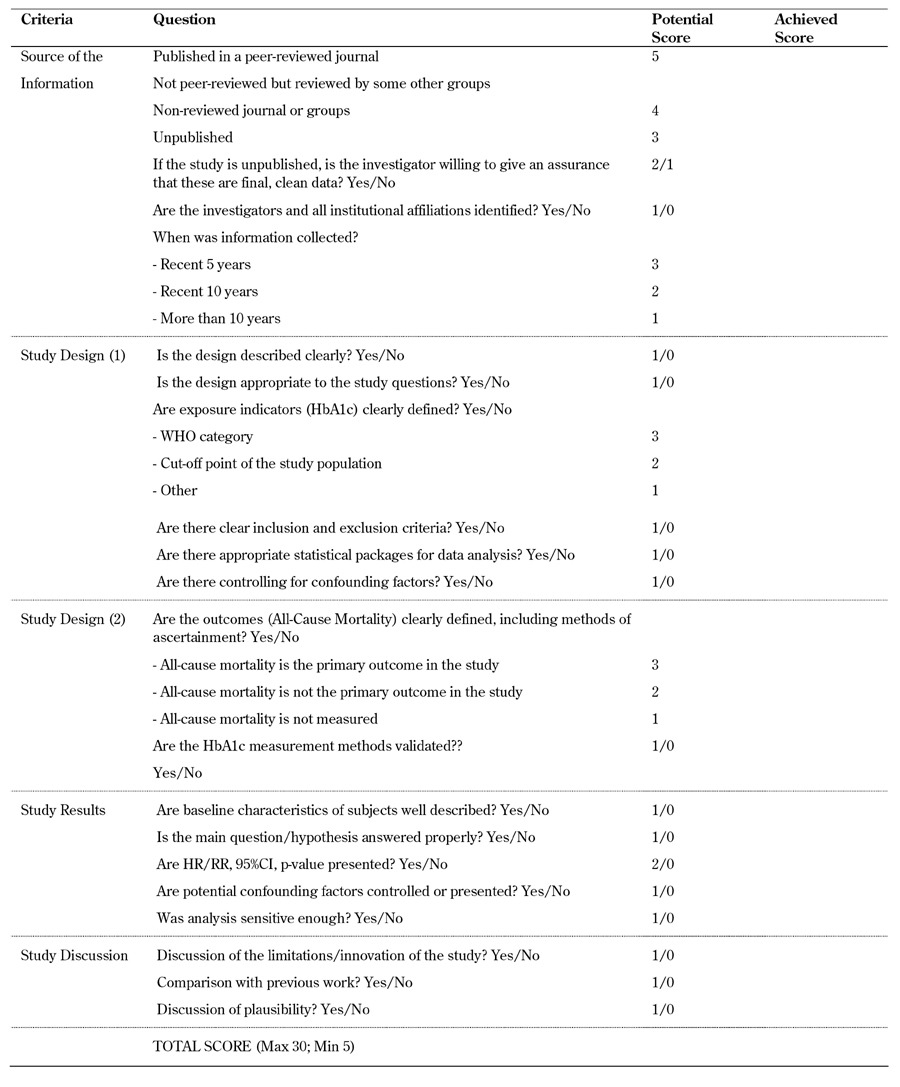
A score was assigned to each study based on our assessment criteria and the quality assessment scheme conducted by Phung et al. [42]. Each study could obtain a quality score between 5 and 30, whilst a cut-off point of 25 was used to qualify for inclusion in our study. This cut-off score corresponded to the minimum required quality. Details of the quality assessment template can be found in supplementary Table A2 (in the Appendix).
Table A2. Quality assessment template.
2.3 Data synthesis and analysis
Data was analyzed using Stata 12.0 [43]. The analysis was conducted in four steps:
1. Pooled effect sizing, using a random effects model to ensure the correct adjustment and influence over the meta-analytic trend, was assigned to each study using sample size.
2. Fractional polynomial regression was used to assess the non-linear relationship and generate coefficients.
3. Values obtained from the fractional polynomial regression were then used to predict the fitted average curve of the studies included in the meta-analysis.
4. Poisson regression was used to calculate crude relative risk (RR) per 1% increase in HbA1c in each direction of the non-linear curve to provide further numerical evidence.
The analysis was conducted by treating HbA1c as a continuous variable to fit the appropriate fractional polynomial regression model. To convert the HbA1c categorical data obtained from each study into a continuous variable, we used the recommendations and methods suggested by Berlin et al. [44] and Il’Yasova et al. [45]. The midpoint (arithmetic mean) was used in the case of a-b categories, while 0.8*a was used for categories as < a% HbA1c. In the case of > a% HbA1c, we utilized the an + (an- an-1) formula [45]. This is true for all studies included in the meta-analysis with the exception of both cohorts included from Currie et al. where we used the mean HbA1c of each category, as provided by the authors [31].
Because of the differences in HbA1c categories used in the studies, we needed to adjust the HR reference values to ensure that the study trends were better comparable in the fractional polynomial analysis [45]. Each of the studies were adjusted so that the reference value (HR = 1) was located as near to 7.5% (58 mmol/mol) HbA1c as possible. This arbitrary reference value was selected upon observation that each of the included studies produced an HR for an HbA1c value of 7.5% (58 mmol/mol) or within 0.05%.
To test for heterogeneity between studies we used the coefficient of inconsistency (I2) as recommended by Higgins et al. [46]. This measure provides a degree of inconsistency in the studies’ findings by describing the percentage of total variation across studies which is due to heterogeneity [46]. The heterogeneity degrees ranged from 0 to 100%; we categorized them as low (<25%), moderate (25% to 75%), and high (≥75%).
3. Results
3.1 Included and excluded studies
The systematic literature search initially identified 2,255 studies, 1,809 of which were excluded because of irrelevance or matching exclusion criteria. Duplicates (n = 173) were also excluded at this stage. We reviewed 273 abstracts and excluded studies for the following reasons:
- Non-relevance (n = 73).
- Commentaries or review articles (n = 52).
- Reports based on clinical trial data (n = 29).
- Systematic reviews or meta-analyses (n = 18).
In the final screening stage, we reviewed the full text of 93 articles, and excluded a total of 87 studies. The main reasons for excluding studies at this stage were as follows:
- Non-relevance (n = 17).
- Reported HRs for less than 5 HbA1c categories (n = 26).
- Only mean HbA1c reported in two population groups (n = 10).
- Results reported in such a way that they could not be used in this meta-analysis (n = 13).
Some of the reviewed studies reported results in terms of HR per 1% increase of HbA1c. These studies were excluded as their analysis is only suitable to demonstrate a linear relationship. Similarly, we excluded studies which had only two comparable HRs of HbA1c values because of their inability to demonstrate a non-linear relationship. During the statistical analysis process, we further excluded studies with HRs for less than five HbA1c categories [20-24, 27, 47, 48]. Evidence of exclusion is highlighted in the results.
Full texts could not be found in the English language for two articles [49, 50], which were subsequently not included in the meta-analysis. The full text of Bramlage et al. was available in German and investigated the prevention of cardiovascular disease through various biomechanisms, specifically by blocking the endocannabinoid system [50]. HbA1c was discussed as a risk factor for cardiovascular disease, but HRs for risk to all-cause mortality was not reported. The full text of Kim et al. was published in Korean and reported on HbA1c as a summary of diabetes management in a particular population [49]. This form of HbA1c values could not be utilized in this meta-analysis. The complete search summary can be seen in Figure 1.
Currie et al. reported results on two separate cohorts included in the single publication [31]. Both of these retrospective cohorts fitted the inclusion criteria, and were included in the meta-analysis individually. Each was named for simplicity and easy reference, Currie et al. cohort 1 and Currie et al. cohort 2.
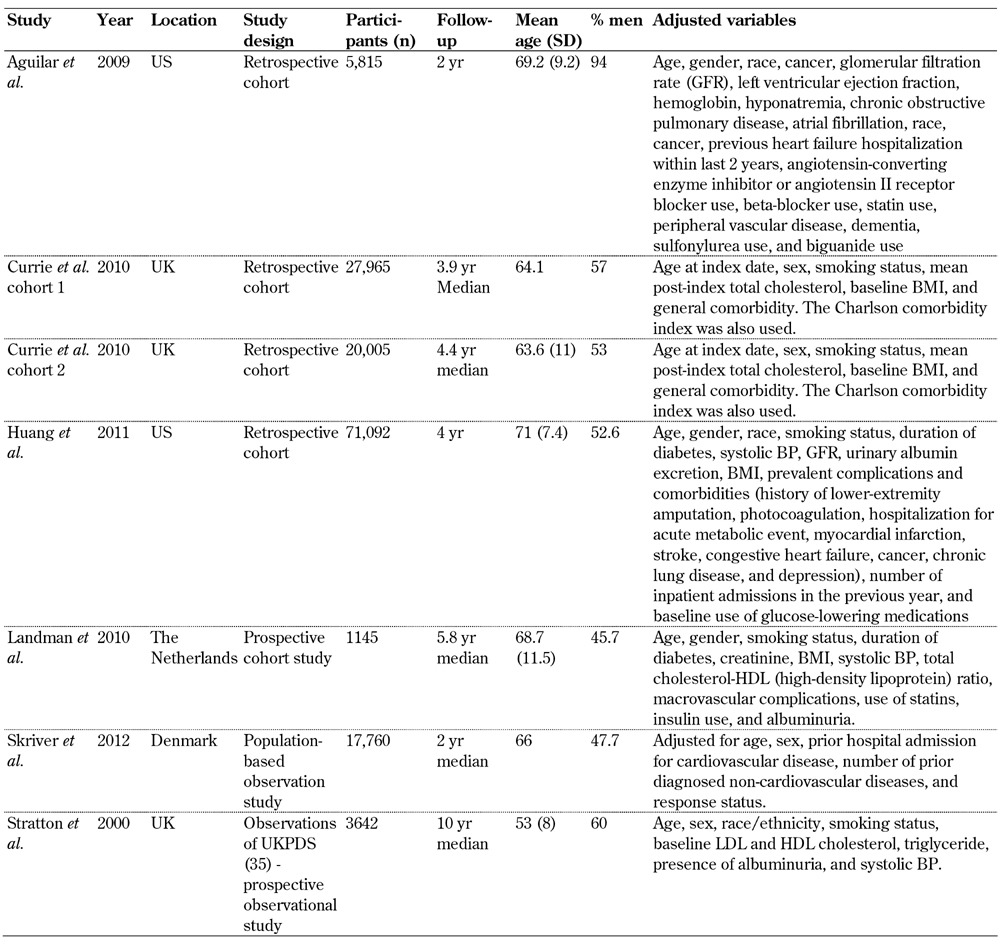
The studies included in the meta-analysis were retrospective cohort studies (n = 4) [30-32], prospective studies (n = 2) [26, 33], and a population-based observational study [34]. Furthermore, the majority of the studies were conducted in the UK [26, 31], the US [30, 32], Denmark [34], and the Netherlands [33]. Most of the studies had a median follow-up period of 2-4.4 years, with the exception of Stratton et al. (2000) [26] which had a median of 10 years' follow-up. The number of participants in the studies ranged from 1,145 [33] to 71,092 [32], which combined to a total 147,424 included participants.
Of the studies included, the main confounding variables adjusted for in the analysis were age, gender, ethnicity/race, smoking status, blood pressure, cholesterol, BMI, and various comorbidities associated with the specific area of research. Specific adjustment variables used in each study are highlighted in Table 1.
Table 1. Summary of the studies included in meta-analysis.
As per our quality assessment outlined in supplementary Table A2 (in the Appendix), all of the studies hold a quality score of 80-100%. This translates that all included studies achieved a score above the cut-off value of 25 out of 30; they could be regarded as high quality research articles.
3.2 HbA1c and all-cause mortality
Preliminary analysis included fourteen studies with more than two HbA1c categories [20-24, 26, 27, 30-34, 47, 48], which significantly influenced the fractional polynomial curve so that a non-linear curve was not evident (Figure 2). Since the non-linear relationship could be better detected with multiple HbA1c categories, further analysis was conducted. We excluded studies with HRs for less than five HbA1c categories and a distinct non-linear J-shaped curve was observed (Figure 3) (p < 0.0001). This means that diabetes patients with high HbA1c levels have the highest risk of all-cause mortality, while patients with low HbA1c are also exposed to a high risk, albeit less than that associated with high HbA1c. By comparing Figures 2 and 3 the following is apparent: when studies reporting HR for less than 5 HbA1c categories were included, the analysis was not detecting a significant J-shaped non-linear relationship. This translates to both Figure 2 and 3, demonstrating an increased risk of all-cause mortality at higher HbA1c. However, only Figure 3, which includes studies with more than 4 HbA1c categories, had the power to detect an increased risk at lower HbA1c levels.
Figure 2. All-cause mortality Hazard ratios (HR) for HbA1c values.
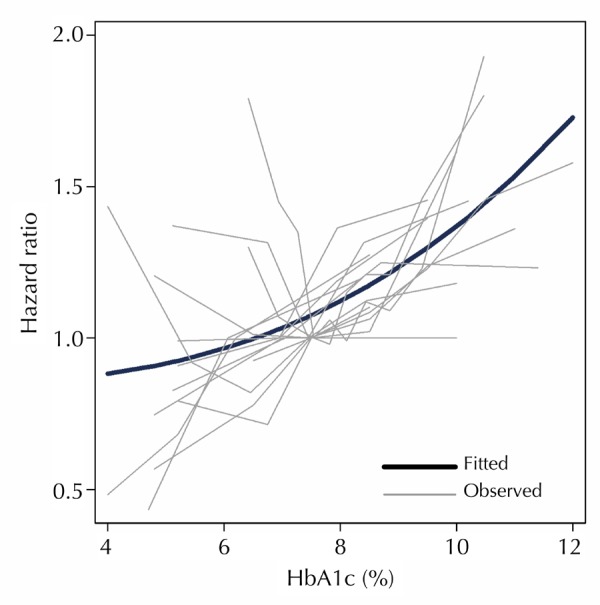
Observed studies plotted against the predicted curve from regression analysis for studies with HRs reported for more than two HbA1c categories.
Figure 3. All-cause mortality HR for HbA1c values.
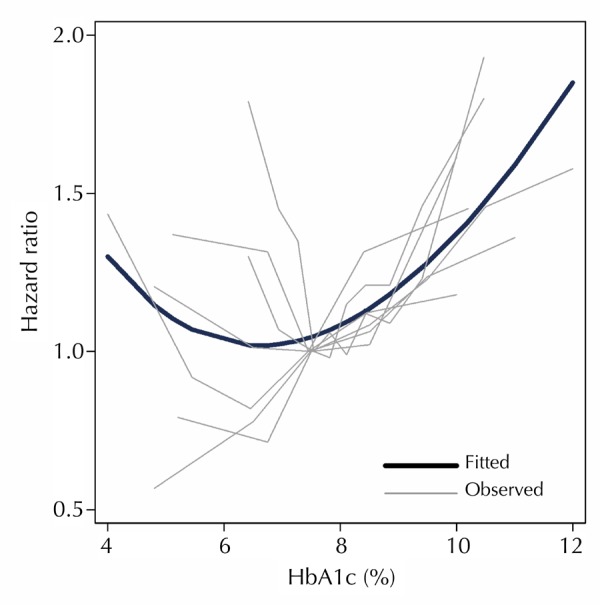
Observed studies plotted against the predicted curve from regression analysis for studies with HRs reported for more than four HbA1c categories. Equation of the fitted curve: HR = 4.55018 - 1.53970*HbA1c + 0.53225 (HbA1c*ln(HbA1c)).
To investigate further the trend observed in Figure 3 and provide additional numerical support, we calculated crude all-cause mortality RR per 1% increase in HbA1c within studies for HbA1c values above and below 7.5% (58 mmol/mol). Further data were extracted, and person-years for each HbA1c group were estimated from the studies (supplementary Table A3, see Appendix). Using a Poisson regression model, we conducted further analysis on the trends by separating the HbA1c categories into two groups of <7.5% (58 mmol/mol) and ≥7.5% (58 mmol/mol) HbA1c. Two studies were excluded from this analysis as they did not report the crude number of events (all-cause mortality) [32, 33].
Table A3. Summary of data extracted from studies to calculate crude all-cause mortality relative risk (RR).
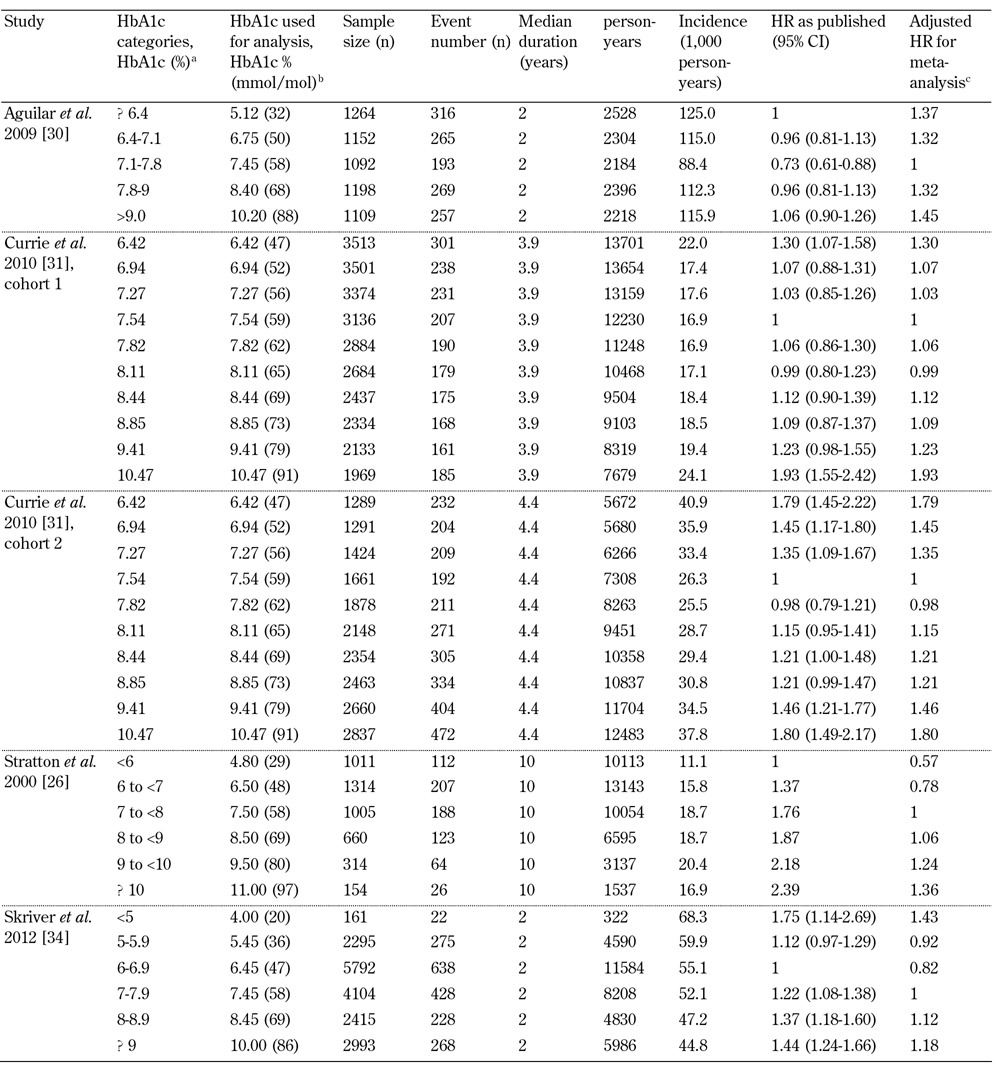
Legend: a As presented in publication. b HbA1c values were converted from categorical into continuous data for analysis. c HRs were adjusted so the arbitrary reference value (HR = 1) was as close to 7.5% (58 mmol/mol) HbA1c as possible.
Figure 4 demonstrates the crude pooled RRs for each group of HbA1c values and highlights the significant decreased risk of death as HbA1c % increases below 7.5% HbA1c (58 mmol/mol) (RR 0.90; CI 0.86-0.94, per 1% increase HbA1c). The percentages of total variation amongst the studies in this group caused by heterogeneity was high (I2 92.1%, p < 0.001).
Figure 4.
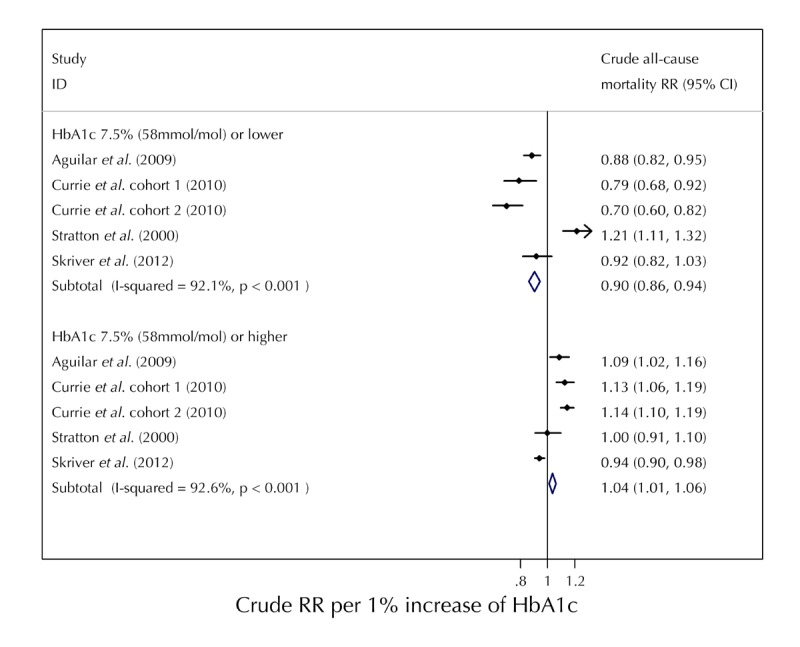
Calculated crude relative risks (RR) per 1 % increase of HbA1c values for ≤7.5% (≤58 mmol/mol) and ≥7.5% (≥58 mmol/mol).
Furthermore, we observed an increased risk in all-cause mortality for the group of HbA1c values above 7.5% (58 mmol/mol) as HbA1c increased. The pooled RR was 1.04 (CI, 1.01-1.06) per 1% increase in HbA1c. The percentages of total variation amongst the studies in this group caused by heterogeneity was also high and significant (I2 92.6%, p < 0.001).
Figure 4 demonstrates that, although there is high heterogeneity amongst the studies, the analysis determined a significantly increased risk of all-cause mortality at both high and low levels of HbA1c. This provides further evidence for the overall J-shaped trend observed in Figure 3, suggesting that diabetes patients with low or high HbA1c are at higher risk of all-cause mortality compared with patients with relatively moderate HbA1c levels.
4. Discussion
This meta-analysis highlighted an observed J-shaped relationship between HbA1c values and all-cause mortality in observational studies. This means an increased risk of all-cause mortality in low- and high-HbA1c groups. Also, this J-shaped trend was significant in studies which measured all-cause mortality rates and HRs in more than four HbA1c categories. Crude RR per 1% increase of HbA1c demonstrated a significantly increased risk of all-cause mortality for HbA1c values both above and below 7.5% (58 mmol/mol) HbA1c.
The J-shape relationship of this meta-analysis supports the results of ACCORD trial that showed an increased risk of mortality in T2D patients with <6% (<42 mmol/mol) HbA1c compared to those with 7.0-7.9% (53-63 mmol/mol) (RR 1.22) [12]. By locating the HbA1c values of the ACCORD trial standard and treatment groups on the fitted curve in Figure 3, it appears that the ACCORD trial reflects the comparative relationship observed in this meta-analysis below 7.5% (≤58 mmol/mol) HbA1c. The crude RR obtained in Figure 4 within the <7.5% (≤58 mmol/mol) HbA1c group showed a 10% increased risk of all-cause mortality (RR 0.90), which is slightly less than the 22% risk found in the ACCORD trial (RR 1.22), but highlights an increased risk nonetheless. This difference may be attributable to the crude mortality rates and estimated person-years which were used and/or the inclusion of the Stratton et al. [26] study which negatively influenced the meta-analysis result in this group.
In contrast, the Action in Diabetes and Vascular Disease: Preterax and Diamicron Modified Release Controlled Evaluation (ADVANCE) trial compared HbA1c values of 6.5% (48 mmol/mol) in the treatment group with 7.3% (56 mmol/mol) in the standard group, and obtained a HR of 0.93 for all-cause mortality [9]. By locating these HbA1c values on the fitted curve in Figure 3, it appears that the given HR would be expected to be indicated by the gradient of the curve between these values. It also appears that each of the ACCORD and ADVANCE trials are simply reporting a relationship at a different position along the curve predicted by these observational studies.
The studies included in this meta-analysis were of high quality and justifiably appropriate for inclusion. However, there were differences in the study populations resulting in heterogeneous HRs. All studies in the final analysis included elderly patients with a mean age for each study of over 63.6 years, except for Stratton et al. [26] (53 years). It can be seen in Figure 4 that Stratton et al. was the only study to report a decreased risk of mortality below 7.5% (58 mmol/mol), suggesting age may play a role in the elevated risk.
Skriver et al. had a significantly lower number of participants in their <5% (<31 mmo/mol) HbA1c group [34], which could have dramatically influenced the reported high risk to all-cause mortality (HR = 1.43) in low HbA1c levels. Aguilar et al. conducted their study in the most noticeably different population within our analysis [30]. This population had a mean age of 69.2 years, and all individuals had suffered from heart failure. This places them at high risk of mortality irrespective of HbA1c level. After Cox adjustment, we still observed high mortality risk in the two lowest HbA1c groups (HR = 1.37, HR = 1.32). The mortality risk in this population appears to affect significantly the curve for HbA1c values less than 7.45% (58 mmol/mol).
This provides support for Rutter's hypothesis that patients with high comorbidities are more susceptible to an increased risk of all-cause mortality at lower HbA1c [35]. However, the exact range of HbA1c values of the association varies between populations.
The accuracy and reliability of the models used in this meta-analysis and the use of observational studies are strongly supported by their appropriateness to fit the relationship determined in two of the most cited and highly debated studies in the literature [9, 12]. Although the ADVANCE and the ACCORD trials report different relationships between all-cause mortality and HbA1c, the fractional polynomial regression of the observational studies is able to capture the overall trend over a larger range, while still providing support of each relationship.
The two previous meta-analyses of observational studies [36, 37] using RRs of 1% increase in HbA1c concluded that all studies highlighted an increased risk to cardiovascular mortality when HbA1c is increased. Figure 3 implies the following: if you were to calculate RRs between 6% (42 mmol/mol) HbA1c and any value above 8.5% (69 mmol/mol) you would expect to achieve an increased relative risk of mortality. However, we have also shown that this is an insufficient way of measuring the mortality and HbA1c relationship over this complete range of HbA1c values. By analyzing the available observational studies using a non-linear fractional polynomial regression technique, we are able to identify the significant J-shaped relationship which previous statistical analyses were unable to detect.
The J-shaped trend conflicts with a recent observational study of a clinical trial conducted by Andersson et al. who found no association between low HbA1c and increased mortality in overweight and obese patients not experiencing weight loss [8]. This could be caused by the difference in population groups between this study and the adjusted variables used in other studies. The participants in Andersson et al. were overweight or obese, specifically recruited for a weight-loss trial assessing the association between HbA1c and body mass index (BMI). However, four out of our seven studies [31-33] included in our analysis have adjusted for BMI in their studies.
The results presented here are also stable and reliable because we excluded those observational studies from our analysis with an insufficient number of HbA1c categories (n = 26). We are unable to determine whether there could have been a J-shaped relationship in these studies when their statistical analysis was tested for a non-linear relationship. For example, Eeg-Olofsson et al. presented HRs in terms of per 1% increase of HbA1c, and they used three HbA1c categories, which led to a linear trend [21]. However, some of the reported figures (Figure 3E) presented in [21] showed a U-shaped relationship in our analysis when HbA1c was subdivided into deciles. Without complete knowledge of the dataset it is difficult to draw a conclusion. However, it may be worth re-analyzing these data to test for a statistically significant non-linear trend.
The J-shape found in our analysis is significant and has major implications for clinical trial design and clinical practice in the future. The predicted values obtained from the regression model apparently demonstrate a kind of 'security zone' of minimal effect on HR for HbA1c values approximately between 6% and 7.5% (42-58 mmol/mol). The regression model has observed higher HRs for all-cause mortality in HbA1c values below 6% (42 mmol/mol) and above 7.5% (58 mmol/mol).
It was not the aim of the analysis to identify such a 'security zone' or to influence directly clinical management parameters. Also, the results cannot define the optimal HbA1c range for T2D management, but they emphasize the need for more investigation surrounding this HbA1c range in further clinical trials and observational studies. Future clinical trials investigating the efficacy of diabetes management regimens should consider the consequences of lower HbA1c levels in different populations, as identified in this study, and cautiously assign targets accordingly.
5. Limitations
This meta-analysis has limitations regarding the systematic literature search which was limited to articles published in English language. Although we identified two non-relevant articles in non-English languages, we are unable to estimate the true representation of the worldwide published literature regarding the HbA1c/all-cause mortality relationship. We are confident that any publication selection bias would be minimal as we also identified a number of studies conducted in non-English speaking countries, which were published in English language.
The meta-analysis may also be limited because of data excluded from studies which reported only all-cause mortality HRs in less than five HbA1c categories. These studies may not have enough participants or events in the study to warrant so many categories. We cannot conclude that they would also have a non-linear relationship if more HbA1c categories were reported; they may in fact still report a linear relationship. Although it would be optimal, we did not have the resources to obtain all raw data from excluded studies to conduct non-linear tests and calculate adjusted HRs in synonymous HbA1c categories. However, our analysis highlights a distinct J-shaped relationship in all-cause mortality for studies that report HRs for more than four HbA1c categories.
We also need to mention that there may be other constraints caused by the inherent limitations of the studies included in the analysis. However, we are confident that the quality assessment scheme applied ensured that only studies of high-quality research were included.
6. Conclusion
This meta-analysis found a J-shaped relationship between HbA1c and all-cause mortality in T2D patients in observational studies when mortality rates and hazard ratios were measured in more than four HbA1c categories. The J-shaped relationship provides evidence that a 'security zone' exists for clinicians to target optimal HbA1c levels. To provide even stronger evidence for clinical practice, the existing data of HbA1c values between 5.5% (37 mmol/mol) and 9% (75 mmol/mol) should be re-analyzed in more detail, and new data should consider HRs to be calculated in more than four HbA1c categories.
Author contributions: Luke W. Arnold is the primary author and conducted the literature search, extraction of data from the literature, performed the analysis and interpretation of the data, and drafted the manuscript. Zhiqiang Wang is the secondary author and conducted the literature search, supervised the primary author throughout the entire manuscript construction, added intellectual suggestions, provided statistical expertise, and critically revised and edited the manuscript. Both authors are responsible for the concept and design of the study. Both authors also approved the final version of the manuscript.
Disclosures: The authors do not have any conflict of interests. There are no financial, institutional, corporate, or patent-licensing arrangements associated with this paper.
Appendix
Acknowledgments
This work was supported by the National Health and Medical Research Council (NHMRC) of Australia (APP1025300).
References
- 1.Zimmet P. The burden of type 2 diabetes: are we doing enough? Diabetes Metab. 2003;29(4 Part 2):6S9–6S18. doi: 10.1016/S1262-3636(03)72783-9. [DOI] [PMC free article] [PubMed] [Google Scholar]
- 2.Bagust A, Hopkinson PK, Maslove L, Currie CJ. The projected health care burden of Type 2 diabetes in the UK from 2000 to 2060. Diabetic Med. 2002;19(Suppl 4):1–5. doi: 10.1046/j.1464-5491.19.s4.2.x. [DOI] [PubMed] [Google Scholar]
- 3.Bennett CM, Guo M, Dharmage SC. HbA1c as a screening tool for detection of Type 2 diabetes: a systematic review. Diabetic Med. 2007;24(4):333–343. doi: 10.1111/j.1464-5491.2007.02106.x. [DOI] [PubMed] [Google Scholar]
- 4.Rowley KG, Daniel M, O'Dea K. Screening for diabetes in Indigenous populations using glycated haemoglobin: sensitivity, specificity, post-test likelihood and risk of disease. Diabetic Med. 2005;22(7):833–839. doi: 10.1111/j.1464-5491.2005.01447.x. [DOI] [PubMed] [Google Scholar]
- 5.World Health Organisation. Use of Glycated Haemoglobin (HbA1c) in the Diagnosis of Diabetes Mellitus. 2012. http://www.who.int/diabetes/publications/report-hba1c_2011.pdf.
- 6.UK Prospective Diabetes Study (UKPDS) Group. Effect of intensive blood-glucose control with metformin on complications in overweight patients with type 2 diabetes (UKPDS 34) The Lancet. 1998;352(9131):854–865. [PubMed] [Google Scholar]
- 7.Dormandy JA, Charbonnel B, Eckland DJ, Erdmann E, Massi-Benedetti M, Moules IK, Skene AM, Tan MH, Lefebvre PJ, Murray GD. et al. Secondary prevention of macrovascular events in patients with type 2 diabetes in the PROactive Study (PROspective pioglitAzone Clinical Trial In macroVascular Events): a randomised controlled trial. The Lancet. 2005;366(9493):1279–1289. doi: 10.1016/S0140-6736(05)67528-9. [DOI] [PubMed] [Google Scholar]
- 8.Andersson C, van Gaal L, Caterson ID, Weeke P, James WP, Coutinho W, Finer N, Sharma AM, Maggioni AP, Torp-Pedersen C. Relationship between HbA1c levels and risk of cardiovascular adverse outcomes and all-cause mortality in overweight and obese cardiovascular high-risk women and men with type 2 diabetes. Diabetologia. 2012;55(9):2348–2355. doi: 10.1007/s00125-012-2584-3. [DOI] [PubMed] [Google Scholar]
- 9.Patel A, MacMahon S, Chalmers J, Neal B, Billot L, Woodward M, Marre M, Cooper M, Glasziou P, Grobbee D. et al. Intensive blood glucose control and vascular outcomes in patients with type 2 diabetes. N Engl J Med. 2008;358(24):2560–2572. doi: 10.1056/NEJMoa0802987. [DOI] [PubMed] [Google Scholar]
- 10.Abraira C, Colwell JA, Nuttall FQ, Sawin CT, Nagel NJ, Comstock JP, Emanuele NV, Levin SR, Henderson W, Lee HS. Veterans Affairs Cooperative Study on glycemic control and complications in type II diabetes (VA CSDM): results of the feasibility trial. Diabetes Care. 1995;18(8):1113–1123. doi: 10.2337/diacare.18.8.1113. [DOI] [PubMed] [Google Scholar]
- 11.Turner RC. Intensive blood-glucose control with sulphonylureas or insulin compared with conventional treatment and risk of complications in patients with type 2 diabetes (UKPDS 33) Lancet. 1998;352(9131):837. [PubMed] [Google Scholar]
- 12.Gerstein HC, Miller ME, Byington RP, Goff DC, Bigger JT, Buse JB, Cushman WC, Genuth S, Ismail-Beigi F, Grimm RH. et al. Effects of intensive glucose lowering in type 2 diabetes. N Engl J Med. 2008;358(24):2545–2559. doi: 10.1056/NEJMoa0802743. [DOI] [PMC free article] [PubMed] [Google Scholar]
- 13.Boussageon R, Bejan-Angoulvant T, Saadatian-Elahi M, Lafont S, Bergeonneau C, Kassai B, Erpeldinger S, Wright JM, Gueyffier F, Cornu C. Effect of intensive glucose lowering treatment on all cause mortality, cardiovascular death, and microvascular events in type 2 diabetes: meta-analysis of randomised controlled trials. BMJ. 2011;343:d4169. doi: 10.1136/bmj.d4169. [DOI] [PMC free article] [PubMed] [Google Scholar]
- 14.Hemmingsen B, Lund SS, Gluud C, Vaag A, Almdal T, Hemmingsen C, Wetterslev J. Intensive glycaemic control for patients with type 2 diabetes: systematic review with meta-analysis and trial sequential analysis of randomised clinical trials. BMJ. 2011;343:d6898. doi: 10.1136/bmj.d6898. [DOI] [PMC free article] [PubMed] [Google Scholar]
- 15.Ma J, Yang W, Fang N, Zhu W, Wei M. The association between intensive glycemic control and vascular complications in type 2 diabetes mellitus: a meta-analysis. Nutr Metab Cardiovas. 2009;19(9):596–603. doi: 10.1016/j.numecd.2009.07.004. [DOI] [PubMed] [Google Scholar]
- 16.Mannucci E, Monami M, Lamanna C, Gori F, Marchionni N. Prevention of cardiovascular disease through glycemic control in type 2 diabetes: A meta-analysis of randomized clinical trials. Nutr Metab Cardiovas. 2009;19(9):604–612. doi: 10.1016/j.numecd.2009.03.021. [DOI] [PubMed] [Google Scholar]
- 17.Ray KK, Seshasai SR, Wijesuriya S, Sivakumaran R, Nethercott S, Preiss D, Erqou S, Sattar N. Effect of intensive control of glucose on cardiovascular outcomes and death in patients with diabetes mellitus: a meta-analysis of randomised controlled trials. The Lancet. 2009;373(9677):1765–1772. doi: 10.1016/S0140-6736(09)60697-8. [DOI] [PubMed] [Google Scholar]
- 18.Turnbull FM, Abraira C, Anderson RJ, Byington RP, Chalmers JP, Duckworth WC, Evans GW, Gerstein HC, Holman RR, Moritz TE. et al. Intensive glucose control and macrovascular outcomes in type 2 diabetes. Diabetologia. 2009;52(11):2288–2298. doi: 10.1007/s00125-009-1470-0. [DOI] [PubMed] [Google Scholar]
- 19.Zhang CY, Sun AJ, Zhang SN, Wu CN, Fu MQ, Xia G, Wang KQ, Zou YZ, Ge JB. Effects of intensive glucose control on incidence of cardiovascular events in patients with type 2 diabetes: A meta-analysis. Ann Med. 2010;42(4):305–315. doi: 10.3109/07853891003796752. [DOI] [PubMed] [Google Scholar]
- 20.Bruno G, Merletti F, Biggeri A, Bargero G, Ferrero S, Pagano G, Cavallo-Perin P. Fibrinogen and AER are major independent predictors of 11-year cardiovascular mortality in type 2 diabetes: the Casale Monferrato Study. Diabetologia. 2005;48(3):427–434. doi: 10.1007/s00125-004-1667-1. [DOI] [PubMed] [Google Scholar]
- 21.Eeg-Olofsson K, Cederholm J, Nilsson PM, Zethelius B, Svensson AM, Gudbjörnsdottir S, Eliasson B. New aspects of HbA1c as a risk factor for cardiovascular diseases in type 2 diabetes: an observational study from the Swedish National Diabetes Register (NDR) J Intern Med. 2010;268(5):471–482. doi: 10.1111/j.1365-2796.2010.02265.x. [DOI] [PubMed] [Google Scholar]
- 22.Kerr D, Partridge H, Knott J, Thomas PW. HbA1c 3 months after diagnosis predicts premature mortality in patients with new onset type 2 diabetes. Diabetic Med. 2011;28(12):1520–1524. doi: 10.1111/j.1464-5491.2011.03443.x. [DOI] [PubMed] [Google Scholar]
- 23.Khaw KT, Wareham N, Luben R, Bingham S, Oakes S, Welch A, Day N. Glycated haemoglobin, diabetes, and mortality in men in Norfolk cohort of European Prospective Investigation of Cancer and Nutrition (EPIC-Norfolk) BMJ. 2001;322(7277):15. doi: 10.1136/bmj.322.7277.15. [DOI] [PMC free article] [PubMed] [Google Scholar]
- 24.Levitan EB, Liu S, Stampfer MJ, Cook NR, Rexrode KM, Ridker PM, Buring JE, Manson JE. HbA1c measured in stored erythrocytes and mortality rate among middle-aged and older women. Diabetologia. 2008;51(2):267–275. doi: 10.1007/s00125-007-0882-y. [DOI] [PMC free article] [PubMed] [Google Scholar]
- 25.Moss S, Klein R, Klein BK, Meuer SM. The association of glycemia and cause-specific mortality in a diabetic population. Arch Intern Med. 1994;154(21):2473–2479. [PubMed] [Google Scholar]
- 26.Stratton IM, Adler AI, Neil HA, Matthews DR, Manley SE, Cull CA, Hadden D, Turner RC, Holman RR. Association of glycaemia with macrovascular and microvascular complications of type 2 diabetes (UKPDS 35): prospective observational study. BMJ. 2000;321(7258):405–412. doi: 10.1136/bmj.321.7258.405. [DOI] [PMC free article] [PubMed] [Google Scholar]
- 27.Yoo DE, Park JT, Oh HJ, Kim SJ, Lee MJ, Shin DH, Han SH, Yoo TH, Choi KH, Kang SW. Good glycemic control is associated with better survival in diabetic patients on peritoneal dialysis: a prospective observational study. Plos One. 2012;7(1):e30072. doi: 10.1371/journal.pone.0030072. [DOI] [PMC free article] [PubMed] [Google Scholar]
- 28.Lehto S, Ronnemaa T, Haffner SM, Pyorala K, Kallio V, Laakso M. Dyslipidemia and hyperglycemia predict coronary heart disease events in middle-aged patients with NIDDM. Diabetes. 1997;46(8):1354–1359. doi: 10.2337/diab.46.8.1354. [DOI] [PubMed] [Google Scholar]
- 29.Lehto S, Ronnemaa T, Pyorala K, Laakso M. Risk factors predicting lower extremity amputations in patients with NIDDM. Diabetes Care. 1996;19(6):607–612. doi: 10.2337/diacare.19.6.607. [DOI] [PubMed] [Google Scholar]
- 30.Aguilar D, Bozkurt B, Ramasubbu K, Deswal A. Relationship of Hemoglobin A1C and Mortality in Heart Failure Patients With Diabetes. J Am Coll Cardiol. 2009;54(5):422–428. doi: 10.1016/j.jacc.2009.04.049. [DOI] [PMC free article] [PubMed] [Google Scholar]
- 31.Currie CJ, Peters JR, Tynan A, Evans M, Heine RJ, Bracco OL, Zagar T, Poole CD. Survival as a function of HbA1c in people with type 2 diabetes: a retrospective cohort study. The Lancet. 2010;375(9713):481–489. doi: 10.1016/S0140-6736(09)61969-3. [DOI] [PubMed] [Google Scholar]
- 32.Huang ES, Liu JY, Moffet HH, John PM, Karter AJ. Glycemic control, complications, and death in older diabetic patients: The Diabetes and Aging Study. Diabetes Care. 2011;34(6):1329–1336. doi: 10.2337/dc10-2377. [DOI] [PMC free article] [PubMed] [Google Scholar]
- 33.Landman GW, van Hateren KJ, Kleefstra N, Groenier KH, Gans RO, Bilo HJ. The relationship between glycaemic control and mortality in patients with type 2 diabetes in general practice (ZODIAC-11) British J Gen Pract. 2010;60(572):172–175. doi: 10.3399/bjgp10X483517. [DOI] [PMC free article] [PubMed] [Google Scholar]
- 34.Skriver MV, Stovring H, Kristensen JK, Charles M, Sandbaek A. Short-term impact of HbA1c on morbidity and all-cause mortality in people with type 2 diabetes: a Danish population-based observational study. Diabetologia. 2012;55(9):2361–2370. doi: 10.1007/s00125-012-2614-1. [DOI] [PubMed] [Google Scholar]
- 35.Rutter MK. Low HbA1c and mortality: causation and confounding. Diabetologia. 2012;55(9):2307–2311. doi: 10.1007/s00125-012-2620-3. [DOI] [PubMed] [Google Scholar]
- 36.Zhang Y, Hu G, Yuan Z, Chen L. Glycosylated hemoglobin in relationship to cardiovascular outcomes and death in patients with type 2 diabetes: a systematic review and meta-analysis. Plos One. 2012;7(8):e42551. doi: 10.1371/journal.pone.0042551. [DOI] [PMC free article] [PubMed] [Google Scholar]
- 37.Selvin E, Marinopoulos S, Berkenblit G, Rami T, Brancati FL, Powe NR, Gold SH. Meta-analysis: glycosylated hemoglobin and cardiovascular disease in diabetes mellitus. Ann Intern Med. 2004;141(6):421–481. doi: 10.7326/0003-4819-141-6-200409210-00007. [DOI] [PubMed] [Google Scholar]
- 38.Moher D, Liberati A, Tetzlaff J, Altman DG. Preferred reporting items for systematic reviews and meta-analyses: the PRISMA statement. Ann Intern Med. 2009;151(4):264–269. doi: 10.7326/0003-4819-151-4-200908180-00135. [DOI] [PubMed] [Google Scholar]
- 39.Stroup DF, Berlin JA, Morton SC, Olkin I, Williamson GD, Rennie D, Moher D, Becker BJ, Sipe TA, Thacker SB. Meta-analysis of observational studies in epidemiology: A proposal for reporting. Meta-analysis Of Observational Studies in Epidemiology (MOOSE) group. JAMA. 2000;283(15):2008–2012. doi: 10.1001/jama.283.15.2008. [DOI] [PubMed] [Google Scholar]
- 40.Gerstein HC, Swedberg K, Carlsson J, McMurray JJ, Michelson EL, Olofsson B, Pfeffer MA, Yusuf S CHARM Program Investigators. The hemoglobin a1c level as a progressive risk factor for cardiovascular death, hospitalization for heart failure, or death in patients with chronic heart failure: An analysis of the candesartan in heart failure: assessment of reduction in mortality and morbidity (CHARM) program. Arch Intern Med. 2008;168(15):1699–1704. doi: 10.1001/archinte.168.15.1699. [DOI] [PubMed] [Google Scholar]
- 41.Berman N, Parker R. Meta-analysis: Neither quick nor easy. BMC Med Res Methodol. 2002;2(1):10. doi: 10.1186/1471-2288-2-10. [DOI] [PMC free article] [PubMed] [Google Scholar]
- 42.Phung DT, Wang Z, Rutherford S, Huang C, Chu C. Body mass index and risk of pneumonia: a systematic review and meta-analysis. Obes Rev. 2013;14(10):839–857. doi: 10.1111/obr.12055. [DOI] [PubMed] [Google Scholar]
- 43.StataCorp. Stata statistical software: release 12. StataCorp LP: College Station; Texas: 2011. [Google Scholar]
- 44.Berlin JA, Longnecker MP, Greenland S. Meta-analysis of Epidemiologic Dose-Response Data. Epidemiology. 1993;4(3):218–228. doi: 10.1097/00001648-199305000-00005. [DOI] [PubMed] [Google Scholar]
- 45.Il'yasova D, Hertz-Picciotto I, Peters U, Berlin JA, Poole C. Choice of exposure scores for categorical regression in meta-analysis: a case study of a common problem. Cancer Causes Control. 2005;16(4):383–388. doi: 10.1007/s10552-004-5025-x. [DOI] [PubMed] [Google Scholar]
- 46.Higgins JP, Thompson SG, Deeks JJ, Altman DG. Measuring inconsistency in meta-analyses. BMJ. 2003;327(7414):557–560. doi: 10.1136/bmj.327.7414.557. [DOI] [PMC free article] [PubMed] [Google Scholar]
- 47.Drechsler C, Krane V, Ritz E, Marz W, Wanner C. Glycemic control and cardiovascular events in diabetic hemodialysis patients. Circulation. 2009;120(24):2421–2428. doi: 10.1161/CIRCULATIONAHA.109.857268. [DOI] [PubMed] [Google Scholar]
- 48.Xu L, Chan WM, Hui YF, Lam TH. Association between HbA1c and cardiovascular disease mortality in older Hong Kong Chinese with diabetes. Diabetic Med. 2012;29(3):393–398. doi: 10.1111/j.1464-5491.2011.03456.x. [DOI] [PubMed] [Google Scholar]
- 49.Kim HY, Yun WJ, Shin MH, Kweon SS, Ahn HR, Choi SW, Lee YH, Cho DH, Rhee JA. Management of diabetic mellitus in low-income rural patients. J Prev Med Pub Health. 2009;42(5):315–322. doi: 10.3961/jpmph.2009.42.5.315. [DOI] [PubMed] [Google Scholar]
- 50.Bramlage P, Schindler C, Thoenes M, Bramlage CP, Bocking W, Kirch W. Prevention of cardiovascular disease by blocking the endocannabinoid system. Herz. 2007;32(7):560–567. doi: 10.1007/s00059-007-3021-0. [DOI] [PubMed] [Google Scholar]