Abstract
Objective
To compare the sensitivity and specificity of ocular vestibular evoked myogenic potentials (oVEMP) using two electrode montages for the diagnosis of superior canal dehiscence syndrome (SCDS).
Subjects
16 SCDS patients (17 affected-SCDS ears, 15 contralateral-SCDS ears) and 12 controls (24 ears).
Methods
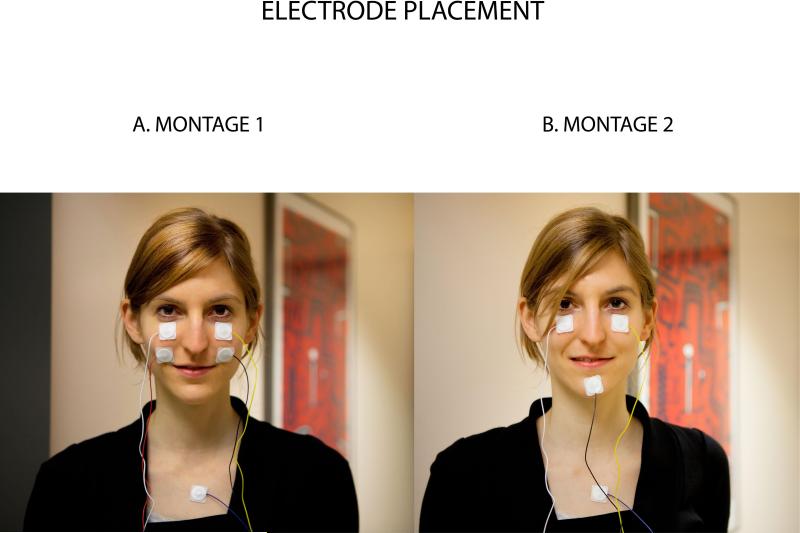
OVEMPs were recorded in response to 500 Hz tone bursts using 2 electrode montages. For both montages the active electrode was placed approximately 5 mm below each eye and a ground electrode on the sternum. For montage 1(standard) the reference electrode was centered 2 cm below each active electrode. For montage 2 the reference electrode was placed on the chin.
Results
For either montage, the separation between oVEMP amplitudes in affected-SCDS ears and controls was significant (p<0.001), with excellent sensitivity and specificity (>90%).
Conclusion
oVEMP recordings with the standard montage remain a reliable method for evaluation of SCDS.
Keywords: vestibular, VEMP, otolith, superior canal dehiscence syndrome, oVEMP
Introduction
In superior canal dehiscence syndrome (SCDS), there is an abnormal opening in the bone over the superior semicircular canal [Minor et al., 1998]. This opening creates a third window into the inner ear, which may produce both vestibular and auditory signs and symptoms. Vestibular presentation may include vertigo and oscillopsia in response to sound and/or pressure changes (Tullio and/or Hennebert signs, respectively) and chronic disequilibrium. The auditory presentation may include autophony, bone-conductive hyperacusis and pulsatile tinnitus. Some patients may have a combination of both vestibular and auditory symptoms. The work-up for SCDS includes physical examination, audiometric testing [Chien et al., 2007; Minor et al., 1998; Rosowski et al., 2004], imaging by means of high-resolution computed tomography (CT)[Belden et al., 2003], and vestibular evoked myogenic potential (VEMP) testing [Brantberg, Bergenius & Tribukait, 1999].
The VEMP is a measure of electromyographic activity modulated by stimulating vestibular afferents with an acoustic stimulus. For the cervical VEMP (cVEMP), the response is a relaxation potential measured over the contracted ipsilateral sternocleidomastoid muscle. It is believed to originate from the saccule in response to air-conducted stimuli (ACS) [Colebatch, Halmagyi & Skuse, 1994]. For the ocular VEMP (oVEMP), the response is an excitatory potential measured from the contralateral inferior oblique muscle [Rosengren et al., March, 2011]. Current evidence suggests that oVEMPs in response to midline forehead taps provide an assessment of the utricle [Iwasaki et al., 2007; Manzari et al., 2010; Yang, Liu & Young, 2010]. However, there is controversy about the origin of the oVEMP in response to ACS. Some investigations describe a primary utricular origin [Curthoys, 2010; Curthoys & Manzari, 2011; Manzari, Burgess & Curthoys, 2010], while others argue that the response may include a small contribution from the saccule, thus originating from both utricle and saccule [Papathanasiou, 2011; Welgampola & Carey, 2010].
In patients with SCDS these VEMP responses are enhanced; the response amplitudes are larger and thresholds are reduced. The proposed hypothesis explaining these enhanced vestibular responses is that the labyrinth has reduced input impedance in the presence of a third mobile window [Rosowski et al., 2004]. Therefore, this VEMP enhancement is observed in both cervical and ocular VEMP.
Brantberg et al. [1999] were the first to demonstrate that cVEMP thresholds were reduced in SCDS and almost a decade later, the use of oVEMP testing was suggested for the diagnosis of SCDS [Rosengren et al., 2008]. More recent work has described that oVEMP recordings are more reliable than cVEMP recordings to separate SCDS patients from controls [Janky et al., 2013; Manzari et al., 2012; Welgampola et al., 2008; Zuniga et al., 2013]. Two studies on oVEMP measurements in surgically confirmed SCDS demonstrated that this test has excellent sensitivity and specificity [Janky et al., 2013; Zuniga et al., 2013]. Hence, it is reasonable to anticipate wider use of oVEMP testing for future diagnosis of SCDS.
Recently, Piker et al [2011] studied oVEMP responses in 10 healthy volunteers and found that the traditional standard electrode placement for the oVEMP recording (“montage-1”, Figure 1A) could reduce the response amplitude. They suggest that some of the oVEMP activity might be detected by the reference electrode, and therefore subtracted from the signal averaged response measured at the active electrode. In other words, they suggest that “montage-1” contaminates the oVEMP recording and they propose an alternative to reduce this contamination by placing the reference electrode further from the active electrode (“montage-2”, Figure 1B). In their cohort, they observed that using “montage 2” increased the oVEMP response between 18% - 43% [Piker et al., 2011].
Figure 1.
A. Montage-1: standard electrode placement. B. Montage-2: using a single reference electrode on the chin
The purpose of this study was two-fold: first, to compare the sensitivity and specificity of oVEMP recordings using two electrode montages: montage-1 and montage-2 in patients with SCDS confirmed by high-resolution CT; and second, to investigate the percent change in oVEMP amplitude between these two electrode montages.
Methods
Subjects
Sixteen patients (mean age 49, range 24-76) with a diagnosis of SCDS and twelve age-matched healthy volunteers (mean age 48, range 24-76) with no prior history of neuro-otological complaints were enrolled in this study. The diagnosis of SCDS was based on a combination of at least two auditory or vestibular symptoms, at least one auditory or vestibular clinical sign (supported by audiometry and/or clinical exam) and high-resolution CT imaging (Table 1). Auditory and vestibular symptoms included autophony, pulsatile tinnitus, chronic disequilibrium, oscillopsia, or sound- and pressure-induced vertigo (Tullio phenomenon and Hennebert sign). Vestibular clinical signs included nystagmus in the plane of the affected superior canal induced by tones with an audiometer (Tullio phenomenon), Valsalva maneuvers, or external auditory canal pressure (Hennebert sign). Audiometric clinical signs included the presence of conductive hyperacusis in the low frequencies (250 Hz – 500 Hz) using extended bone-conduction audiometry. High-resolution CT imaging demonstrating apparent dehiscence of the superior semicircular canal was a mandatory radiographic sign for diagnosis in all cases [Belden et al., 2003; Hirvonen et al., 2003]. In 10 of 17 cases, patients chose to have surgical repair of their dehiscence, providing direct evidence of a symptomatic dehiscence in these cases. Of note, one SCDS patient had previously undergone surgery for the repair of perilymphatic fistula in the same ear with the diagnosis of SCDS; another SCDS patient experienced symptoms bilaterally (both ears are included in the affected-SCDS group) and six patients had already undergone SCD surgical repair on the contralateral ear. Analyses and results are based on three ear groups: both ears of controls (n = 24), ears affected with SCDS (affected-SCDS; n = 17) and asymptomatic ears contralateral to SCDS (contralateral-SCDS; n = 15). Note that for the contralateral-SCDS ear group, we provided no distinction between the purely asymptomatic and the repaired ears because it has been described that surgical repair of ears with SCDS results in normalization of VEMP responses [Welgampola et al., 2008].
Table 1.
Signs and symptoms in SCDS patient cohort, symptomatic ears
| Patient | Case No. | 1 | 2 | 3 | 4 | 5¥ | 6 | 7 | 8 | 9 | 10 | 11 | 12 | 13 | 14 | 15 | 16 | 17 | Symptoms and Signs Prevalence (%) |
| Age | 41 | 44 | 66 | 53 | 53 | 39 | 43 | 49 | 41 | 51 | 61 | 24 | 53 | 74 | 57 | 54 | 64 | ||
| SCDS side | L | R | R | L | R | L | R | L | L | R | R | L | L | L | L | R | R | ||
| Symptoms | Autophony | x | x | x | x | x | x | x | x | x | x | x | x | x | x | x | 87 | ||
| Pulsatile tinnitus | x | x | x | x | x | x | x | x | x | x | x | x | x | x | x | 80 | |||
| Chronic disequilibrium | x | x | x | x | x | x | x | x | 53 | ||||||||||
| Perceive internal body sounds | x | x | x | x | x | x | x | x | x | x | x | 73 | |||||||
| Oscillopsia | x | x | x | x | x | 33 | |||||||||||||
| Sound induced vertigo | x | x | x | x | x | x | x | x | x | x | x | x | 67 | ||||||
| Signs | Eye movements induced by Sound | x | x | x | x | x | x | x | x | x | x | 53 | |||||||
| Valsalva | x | x | x | x | 27 | ||||||||||||||
| EAC pressure | x | x | x | x | 27 | ||||||||||||||
| Conductive hyperacusis - ABG | x | x | x | x | x | x | x | x | x | x | x | x | x | x | x | x | 93 | ||
One patient had bilateral dehiscence. Left ear side is shown as #4 and right ear as #5.
ABG - air bone gap; EAC – external auditory canal
OVEMP recordings
Calibrated TDH-49 headphones were used to deliver 500 Hz, 125 dB SPL tonebursts of positive polarity, with a linear envelope (1 ms rise/fall time, 2 ms plateau), at a repetition rate of 5 pulses per second. A total of 100 responses were averaged. EMG signals were amplified (2500 μV) and band-pass filtered (3 Hz – 500 Hz). Of note, 500 Hz tonebursts have been used in previous oVEMP testing investigations where an excellent segregation between controls and patients with SCDS was observed [Janky et al., 2013; Welgampola et al., 2008; Zuniga et al., 2013].
OVEMP signals were recorded using 2 different electrode montages simultaneously. Montage 1 (standard) consisted of an active electrode placed approximately 5 mm below each eye, a reference electrode centered 2 cm below each active electrode and a ground electrode over the sternum (Figure 1.A). Montage 2 consisted of an active electrode placed approximately 3 mm below each eye, a single reference electrode placed on the chin and a ground electrode over the sternum (Figure 1.B).
Participants lay semi-recumbent with their upper bodies elevated at a 30 degree angle from horizontal. Twenty-degree (+ and −) vertical saccades from the line of primary gaze orientation were performed to ensure that symmetrical signals were obtained from both eyes before recording oVEMP results, and if the signal change showed > 25% asymmetry the electrodes were replaced. When saccades could not be recorded then the oVEMP test was considered “non-recordable”, was marked as a missing value. During oVEMP testing, participants were instructed to fix their gaze on a line on the ceiling that was located 30-degrees up from their primary gaze orientation. For either montage, the n1 potential was identified as the first distinctive negative peak in the waveform occurring 7-11 ms after stimulus onset, and the p1 potential was identified as the first distinctive positive peak in the waveform occurring 12-16 ms after stimulus onset. The n1 amplitude was calculated as the amplitude from baseline to the peak of the n1 response, and the peak-to-peak amplitude was calculated as the sum of the n1 and p1 amplitudes. Absent responses (no VEMP waveform despite proper eye movement recording with calibration) were considered as 0 microvolts in amplitude. All patients gave informed consent for testing through a protocol approved by the Institutional Review Board at the Johns Hopkins University School of Medicine (protocol number NA 00035749).
Statistical analyses
Differences in oVEMP amplitudes between ear groups were analyzed using Kruskal-Wallis test for each montage, followed by the Mann-Whitney U post hoc tests for multiple comparisons, with a Bonferroni adjustment for the P value. Receiver Operating Characteristic (ROC) Curves were analyzed for each montage using as outcome parameters both the n10 and peak-to-peak amplitudes of controls and affected-SCDS ears, where an area of 1 represents a perfect test and an area of 0.5 represents a worthless test. The difference in oVEMP amplitude obtained with each montage was calculated as a change expressed in percentage: [(Amplitude Montage 2 – Amplitude Montage 1)/ Amplitude Montage 1]. Differences in amplitudes between montages were analyzed for each ear group using Wilcoxin Signed Rank Test. Results were considered significant at the P < 0.05 level, except for those tests with an applied Bonferroni adjustment (P ≤ 0.017). Microsoft Excel 2007 (Seattle, WA, USA) and IBM SPSS 21 (Chicago, IL, USA) were used for statistical analyses.
Results
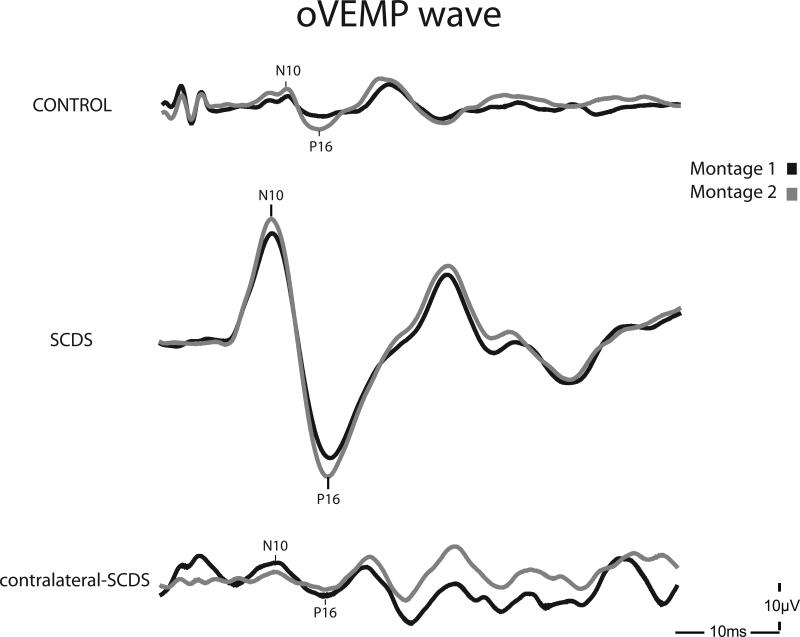
OVEMP responses were present in all control and SCDS ears using montage-1 (standard). Using montage-2, oVEMPs could not be recorded in two contralateral-SCDS ears and one control ear. Interestingly, these 2 contralateral-SCDS ears had facial hair. Due to these absent responses, the difference in oVEMP amplitudes between montages could not be calculated. Figure 2 depicts sample waveforms from the three different ear groups using montage-1 and montage-2.
Figure 2.
Sample oVEMP waveforms obtained using montage 1 (black) and montage 2 (grey) in the three ear categories – control, contralateral-SCDS and SCDS. The contralateral-SCDS example corresponds to the contralateral ear of the displayed SCDS ear.
Montage-1 vs Montage-2: Sensitivity and Specificity
oVEMP n1 amplitudes
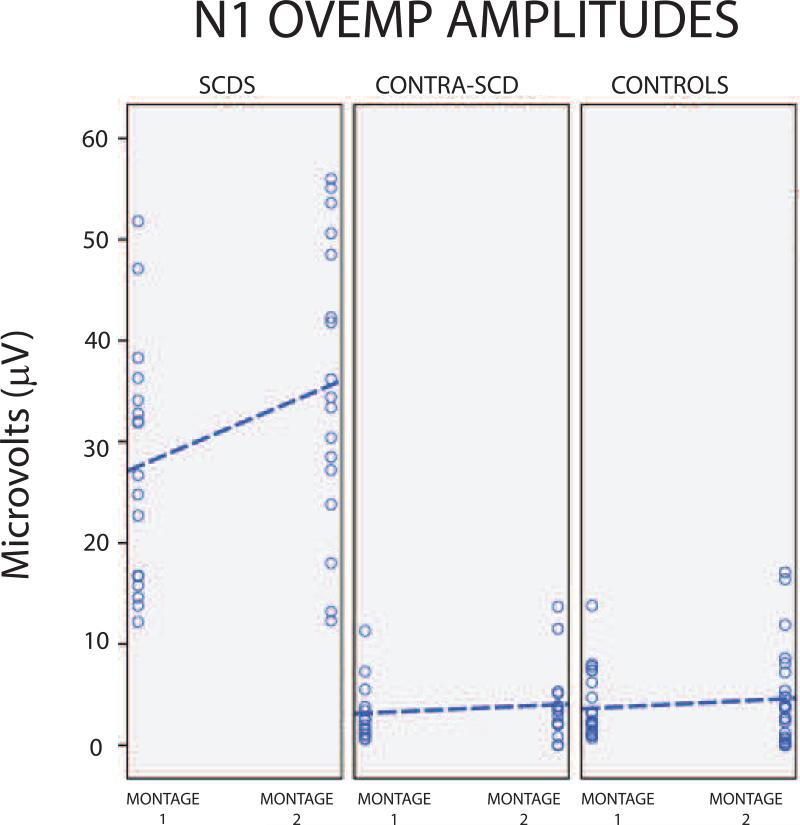
OVEMP recordings with montage-1 (standard) elicited significantly different n1 amplitudes across the three ear groups (H(2) = 34.7, p <0.001). Post hoc analysis indicated that oVEMP n1 amplitudes were significantly higher in affected-SCDS ears (median = 26.8 μV) compared to control (median= 2.3 μV; U = 301.5, p <0.001) and to contralateral-SCDS ears (median= 2.5 μV; U= 120, p <0.001; Figure 3). There was no significant difference in n1 amplitudes between controls and contralateral-SCDS (U= 286, p=0.686). ROC analysis revealed that the area under the curve (standard error) was 0.996 (0.005). For this oVEMP recording a cut-off value ≥ 13.1 μV showed excellent sensitivity (94%) and excellent specificity (95%).
Figure 3.
N10 oVEMP amplitudes. A. Montage-1; B. Montage-2.
Similarly, oVEMP recordings with montage-2 elicited significantly different n1 amplitudes across the three ear groups (H(2)=32.3, p <0.001). Post hoc analysis indicated significantly higher n1 amplitudes in affected-SCDS ears (median= 34.4 μV) compared to both control (median= 3.85 μV; U= 257, p <0.001) and to contralateral-SCDS ears (median= 3.5 μV; U= 93, p <0.001; Figure 3). Again, there was no significant difference in n1 amplitudes between controls and contralateral-SCDS (U= 233, p = 0.720). ROC analysis revealed that the area under the curve (standard error) was 0.990 (0.010). Thus, oVEMP recordings using montage-2 also provided excellent sensitivity (94%) and specificity (92%) using a cut-off value ≥ 12.75 μV.
oVEMP peak-to-peak amplitudes
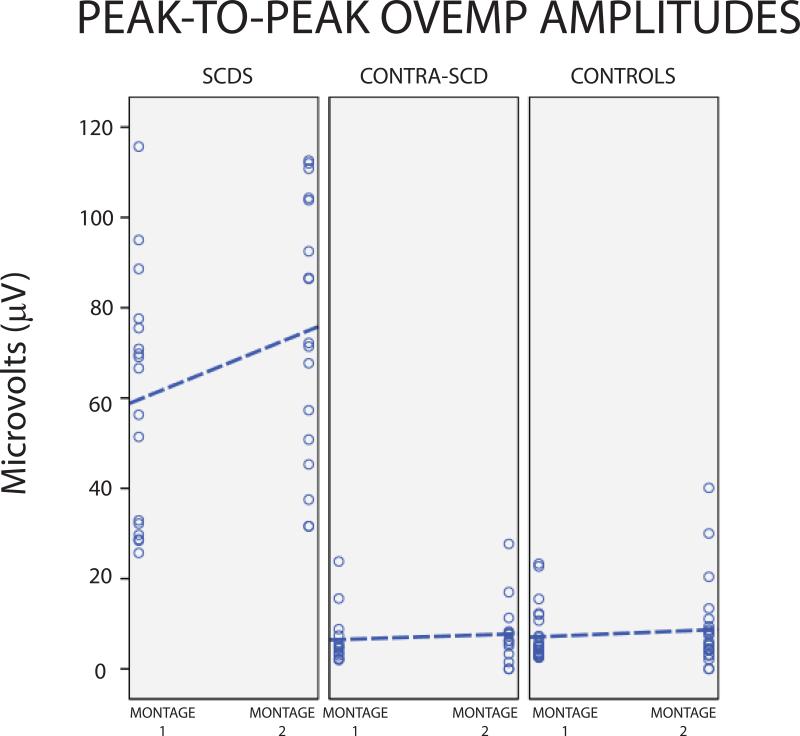
For montage-1 (standard), peak-to-peak amplitudes were significantly different between affected-SCDS, control and contralateral-SCDS ears (H(2)=34.9, p <0.001). Peak-to-peak amplitudes were significantly higher in the affected-SCDS ears (median= 66.6 μV) relative to control (median= 4.55 μV; U= 300, p < 0.001) and contralateral-SCDS ears (median= 4.8 μV; U= 120, p < 0.001). There was no significant difference between control and contralateral-SCDS (U= 293, p = 0.840; Figure 4). ROC analysis for montage-1 and oVEMP peak-to-peak amplitude showed an area under the curve (standard error) of 1.0 (<0.001). Thus, using a cut-off value of 24.5 μV or greater revealed excellent sensitivity (>99%) and specificity (>99%).
Figure 4.
Peak-to-peak oVEMP amplitudes. A. Montage-1; B. Montage-2.
Peak-to-peak amplitudes recorded with montage 2 revealed significant differences between the three ear groups (H(2)=33.12, p <0.001). Peak-to-peak amplitudes were significantly higher in affected-SCDS (median= 72.2 μV) than those of control (median= 5.8 μV; U=256, p <0.001) and contralateral-SCDS ears (median= 7.7 μV U= 91, p <0.001). There was no significant difference between controls and contralateral-SCDS (U= 380.5, p= 0.597; Figure 4). ROC analysis for montage-2 and peak-to-peak amplitude showed an area under the curve of 1.0 (standard error <0.001), thus showed excellent sensitivity (>99%) and specificity (95%) with a cut-off value of ≥ 30.8 μV.
Montage 1 vs montage 2: Differences in oVEMP amplitude
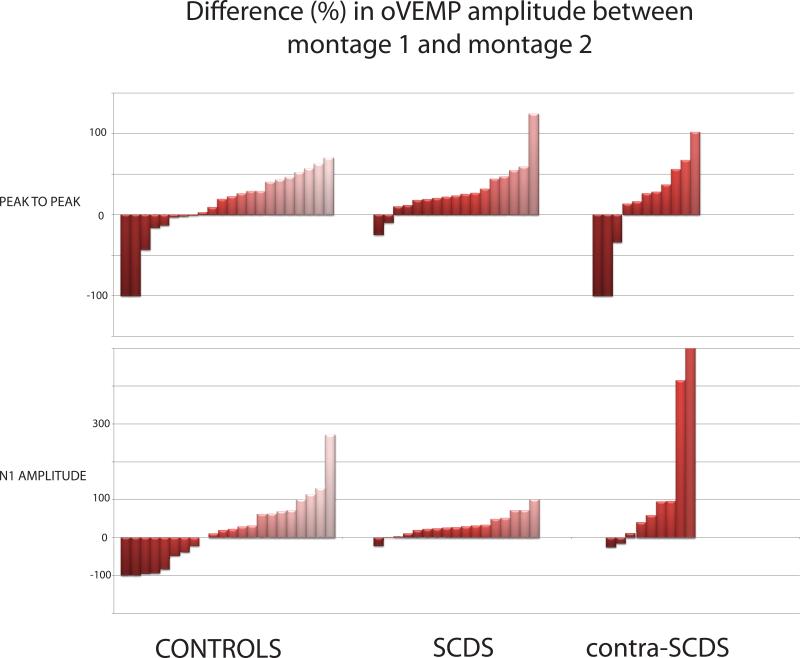
In general, oVEMP n1 and peak-to-peak amplitudes with montage 2 were larger than those using montage-1 (Figure 5).Both n1 (Z = -3.385, p = 0.001) and peak-to-peak amplitudes (Z = -3.29, p = 0.001) in the affected-SCDS ears and peak-to-peak amplitudes (Z = -2.529, p = 0.011) in the control group were significantly larger using montage 2.
Figure 5.
Percent difference in oVEMP amplitude between montage-1 and montage-2
From montage-1 (standard) to montage-2 (Figures 3-5), the median increase of oVEMP n1 amplitudes was 25% in control-ears (range -100% to 380%; negative numbers represent a decrease in amplitude using montage-2), 27% in affected-SCDS ears (range -21% to 100%), and 18% in contralateral-SCDS ears (range -100% to 863%). Similarly, the median increase of oVEMP peak-to-peak amplitudes was 24% in control-ears (range -100% to 122%), 23% in affected-SCDS ears (range -25% to 124%), and 26% in contralateral-SCDS ears (range -100% to 180%). Furthermore, the change in oVEMP n1 or peak-to-peak amplitudes using montage-1 vs montage-2 was not correlated with age across subjects (r = -0.076, p > 0.578) or with air-bone gaps - neither for low-frequency (r = -0.208, p > 0.253)nor for largest air-bone gap in affected-SCDS ears (r = -0.081, p > 0.659; data not shown).
Discussion
The investigation conducted by Piker et al [2011] suggests that oVEMP amplitudes recorded with montage-1 (standard) are contaminated by the close proximity of the reference electrode resulting in an approximate 30% amplitude reduction (range18%-43%). By placing the reference electrode further away from the active electrode (i.e., on the chin) the reference electrode was expected to capture minimal or no activity from the inferior oblique muscle, thus resulting in enhanced oVEMP amplitudes [Piker et al., 2011]. This opened up the question of whether oVEMP signals using montage-2 in patients with SCDS could result in even higher oVEMP amplitudes (e.g., >30% higher), making the segregation between controls and SCDS patients even clearer. In addition, SCDS is a vestibular entity with particular (high amplitude) oVEMP responses that serves as a good model to study and support a vestibular origin for oVEMPs recorded with montage-2.
Overall, results from the present investigation are in agreement with the findings of Piker and colleagues [2011], in that oVEMP amplitudes showed a median increase of 18%-26% between groups by adopting this innovative electrode placement (montage-2). This trend is similar to the 30% mean increase described by Piker et al. [2011]. We demonstrated a statistically significant increase in oVEMP amplitudes from montage 1 to montage 2 for affected-SCDS ears (both n1 and peak-to-peak amplitude) and control ears (peak-to-peak amplitude). However, a large degree of variability was observed in our cohort (-100% to 863%) with some ears (n = 13; normal controls: n = 8, affected-SCDS: n = 2; contralateral-SCDS n = 3) demonstrating a decrease from montage 1 to montage 2 compared to the Piker et al [2011] cohort where all subjects demonstrated an increase in oVEMP amplitude (range 18% to 43%). This greater variability was more evident in ears that tended to have regular-smaller size oVEMP waveforms (controls and contralateral-SCDS). Three subjects had no response to montage 2, yielding a -100% difference between montages. In 2 contralateral-SCDS ears, this absent response may be attributed to facial hair, which would preclude the reference electrode from detecting and cancelling out common noise. We speculate that neighboring EMG activity may play a role in montage 2. While oVEMP recordings with montage-2 have the advantage of a “less subtracting effect” by the reference electrode being further away from the inferior oblique muscle, this “extra” separation also renders more susceptibility to neighboring EMG activity, such as activity coming from oral orbicularis, masseter muscles or other facial muscles. Our primarily enhanced responses with montage 2 suggest this montage provides better noise cancellation; however, the large variability raises speculation about the contribution of surrounding muscles. Because vestibular-related muscle potential changes can occur in a variety of muscles throughout the body, it is difficult to determine whether tension or relaxation of these surrounding muscles potentially results in a noisier and/or altered recording in addition to better noise cancellation. Interfering activity from these surrounding muscles might explain the absent oVEMP responses with montage-2, despite having good calibration and present oVEMP responses using montage-1 and might also explain our increased variability compared to those of Piker et al [2011]. Despite our similar methodology, our subjects were only instructed to maintain and upgaze during recordings, but no further explanation or restrictions were given regarding avoiding to clench their jaw or do any other facial movements. Finally, based on our analyses, we do not suspect that age or air-bone gap contributed to this finding.
The excellent sensitivity and specificity of oVEMP amplitudes (both n1 and peak-to-peak) in this study, regardless of electrode montage, corroborate that oVEMP amplitude measurement is an excellent test in the diagnosis of SCDS. These results are in agreement with prior work conducted by our group which has shown excellent sensitivity and specificity (>90%) for oVEMP amplitudes in surgically confirmed SCDS patients [Janky et al., 2013; Zuniga et al., 2013]. However, while amplitudes did increase with montage-2, the sensitivity and specificity of using oVEMP amplitudes to discriminate between normal controls and patients with SCDS did not improve significantly. For the purpose of supporting the diagnosis of SCDS, results from this investigation did not find significant benefits of switching from recording oVEMPs using the standard electrode placement (montage-1) to the novel electrode placement (montage-2). In fact, considering the greater variability observed with montage-2 in addition to the limitation of non-recordable oVEMPs in the presence of facial hair, montage-1 can be more reliable.
It may be that use of electrode montage-2 will demonstrate benefit in the diagnosis of other inner ear conditions. For example, in individuals with naturally smaller oVEMP amplitudes, like older subjects or patients with Meniere's disease, recordings with electrode montage-2 could increase the likelihood of yielding present responses and help better appreciate small versus absent responses. However, further investigation is needed to validate this electrode montage as being purely vestibular in origin and to rule out the effects of other facial muscles.
Conclusion
Our findings suggest that oVEMP recordings with the standard electrode montage (montage-1) remain a reliable method for the evaluation of SCDS. Specifically, oVEMP peak-to-peak amplitudes utilizing the standard electrode montage provide excellent sensitivity and specificity.
Acknowledgement
Research study supported by NIH/NIDCD R01 DC005040 (JPC) and a Training Grant in Hearing and Balance (PI: Eric Young) T32DC000023 (KLJ).
Footnotes
The present work was a Poster Presentation at the 2012 ARO MidWinter Meeting.
Conflicts of interest: The authors have no conflicts of interest related to the present work.
References
- Belden CJ, Weg N, Minor LB, Zinreich SJ. CT evaluation of bone dehiscence of the superior semicircular canal as a cause f sound- and/or pressure-induced vertigo. Radiology. 2003;226(2):337–343. doi: 10.1148/radiol.2262010897. [DOI] [PubMed] [Google Scholar]
- Brantberg K, Bergenius J, Tribukait A. Vestibular-evoked myogenic potentials in patients with dehiscence of the superior semicircular canal. Acta Otolaryngol. 1999;119(6):633–640. doi: 10.1080/00016489950180559. [DOI] [PubMed] [Google Scholar]
- Chien W, Ravicz ME, Rosowski JJ, Merchant SN. Measurements of human middle- and inner-ear mechanics with dehiscence of the superior semicircular canal. Otol. Neurotol. 2007;28(2):250–257. doi: 10.1097/01.mao.0000244370.47320.9a. [DOI] [PMC free article] [PubMed] [Google Scholar]
- Colebatch JG, Halmagyi GM, Skuse NF. Myogenic potentials generated by a click-evoked vestibulocollic reflex. J. Neurol. Neurosurg. Psychiatry. 1994;57(2):190–197. doi: 10.1136/jnnp.57.2.190. [DOI] [PMC free article] [PubMed] [Google Scholar]
- Curthoys IS. A critical review of the neurophysiological evidence underlying clinical vestibular testing using sound, vibration and galvanic stimuli. Clin. Neurophysiol. 2010;121(2):132–144. doi: 10.1016/j.clinph.2009.09.027. [DOI] [PubMed] [Google Scholar]
- Curthoys IS, Manzari L. Evidence missed: ocular vestibular-evoked myogenic potential and cervical vestibular-evoked myogenic potential differentiate utricular from saccular function. Otolaryngol. Head. Neck. Surg. 2011;144(5):751–752. doi: 10.1177/0194599810397792. [DOI] [PubMed] [Google Scholar]
- Hirvonen TP, Weg N, Zinreich SJ, Minor LB. High-resolution CT findings suggest a developmental abnormality underlying superior canal dehiscence syndrome. Acta Otolaryngol. 2003;123(4):477–481. doi: 10.1080/0036554021000028099. [DOI] [PubMed] [Google Scholar]
- Iwasaki S, McGarvie LA, Halmagyi GM, Burgess AM, Kim J, Colebatch JG, Curthoys IS. Head taps evoke a crossed vestibulo-ocular reflex. Neurology. 2007;68(15):1227–1229. doi: 10.1212/01.wnl.0000259064.80564.21. [DOI] [PubMed] [Google Scholar]
- Janky KL, Nguyen KD, Welgampola M, Zuniga MG, Carey JP. Air-conducted oVEMPs provide the best separation between intact and superior canal dehiscent labyrinths. Otol. Neurotol. 2013;34(1):127–134. doi: 10.1097/MAO.0b013e318271c32a. [DOI] [PMC free article] [PubMed] [Google Scholar]
- Manzari L, Burgess AM, Curthoys IS. Dissociation between cVEMP and oVEMP responses: different vestibular origins of each VEMP? Eur. Arch. Otorhinolaryngol. 2010;267(9):1487–1489. doi: 10.1007/s00405-010-1317-9. [DOI] [PubMed] [Google Scholar]
- Manzari L, Burgess AM, McGarvie LA, Curthoys IS. Ocular and Cervical Vestibular-Evoked Myogenic Potentials to 500 Hz Fz Bone-Conducted Vibration in Superior Semicircular Canal Dehiscence. Ear Hear. 2012 doi: 10.1097/AUD.0b013e3182498c09. [DOI] [PubMed] [Google Scholar]
- Manzari L, Tedesco A, Burgess AM, Curthoys IS. Ocular vestibular-evoked myogenic potentials to bone-conducted vibration in superior vestibular neuritis show utricular function. Otolaryngol. Head. Neck. Surg. 2010;143(2):274–280. doi: 10.1016/j.otohns.2010.03.020. [DOI] [PubMed] [Google Scholar]
- Minor LB, Solomon D, Zinreich JS, Zee DS. Sound- and/or pressure-induced vertigo due to bone dehiscence of the superior semicircular canal. Arch. Otolaryngol. Head. Neck. Surg. 1998;124(3):249–258. doi: 10.1001/archotol.124.3.249. [DOI] [PubMed] [Google Scholar]
- Papathanasiou ES. Ocular vestibular evoked myogenic potentials (OVEMPs): Saccule or utricle? Clin. Neurophysiol. 2011 doi: 10.1016/j.clinph.2011.06.013. [DOI] [PubMed] [Google Scholar]
- Piker EG, Jacobson GP, McCaslin DL, Hood LJ. Normal characteristics of the ocular vestibular evoked myogenic potential. J. Am. Acad. Audiol. 2011;22(4):222–230. doi: 10.3766/jaaa.22.4.5. [DOI] [PubMed] [Google Scholar]
- Rosengren SM, Aw ST, Halmagyi GM, Todd NP, Colebatch JG. Ocular vestibular evoked myogenic potentials in superior canal dehiscence. J. Neurol. Neurosurg. Psychiatry. 2008;79(5):559–568. doi: 10.1136/jnnp.2007.126730. [DOI] [PubMed] [Google Scholar]
- Rosengren SM, Weber KP, Michels R, Sturm V, Laundau K, Straumann D. Single motor unit recordings of cular vestibular evoked myogenic potentials in human extraocular muscles.. 21st Meeting of the European Neurological Society.; Lisbon, Portugal. Mar, 2011. [Google Scholar]
- Rosowski JJ, Songer JE, Nakajima HH, Brinsko KM, Merchant SN. Clinical, experimental, and theoretical investigations of the effect of superior semicircular canal dehiscence on hearing mechanisms. Otol. Neurotol. 2004;25(3):323–332. doi: 10.1097/00129492-200405000-00021. [DOI] [PubMed] [Google Scholar]
- Welgampola MS, Carey JP. Waiting for the evidence: VEMP testing and the ability to differentiate utricular versus saccular function. Otolaryngol. Head. Neck. Surg. 2010;143(2):281–283. doi: 10.1016/j.otohns.2010.05.024. [DOI] [PMC free article] [PubMed] [Google Scholar]
- Welgampola MS, Myrie OA, Minor LB, Carey JP. Vestibular-evoked myogenic potential thresholds normalize on plugging superior canal dehiscence. Neurology. 2008;70(6):464–472. doi: 10.1212/01.wnl.0000299084.76250.4a. [DOI] [PubMed] [Google Scholar]
- Yang TH, Liu SH, Young YH. Evaluation of guinea pig model for ocular and cervical vestibular-evoked myogenic potentials for vestibular function test. Laryngoscope. 2010;120(9):1910–1917. doi: 10.1002/lary.21056. [DOI] [PubMed] [Google Scholar]
- Zuniga MG, Janky KL, Nguyen KD, Welgampola MS, Carey JP. Ocular versus cervical VEMPs in the diagnosis of superior semicircular canal dehiscence syndrome. Otol. Neurotol. 2013;34(1):121–126. doi: 10.1097/MAO.0b013e31827136b0. [DOI] [PMC free article] [PubMed] [Google Scholar]


