Abstract
Background
Quantification of myocardial “area at risk” (AAR) and myocardial infarction (MI) zone is critical for assessing novel therapies targeting myocardial ischemia–reperfusion (IR) injury. Current “gold‐standard” methods perfuse the heart with Evan's Blue and stain with triphenyl tetrazolium chloride (TTC), requiring manual slicing and analysis. We aimed to develop and validate a high‐resolution 3‐dimensional (3D) magnetic resonance imaging (MRI) method for quantifying MI and AAR.
Methods and Results
Forty‐eight hours after IR was induced, rats were anesthetized and gadopentetate dimeglumine was administered intravenously. After 10 minutes, the coronary artery was re‐ligated and a solution containing iron oxide microparticles and Evan's Blue was infused (for comparison). Hearts were harvested and transversally sectioned for TTC staining. Ex vivo MR images of slices were acquired on a 9.4‐T magnet. T2* data allowed visualization of AAR, with microparticle‐associated signal loss in perfused regions. T1 data demonstrated gadolinium retention in infarcted zones. Close correlation (r=0.92 to 0.94; P<0.05) of MRI and Evan's Blue/TTC measures for both AAR and MI was observed when the combined techniques were applied to the same heart slice. However, 3D MRI acquisition and analysis of whole heart reduced intra‐observer variability compared to assessment of isolated slices, and allowed automated segmentation and analysis, thus reducing interobserver variation. Anatomical resolution of 81 μm3 was achieved (versus ≈2 mm with manual slicing).
Conclusions
This novel, yet simple, MRI technique allows precise assessment of infarct and AAR zones. It removes the need for tissue slicing and provides opportunity for 3D digital analysis at high anatomical resolution in a streamlined manner accessible for all laboratories already performing IR experiments.
Keywords: magnetic resonance imaging, molecular imaging, myocardial ischemia–reperfusion, ventricular remodeling
Introduction
Ischemic heart disease remains the number 1 cause of death in Western society. Improvements in the techniques and speed with which patients receive reperfusion therapy have significantly decreased mortality and morbidity of patients suffering myocardial infarction (MI).1 However, regeneration of flow at the time of reperfusion also leads to a specific myocardial injury in addition to the injury caused by ischemia that is known as myocardial ischemia–reperfusion (IR) injury.2 This myocardial IR injury manifests itself clinically in the form of arrhythmias, reversible contractile dysfunction (myocardial stunning), endothelial dysfunction, and cell death.3–4 Contributing factors include postischemic low ATP and high phosphate levels, intracellular and mitochondrial calcium overload, oxidative stress and rapid increases in pH, endothelial dysfunction, and apoptosis.3,5 The inflammatory response is also thought to play an important role, and several experimental studies have demonstrated a reduction in MI size with anti‐inflammatory treatment.6–10
Rodent models of cardiovascular disease provide a valuable means to understand the molecular and physiological mechanisms that influence outcome. The ability to accurately quantitate outcome measures such as the extent of infarction permits assessment of response to novel therapeutic strategies. In this article, we address the problem of measuring the volume of infarction in animal models of IR injury. Current “gold standard” methods use a combination of selective perfusion of the heart with Evan's Blue and staining of the postmortem sectioned heart with triphenyl tetrazolium chloride (TTC) to quantitate the area at risk (AAR) and degree of completed infarct.11–12 Importantly, this approach accounts for variability in coronary artery anatomical supply, and can allow investigators to quantify the amount of salvaged myocardium. This method, although widely used and considered the “gold standard,” also has documented problems relating to the accurate and reproducible delineation of the border of the infarct and AAR zones.13 The requirement of manual slicing of tissue is labor intensive, and slices are relatively thick. This requires assumptions to be made about the surface borders reflecting that of the midslice tissue. Questions have also been raised regarding the sensitivity of TTC staining in the setting of a gradient of viability, as would be common in the setting of IR injury.14
Magnetic resonance imaging (MRI) is well recognized for its high spatial resolution (25 to 100 μm at fields higher than 3 T) and excellent soft‐tissue discrimination. Cardiac MRI (CMR) has been developed to provide accurate functional data, although this requires an expert team to optimize cardiac and respiratory gating at high fields when applied to rodents,15 which may be a rate‐limiting step in the majority of laboratories. Central to the clinical use of MRI to assess the ischemic heart is the use of delayed gadolinium‐enhanced images to define infarcted tissue.16 The enhancement seen in the setting of an acute infarct using this method is based on the increased permeability of the cell membrane associated with necrosis, and has been shown to correlate extremely well with histology.17
Delineation of AAR is considered a holy grail for cardiac MRI researchers. T2 sequences have been used to delineate areas of higher water content/edema. Although some studies have provided evidence for this approach,18–19 there is considerable controversy regarding this with concerns over reliability and robustness of the measure across different laboratories.20–21 Microparticles of iron oxide (MPIO) provide excellent negative contrast even at low concentrations, are inert, and remain intravascular.22 In this study, we compare the standard Evan's Blue/TTC method of AAR/infarct delineation against a novel method that uses a combination of T2* contrast from MPIO to define the borders of the perfused/unperfused myocardium, together with gadolinium‐based T1‐weighted enhancement to define the established infarct zone. We propose that this method has potential to provide rapid and accurate quantitation of these parameters in animal models of IR injury.
Methods
Animals and Experimental Model of Myocardial IR Injury
Sprague–Dawley rats (weight 250 to 300 g) were acclimatized for a period of 1 week before surgery. Procedures were conducted with the approval of the Royal North Shore Hospital Animal Care and Ethics Committee. Myocardial IR was induced as previously described using an open‐chest approach.23 Ischemia was induced for 30 minutes by transient suture ligation of the left anterior coronary artery ≈2 to 3 mm distal to the junction of pulmonary artery and left atrial appendage. The ligature was then released and the rats recovered for 48 hours. Under repeat anesthesia, gadopentetate dimeglumine 0.15 mmol/kg was infused via the tail vein. After 10 minutes, the left anterior coronary artery was re‐occluded and a solution containing MPIO (4.5 mg/kg body weight, as determined in pilot studies) mixed with 3% Evan's Blue, in a total volume of 5 mL, was infused. After a 2‐minute interval, the heart was then excised, sectioned into 2‐mm short‐axis slices, and placed in TTC 1% in phosphate‐buffered saline for 20 minutes at 37°C.24 Slices were photographed and then fixed in 10% normal buffered formalin. To reduce sample movement during MRI imaging, whole hearts and sections were set in agar gel. They were then stored at 4°C and imaged within 1 week of each experiment. A schematic illustration of both techniques is shown in Figure 1.
Figure 1.
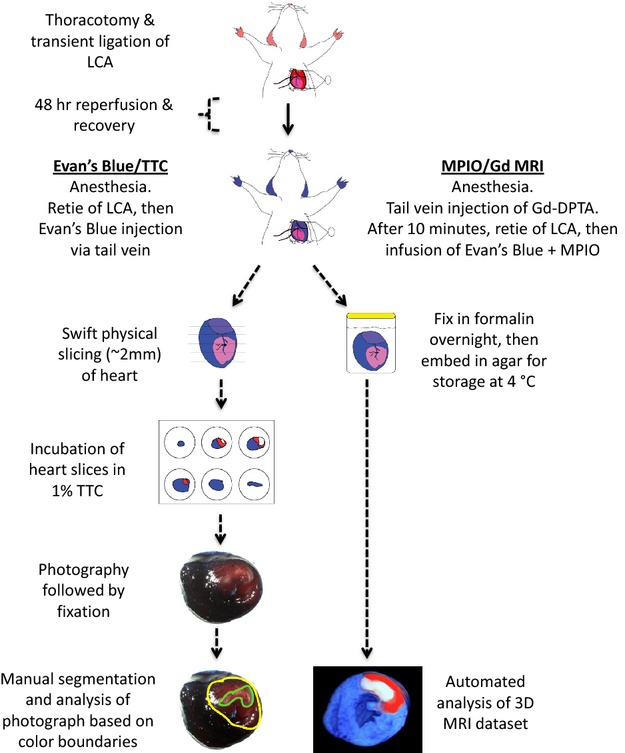
Schematic illustration comparing the steps involved in the traditional Evan's Blue/TTC technique, versus the automated MPIO/Gd 3D MRI technique. Gd‐DPTA indicates gadopentetate dimeglumine; LCA, left anterior coronary artery; MPIO/Gd, microparticles of iron oxide/gadolinium; MRI, magnetic resonance imaging; TTC, triphenyl tetrazolium chloride.
Iron‐Oxide Microparticles
MyOneTosyl‐activated iron microparticles (MPIO: diameter 1.08 μm, iron content 26%) were purchased from Life Technologies. The MPIO particles were diluted in phosphate‐buffered saline prior to use.
Magnetic Resonance Imaging: Protocol and Analysis
MRI data were acquired on a vertical 9.4‐T magnet (Biospec, Bruker, Ettlingen, Germany). Three‐dimensional gradient echo, inversion recovery (2‐dimensional multislice spin‐echo), and T2 sequences were acquired with parameters optimized in order to achieve anatomical detail as well as T1 and T2/T2* contrast. Details of imaging parameters are found in Table 1, and illustration of our process of sequence optimization is shown in Figure 2). Resolution was 81 μm3 for 3‐dimensional (3D) gradient echo, 163×325×400 μm for inversion recovery, and 120 μm3 for T2 sequences. T1 maps of sectioned MRI images were created from the inversion‐recovery images (TI range 100 ms—1500 ms), respectively, and along with T2* images were registered to a common coordinate system for region‐of‐interest analysis.
Table 1.
Technical Details of the Parameters Used for Acquiring MRI Data
| Sequence | Parameters |
|---|---|
| 3DGE | NA=4. TE=4 ms, TR=40 ms, flip angle=30°, FOV=20.8× 20.8×5.1 mm, matrix=256×256×64, resolution=81×81× 81 μm (zero‐filled to 40 μm3 isotropic) imaging time=44 min. |
| Inversion recovery sequence (2D multislice spin‐echo) | NA=1, TE=12.5 ms, TR=4000 ms, FOV=20.8×20.8, matrix=128× 64, 8 contiguous slices of 400 μm, in‐plane resolution=163×325 μm (zero‐filled to 81×81 μm), TI=100–1500 ms (6 steps: 300, 400, 600, 800, 1000, 1500 ms), imaging time=34 min (per TI value). |
| Spin‐echo images | TE=42 ms, TR=400, NE=3, resolution=120×120×120 μm (zero‐filled to 60×60 μm), imaging time=27 min |
3DGE indicates 3‐dimensional gradient echo; NA, Number of averages; TE, echo time; TR, repetition time; FOV, field of view; MRI, magnetic resonance imaging; TI, inversion time.
Figure 2.
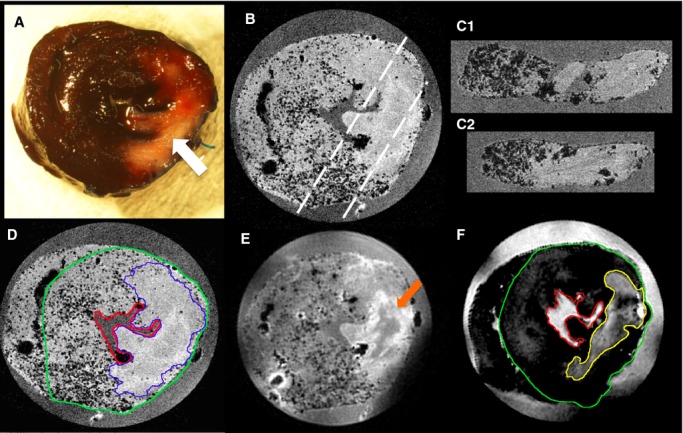
Visual comparison of traditional Evan's Blue/TTC and novel high‐field MRI technique for defining myocardial salvage zone. A, Photograph of sliced rat heart prepared using standard Evan's Blue TTC technique. The AAR is determined as the region of the heart that is not stained blue by Evan's Blue dye. Within the AAR the MI zone is seen as the central white zone (white arrow). The pink/red zone within the AAR defines the viable myocardium stained by TTC. Slice thickness is ≈2 mm. B, 3DGE (TE 4 ms) image of the same representative slice shown in A, illustrating the perfused myocardium appearance containing numerous signal voids (black dots), and clear delineation of perfused and nonperfused myocardium. Resolution: 81 μm3. The dashed white lines indicate the reformatted slices C1 and C2. D, 3DGE image of same slice with TE=8 ms showing increased T2* contrast within the perfused territory from the MPIOs (border zone of AAR delineated by blue line). Resolution: 81 μm3. E, Spin echo MRI image (TE=42 ms, TR=600 ms) of same slice highlighting T2 contrast within the MI zone, while also showing signal voids from MPIO. Some low‐intensity signal (orange arrow) can be seen centrally within the MI zone likely secondary to microvascular obstruction. Resolution: 120 μm3. F, Inversion recovery image of the same slice shown in E, highlighting the T1 contrast caused by gadolinium within the MI zone (yellow line). Resolution: 163×325×400 μm. The LV epicardial contour is shown in D and F by a green line and the endocardial surface by a red line. AAR indicates area at risk; DGE, delayed gadolinium enhanced; LV, left ventricular; MI, myocardial infarction; MPIO, microparticles of iron oxide; MRI, magnetic resonance imaging; TE, echo time; TTC, triphenyl tetrazolium chloride.
The 3 image stacks (T1 map, T2*, and T2) were used for each heart section. For comparison with Evan's Blue/TTC stained slices, analysis of the MRI data was restricted to 8 evenly spaced slices. Figure 2D and 2F shows representative segmentation on a 3D gradient echo (T2) image and T1‐weighted image. The MRI images were preprocessed to define left and right ventricular epicardium and left ventricular endocardium by 1 observer. Regions of interest for the AAR and MI were then manually contoured by 4 blinded observers, and by 1 observer twice, with 1 week between analyses. AAR was identified by an absence of signal voids from MPIO in the T2* image stack, and MI was identified by high intensity on an inverted T1 map (ie, longitudinal relativity, R1). In the case of any discrepancy, any region that was defined as MI was included as AAR. Regions of confluent signal within the MI, most likely representing microhemorrhage,25 were included as infarct zone. The T2 image was used to assist with anatomical definition of the AAR and MI zones.
The same analysis technique was used for the MR whole heart images following reformatting of the data to present the data in left ventricle short‐axis (SA) orientation. For the whole‐heart MRI analysis technique, 20 SA slices (650‐μm slice spacing) were generated covering the whole heart. In addition, an automatic segmentation of the AAR and MI regions in the whole‐heart MRI volumes was carried out. A 3D minimum filter was applied to accentuate the signal voids due to MPIO, followed by a 2D 9×9 pixel standard deviation filter, which resulted in low signal in the region of AAR, and high signal outside of the AAR where signal voids were present. Within the region detected as AAR, thresholding of the T1 map images was used to define MI regions. The T1 threshold was chosen based on a single manual segmentation.
The photographed heart sections were also preprocessed to define left and right epicardium and left endocardium borders before being analyzed by the same observers, identifying AAR and MI on the apical side of each heart section following standard protocols.24 Custom code written in Matlab (The MathWorks Co, Natick, MA) was used for all analysis.
Statistical Analysis
Statistical analysis was performed within Matlab and SPSS v20 (IBM, NY). The Bland Altman statistical test was used to assess intra‐ and interobserver variability, with the results presented graphically including mean differences and 95% limits of agreement. Summary results are presented as mean ± SEM.
Results
MPIO to Delineate AAR
Initial visual inspection of the MRI data, focusing on the T2 and T2* data, found evenly spread foci of signal loss (observed as “black dots”) in regions that remained perfused outside the territory of the ligated coronary artery, and no “dots” in the area perfused by the coronary artery (AAR) (Figure 2). The presence of small microbubbles did not compromise visualization of AAR borders, and was minimized through careful sample preparation. The small number of bubbles present could easily be differentiated from microparticles due to size and position (bubbles are larger and more peripheral).
Consistent with our previous observations,25 regions in the MI region of some hearts demonstrated signal loss in a midwall distribution with a more confluent pattern than that of the discrete signal loss attributed to MPIO (Figure 2). We have previously demonstrated by histological techniques that this corresponds to microhemorrhage at the core of the MI.25 Similar MRI signal loss has been reported in human CMR images, and has been associated with MI size and prognosis.26
We examined the correlation of AAR using the traditional Evan's Blue technique, and that determined by MPIO/MRI technique, using the calculated AAR as a percentage of myocardial mass (Figure 3). This direct comparison required MRI and analysis to be performed on sliced myocardium, taking away a major advantage of MRI related to examining an intact 3D dataset, and being able to easily examine adjacent regions “above” or “below.” Figure 3A provides a scatterplot comparing the AAR calculated using the 2 methods. While the size of the AAR varied between animals, the correlation between the measurements was high (r=0.95, P=0.004). The intra‐ and interobserver variability was assessed using a Bland‐Altman plot for both techniques (Figure 3B). The particulate nature of the MPIO avoids the diffusional blurring seen using Evan's Blue. This superior edge definition that results from using the MPIO/Gd (microparticles of iron oxide/gadolinium) MRI technique is demonstrated in Figure 4.
Figure 3.
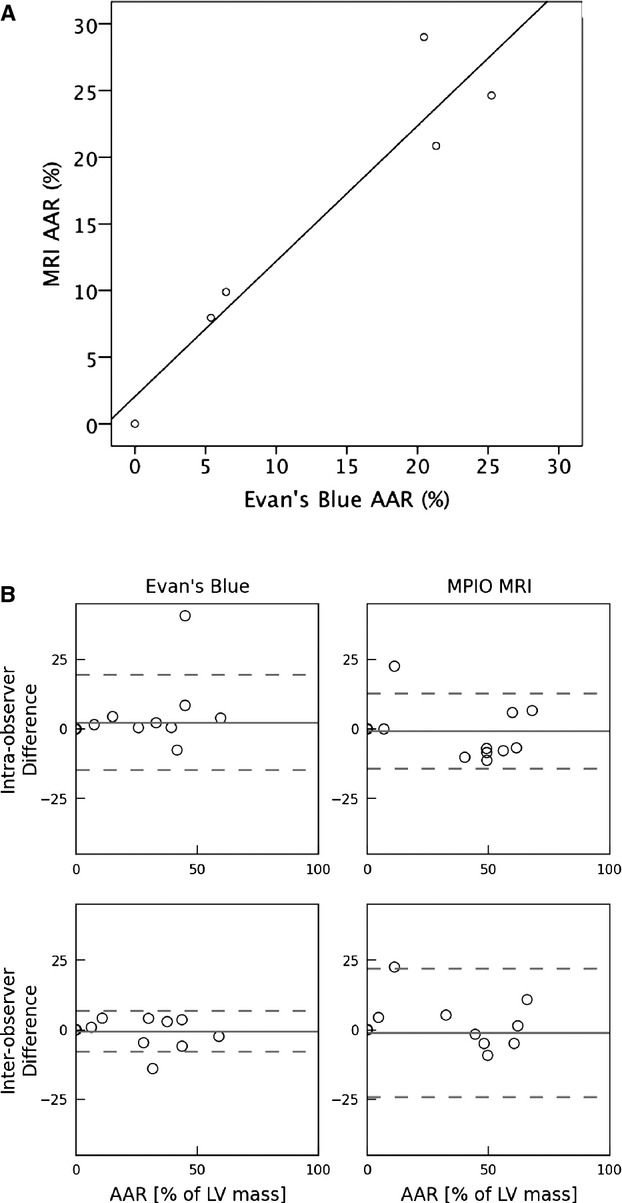
Comparison between AAR measurements obtained using MPIO MRI vs traditional Evan's Blue methods. A, Scatterplot of the calculated AAR (expressed as % of LV mass) for MPIO MRI method vs Evan's Blue method performed on same isolated tissue slices (r=0.94; P=0.004). B, Bland‐Altman plot examining the intra‐observer (top 2 panels) and interobserver (bottom 2 panels) variability for the 2 methods when both were applied to the same tissue slices. The dashed lines represent the 95% level of agreement. AAR indicates area at risk; MPIO, microparticles of iron oxide; MRI, magnetic resonance imaging; LV, left ventricular.
Figure 4.
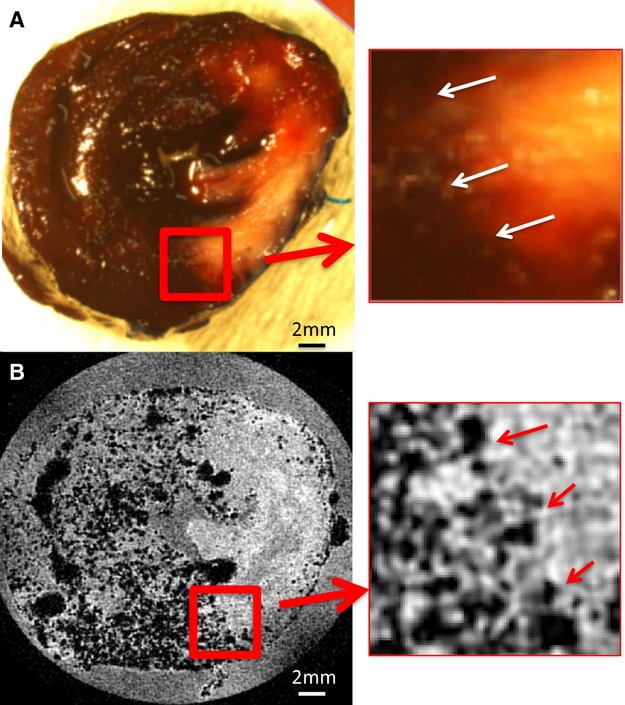
Comparison between the borderzone definition of the AAR using Evan's Blue (A) and MPIO (B). The edge definition (white arrows, A; red arrows, B) using Evan's Blue appears indistinct due to diffusion of the stain and the reduced contrast between Evan's Blue–positive area and the TTC‐positive staining. In contrast, the particulate nature of the MPIO, and the T‐weighted image acquisition, create a sharp definition of the border between the AAR and the perfused territory. Insets show magnified image. Two millimeter magnified views are provided to the right of A and B. AAR indicates area at risk; MPIO, microparticles of iron oxide; TTC, triphenyl tetrazolium chloride.
Gadolinium Enhancement to Delineate MI
Initial visual inspection of the MRI images showed that using longitudinal relaxivity (R1) data (ie, an inverted T1 map), in which the MI zone appears as high intensity, was preferable to using either the raw T1‐weighted inversion recovery data or an orthodox presentation of the T1 maps (in which the MI zone appears as a region of low intensity). The regions of T1 shortening correlated closely with the distribution of infarction defined by TTC on corresponding images (eg, Figure 2).
Figure 5A shows a comparison between the MI mass measured using the Evan's Blue/TTC method versus using the MPIO/Gd MRI method in the same slices. There was a good correlation between 2 methods for the measurement of MI (r=0.93, P=0.020). A Bland‐Altman plot of the 2 methods is presented in Figure 5B, demonstrating adequate inter‐ and intra‐observer variability when applying the MPIO/Gd MRI method to sliced heart slabs where the majority of points fall between the 95% limits of agreement. For the TTC data, there is a nonsignificant trend toward positive differences at low percent infarct and negative differences at high percent infarct.
Figure 5.
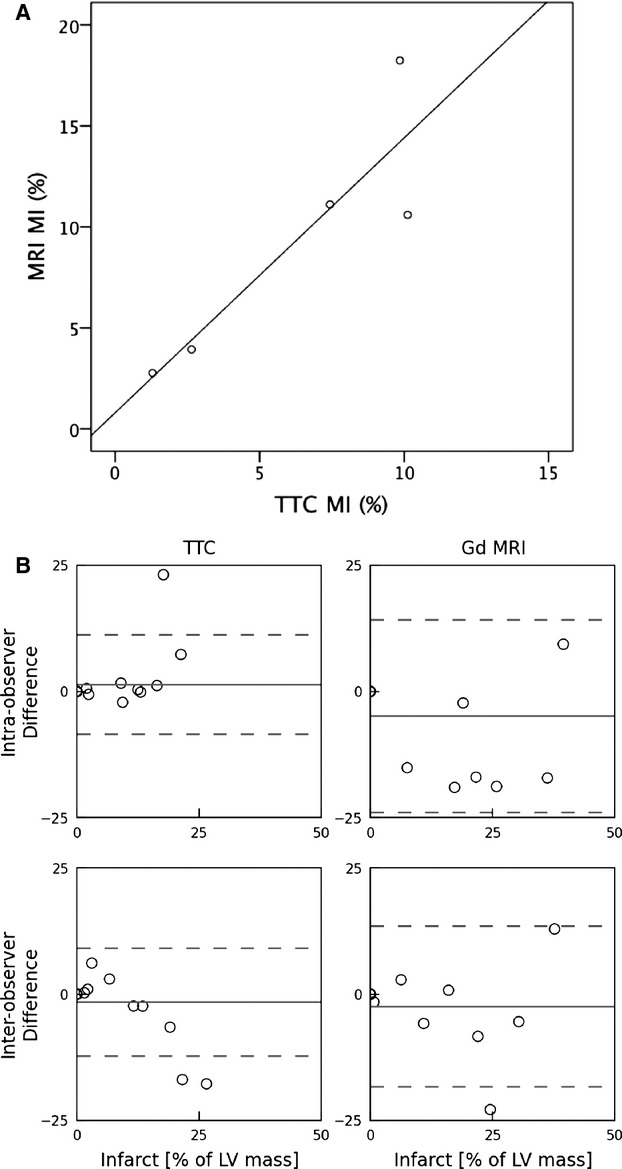
Comparison between MI quantification obtained using Gd MRI vs traditional TTC method. A, Scatterplot of calculated MI volume (expressed as % of LV) for the Gd MRI vs traditional TTC method performed on same isolated tissue slices (r=0.93; P=0.04). B, Bland‐Altman plot examining the intraobserver (top 2 panels) and interobserver (bottom 2 panels) variability for the 2 methods when both were applied to the same tissue slices. The dashed lines represent the 95% level of agreement. LV indicates left ventricular; MI, myocardial infarction; MRI, magnetic resonance imaging; TTC, triphenyl tetrazolium chloride; Gd, gadolinium.
Analysis of AAR and MI in Whole Hearts
In order to comprehensively assess the potential benefits of the MPIO/Gd MRI technique, an additional 4 hearts were assessed, but were imaged as intact hearts, thereby preserving the 3D information inherently provided by this technique. Figure 6 demonstrates the continuity of both the AAR and MI zones in both short‐axis (SA, top 2 rows), and long‐axis views (4 chamber—left, and LVLA—right). At the 4 SA levels chosen as representative slices, the definition and extent of the AAR and MI zones are clearly demarcated. The ability to scroll between slices acts to further clarify any unclear regions, meaning that little ambiguity is present when assigning regions manually. The anatomical relationships of the segmented territories are also clearly identified, making it easier for the investigator to exclude artifactual changes in signal.
Figure 6.
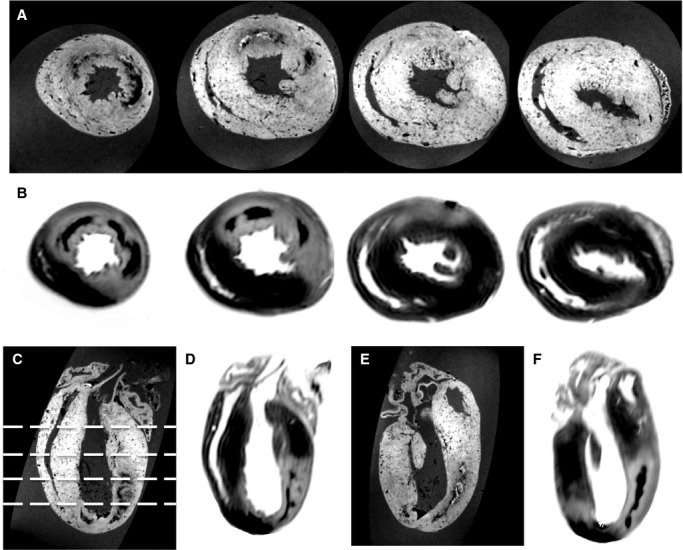
Selected images from 3D MRI volumetric images of a whole rat heart following IR and preparation using the MPIO/Gd method. A, Short‐axis GE slices from the apex to base demonstrating clear definition of the AAR. The border of the MPIO signal voids delineates the AAR from the myocardium not perfused by the occluded vessel. The position of the slices is shown in C. B, Co‐registered slices from a 3D R1 map (ie, inverted T1), clearly demonstrating the MI zone as high‐signal against a low‐signal background of normal myocardium. Note the low signal contained within the MI zone due to microhemorrhage. C, D, 4 chamber and (E, F) LVLA reformats of both GE and R1 map data showing the transmural nature of the MI and the full extent of the endocardial extension reformats of GE and R1 map data. AAR indicates area at risk; GE, gradient echo; MI, myocardial infarction; MPIO/Gd, microparticles of iron oxide/gadolinium; MRI, magnetic resonance imaging; IR, ischemia–reperfusion; LVLA, left ventricle long axis.
Figure 7A shows a plot of the AAR and MI masses for each of the whole heart samples. Figure 7B shows a Bland‐Altman plot of the intra‐observer and interobserver variation for manual quantitation of both AAR and MI mass. Compared with the conventional AAR/MI measures (Evan's Blue/TTC staining of the sliced hearts assessed in Figures 3B and 5B), MRI‐derived AAR and MI from whole hearts show tighter intra‐observer limits of agreement for both measures, and similar interobserver agreement.
Figure 7.
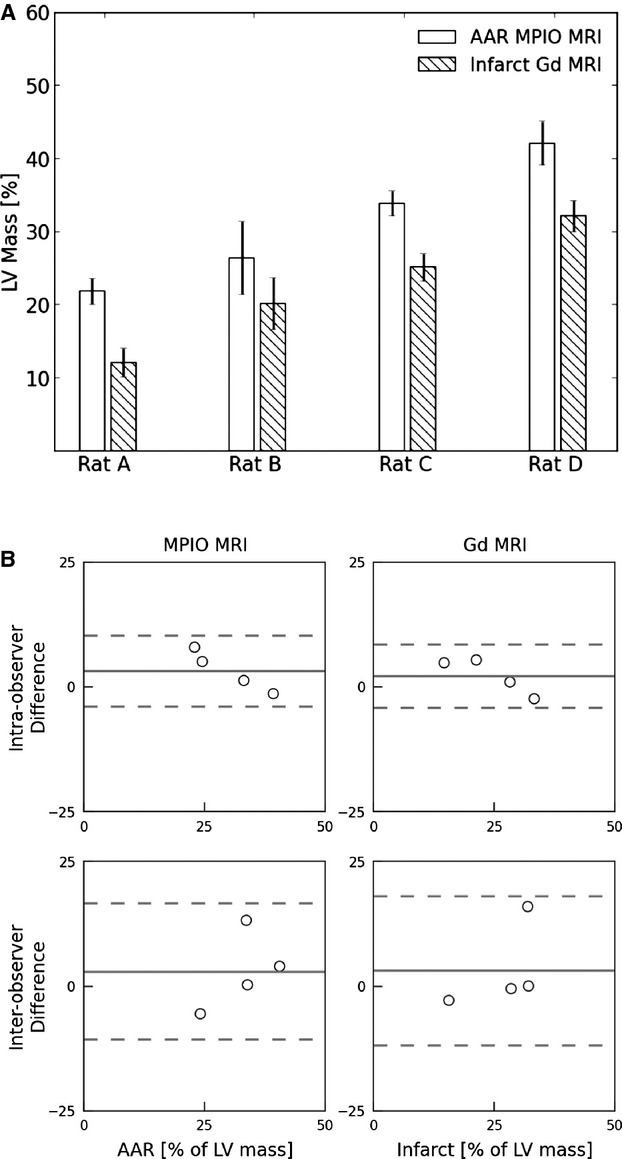
Summary of AAR and MI measurements in whole rat hearts (n=4 readers) following IR using the MPIO/Gd MRI method. A, AAR and infarct zones (expressed as a percentage of LV myocardial mass ±SEM). B, Bland‐Altman plots examining the intra‐observer (top 2 panels) and interobserver (bottom 2 panels) variability for determination of AAR (left) and MI zones (right). The dashed lines represent the 95% level of agreement. AAR indicates area at risk; LV, left ventricular; MI, myocardial infarction; MPIO/Gd, microparticles of iron oxide/gadolinium; MRI, magnetic resonance imaging; IR, ischemia–reperfusion.
We next explored automated methods for segmenting and quantitating the AAR and MI zones, since the high‐contrast and digital 3D nature of the MRI data is inherently suited to an algorithmic, automated approach. Figure 8 shows a 3D representation of the segmented heart, with the MI color‐coded in white, the AAR as red, and the unaffected myocardium coded as blue. The left anterior oblique (LAO) projection shows how the zonal nature of the AAR and MI regions are precisely captured by our automated approach, and the SA and 4‐chamber views demonstrate the clear delineation of the borders of each zone. The ability of the investigator to scroll through the digital dataset, in order to appreciate anatomic relationships, is highlighted by Movie S1 and S2.
Figure 8.
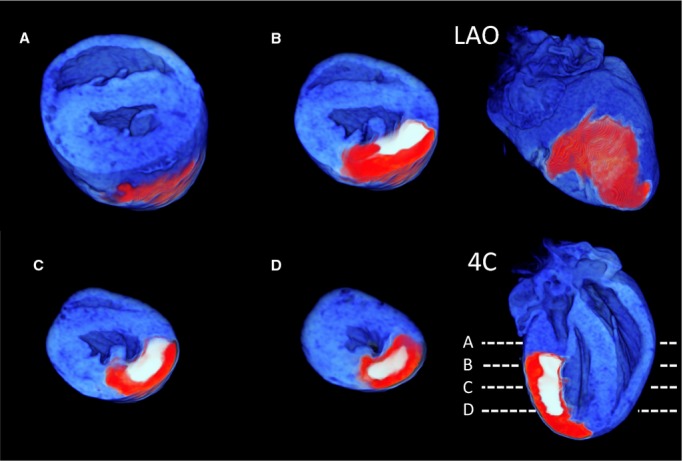
A 3D reformat of a whole rat heart following automated segmentation of the AAR and MI zones. The AAR is coded as red, the MI as white, and the myocardium beyond the AAR as blue. Short‐axis views from the base to apex demonstrating the clear delineation of the MI. A through D, The level of the slices is shown in the 4‐chamber (4C) view. An LAO projection shows the surface distribution of the occluded AAR territory following an expected distribution over the anterior and lateral walls of the LV. AAR indicates area at risk; MI, myocardial infarction; LAO, left anterior oblique; LV, left ventricle.
Figure 9 shows Bland‐Altman plots comparing the inter‐observer variability between the manual and automatic segmentation of the whole heart for and MI zones. These show good agreement between the segmentation strategies.
Figure 9.
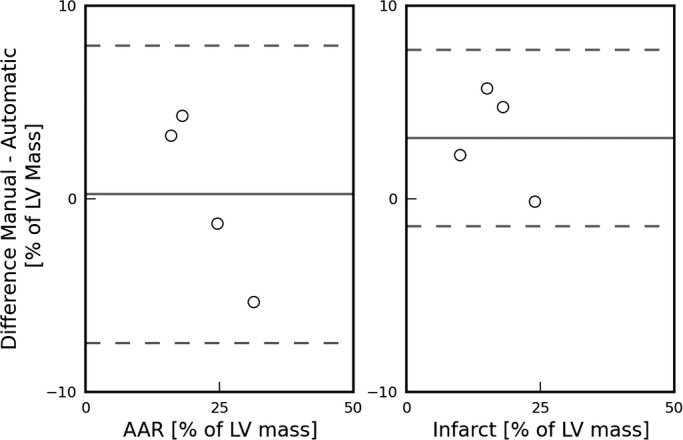
Bland‐Altman plots comparing manual and automatic detection of the AAR (left) and MI (right) zones in intact (nonsliced) rat heart (n=4) using the MPIO/Gd technique. The dashed lines represent the 95% level of agreement. AAR indicates area at risk; MI, myocardial infarction; MPIO/Gd, microparticles of iron oxide/gadolinium.
Discussion
In this study, we have applied high‐field cardiac MRI to precisely assess MI size and AAR in a rat model of myocardial IR. This removes the need for physical slicing of the fresh, postmortem heart, offering the possibility for reducing the error of measurements and providing the opportunity for high‐resolution, automated 3D digital analysis.
Given the clinical importance of MI and its complications, investigators have been looking to animal models to assist them in understanding the pathogenesis, and to assess efficacy of novel therapies. Due to cost and ease of management, the use of mouse and rats has predominated. Providing genetic modification is not required, the rat has advantages of not only being convenient to house, and relatively inexpensive, but also, compared to the mouse, being technically easier on which to perform the required cardiac surgery. In regions of complete MI, achieved with a complete ligation model, histopathology in the rat has been found to be similar to that in humans, although with an accelerated time‐course, and less polymorph infiltration.27 In the case of temporary ligation, and myocardial IR injury, the histopathologic changes are more patchy than in humans.24 The surgical transient ligation model, as we have performed in this study, is the most commonly used technique to achieve myocardial IR injury.24 The occlusion time of 30 minutes is usually chosen, with longer periods resulting in larger areas of infarction and associated higher mortality.28–29 Although investigators may ligate the left coronary artery at what appears to be the “same place” for every animal, the variation in coronary anatomy and the territory of myocardium supplied by the vessel means that there is considerable variation in the area of threatened myocardium or AAR. If only MI size was measured, without this denominator of AAR, the noise of experimental data would be greatly increased. In contrast, precise assessment of AAR allows for the MI size to be expressed in relation to this, and the effect of therapy on salvaged myocardium to be fully appreciated. For this purpose, Evan's Blue injection, with the vessel re‐ligated, has become indispensable to researchers for decades, and is widely accepted as the “gold standard” technique. However, even experienced researchers will acknowledge difficulties with the technique.
We have developed a user‐friendly technique, in which AAR is defined by perfusion border zones of MPIO instead of Evan's Blue, and the MI region is highlighted by gadolinium uptake. MRI then provides a high‐resolution digital dataset, and removes the requirement for manual slicing of fresh postmortem heart. Given that the physical principles delineating perfused and nonperfused myocardial segments are similar in the 2 techniques, and that late gadolinium enhancement (LGE) and TTC techniques have previously been highly correlated,16 it is not unexpected that the 2 approaches provided very similar MI/AAR measurements for corresponding slices. However, the major benefits of the MRI technique are realized through whole‐heart analysis. The 3D digital dataset allows the operator to scroll through adjacent slices (Figure 8 and Movie S1 and S2), and for automated segmentation and quantification to be performed. Improved ability to examine anatomic relationships of the segments also helps ensure that artifacts are excluded.
Access of investigators to an entire high‐resolution 3D dataset (effective isotropic resolution 40 to 80 μm, depending on acquisition time available), rather than just the surface of five ≈2‐mm slices, ensures that any regional effects of intramyocardially applied therapies such as stem cell injections will not be overlooked. These methodological improvements not only improve the ease of the measurements, but also will likely result in less intra‐observer variability (Figure 7B), and if automated strategies are used, removal of the nonsystematic components of interobserver variability.
Although the ex‐vivo nature of our 3D MRI technique has limitations in regard to serial studies, and assessing functional correlations, it does open up the possibility of an easily accessible technique for laboratories that may not have direct access to high‐field MRI facilities and staff expert in high‐field, cardiac‐gated MRI. It is emminently feasible, using this technique, for research teams to prepare the hearts, and have them imaged at high resolution by a core facility, with the prepared hearts being suitable for postal delivery. In the case of this study, hearts were imaged within 1 week. Although previous studies have identified issues with relatively rapid dispersion of gadolinium (within hours),30 this did not cause significant problems in our hands using heart tissue that was rapidly fixed postmortem. Furthermore, we observed stability of the AAR border zones with the MPIO compared with our experience using Evan's Blue, where we often found postmortem diffusion of the blue agent making the borders blurry. The ex‐vivo nature or novel approach also overcomes issues related to cardiac movement, and engineering challenges of imaging the high heart rate of the smaller animal. This allows high‐resolution imaging to be acquired. The 3D nature of the data obtained using this technique also allows for digital analysis and automated segmentation. The technique is applicable to both smaller (eg, mouse) and larger animals. A comparison of the advantages and disadvantages of the traditional Evan's Blue/TTC technique and the 3D MPIO/Gd MRI technique is provided in Table 2.
Table 2.
Advantages and Disadvantages of the Traditional Evan's Blue/TTC Technique, Vs the 3D MPIO/Gd MRI Approach
| Evan's Blue/TTC | 3D MPIO/Gd MRI |
|---|---|
| Requires IV tail injections | Requires IV tail injections |
| Requires re‐ligation of culprit vessel | Requires re‐ligation of culprit vessel |
| Assessment is postmortem, excluding possibility of serial study | Assessment is postmortem, excluding possibility of serial study |
| Relies on physical cutting of 2‐mm slices of fresh postmortem heart, on average resulting in 5 slices for 1 rat heart | High resolution, with slice thickness not limited at a practical level (eg, we acquired 48 “slices” for 1 heart) |
| Assumptions made that AAR/MI same across the volume of the 2‐mm slice | No requirement for assumptions due to high number of slices and high resolution |
| Evan's Blue can diffuse across the border zones, making rapid assessment essential, and reducing the clarity of measurement | MPIO appears to be more restricted in its diffusion, and the border zones are seen clearly even 1 week postfixation |
| Requires manual tracing of borders, and calculation of volumes for MI and AAR | Extremely suited to 3D digital analysis and automated segmentation |
| Difficult to easily assess corresponding myocardium between slices | Extremely easy for operator to scroll through slices, and examine anatomic relationships to reduce error |
AAR indicates area at risk; 3D, 3‐dimensional; MI, myocardial infarction; MPIO/Gd, microparticles of iron oxide/gadolinium; MRI, magnetic resonance imaging; TTC, triphenyl tetrazolium chloride.
Hopes have been pinned on CMR by investigators studying myocardial salvage in the setting of IR and infarction in vivo. The most successful technique of imaging the AAR to date, based on higher T2 signal intensity in the edematous myocardium postischemia, requires highly expert teams to interpret and acquire the data and is poorly reproducible across laboratories.20 Recent advances in T2‐weighted CMR, including with free‐breathing, motion‐correction,31–32 and T2 mapping, have partially alleviated problems related to inherently low signal‐to‐noise ratio, and inconsistent image quality.21 Furthermore, precontrast T1 mapping has shown potential to provide more robust definition of the AAR.33 Despite these major breakthroughs, recent clinical studies highlight remaining practical difficulties in applying edema‐imaging techniques to larger clinical studies, with the need to exclude a significant portion of patients from myocardial salvage assessment by CMR due to insufficient image quality.34 The technical difficulty of cardiac gating with rapid heart rates of mice and rats in a small‐bore, high‐field magnet exacerbates these issues. The application to preclinical research is hampered further by the fact that therapies, including ischemic preconditioning, can influence water content and T2 signal intensity, independently of the true AAR.35 Combined, these factors make current in vivo assessment of myocardial IR injury and myocardial salvage by CMR not only technically challenging, but also far less reliable than the high‐resolution, postmortem histological approach, and, as such, in vivo MRI approaches to this methodological challenge in rodents is not comparable to our current study findings.
Conclusions
IR injury is considered a major contributor to the residual morbidity and mortality resulting from MI. Improved robustness and precision in quantifying salvaged myocardium is key to the success of research programs aimed at minimizing myocardial IR injury. We have developed a novel, automatable 3D MRI technique that improves the robustness of measurement of the salvaged myocardium, and is accessible to any laboratory capable of performing standard Evan's Blue/TTC assessment.
Supplementary Material
Appendix 1 Supplementary Movie S1.
Appendix 2 Supplementary Movie S2.
Appendix 3 Legends to supplementary movies S1 and S2.
Sources of Funding
This work was supported by a grant from the North Shore Heart Research Foundation and by Project grant 632551 from the National Health & Medical Research Council (NHMRC), Australia. Grieve and Figtree acknowledge the support of the Sydney University Medical Foundation. Figtree was supported by NHMRC/Heart Foundation cofunded Career Development Fellowship. Animal NMR imaging facilities were funded by the Australian Research Council.
Disclosures
None.
Acknowledgments
The authors are grateful for the technical assistance of Dr Bob Chapman, who assisted in the acquisition of CMR data.
References
- 1.Goldberg RJ, Currie K, White K, Brieger D, Steg PG, Goodman SG, Dabbous O, Fox KA, Gore JM. Six‐month outcomes in a multinational registry of patients hospitalized with an acute coronary syndrome (the Global Registry of Acute Coronary Events [GRACE]). Am J Cardiol. 2004; 93:288-293. [DOI] [PubMed] [Google Scholar]
- 2.Keeley EC, Boura JA, Grines CL. Primary angioplasty versus intravenous thrombolytic therapy for acute myocardial infarction: a quantitative review of 23 randomised trials. Lancet. 2003; 361:13-20. [DOI] [PubMed] [Google Scholar]
- 3.Wang QD, Pernow J, Sjoquist PO, Ryden L. Pharmacological possibilities for protection against myocardial reperfusion injury. Cardiovasc Res. 2002; 55:25-37. [DOI] [PubMed] [Google Scholar]
- 4.Kloner RA, Rezkalla SH. Cardiac protection during acute myocardial infarction: where do we stand in 2004? J Am Coll Cardiol. 2004; 44:276-286. [DOI] [PubMed] [Google Scholar]
- 5.Ambrosio G, Tritto I. Reperfusion injury: experimental evidence and clinical implications. Am Heart J. 1999; 138:S69-S75. [DOI] [PubMed] [Google Scholar]
- 6.Litt MR, Jeremy RW, Weisman HF, Winkelstein JA, Becker LC. Neutrophil depletion limited to reperfusion reduces myocardial infarct size after 90 minutes of ischemia: evidence for neutrophil‐mediated reperfusion injury. Circulation. 1989; 80:1816-1827. [DOI] [PubMed] [Google Scholar]
- 7.Hayward R, Campbell B, Shin YK, Scalia R, Lefer AM. Recombinant soluble P‐selectin glycoprotein ligand‐1 protects against myocardial ischemic reperfusion injury in cats. Cardiovasc Res. 1999; 41:65-76. [DOI] [PubMed] [Google Scholar]
- 8.Zhao ZQ, Lefer DJ, Sato H, Hart KK, Jefforda PR, Vinten‐Johansen J. Monoclonal antibody to ICAM‐1 preserves post‐ischemic blood flow and reduces infarct size after ischemia‐reperfusion in rabbit. J Leukoc Biol. 1997; 62:292-300. [DOI] [PubMed] [Google Scholar]
- 9.Entman ML, Smith CW. Postreperfusion inflammation: a model for reaction to injury in cardiovascular disease. Cardiovasc Res. 1994; 28:1301-1311. [DOI] [PubMed] [Google Scholar]
- 10.Jolly SR, Kane WJ, Hook BG, Abrams GD, Kunkel SL, Lucchesi BR. Reduction of myocardial infarct size by neutrophil depletion: effect of duration of occlusion. Am Heart J. 1986; 112:682-690. [DOI] [PubMed] [Google Scholar]
- 11.Gao E, Lei YH, Shang X, Huang ZM, Zuo L, Boucher M, Fan Q, Chuprun JK, Ma XL, Koch WJ. A novel and efficient model of coronary artery ligation and myocardial infarction in the mouse. Circ Res. 2010; 107:1445-1453. [DOI] [PMC free article] [PubMed] [Google Scholar]
- 12.Virag JA, Lust RM. Coronary artery ligation and intramyocardial injection in a murine model of infarction. J Vis Exp. 2011; 52:2581. [DOI] [PMC free article] [PubMed] [Google Scholar]
- 13.Holmbom B, Naslund U, Eriksson A, Virtanen I, Thornell LE. Comparison of triphenyltetrazolium chloride (TTC) staining versus detection of fibronectin in experimental myocardial infarction. Histochemistry. 1993; 99:265-275. [DOI] [PubMed] [Google Scholar]
- 14.Freeman I, Grunwald AM, Robin B, Rao PS, Bodenheimer MM. Effect of early reperfusion on use of triphenyltetrazolium chloride to differentiate viable from non‐viable myocardium in area of risk. Cardiovasc Res. 1990; 24:109-114. [DOI] [PubMed] [Google Scholar]
- 15.Schneider JE, Cassidy PJ, Lygate C, Tyler DJ, Wiesmann F, Grieve SM, Hulbert K, Clarke K, Neubauer S. Fast, high‐resolution in vivo cine magnetic resonance imaging in normal and failing mouse hearts on a vertical 11.7 T system. J Magn Reson Imaging. 2003; 18:691-701. [DOI] [PubMed] [Google Scholar]
- 16.Kim RJ, Fieno DS, Parrish TB, Harris K, Chen EL, Simonetti O, Bundy J, Finn JP, Klocke FJ, Judd RM. Relationship of MRI delayed contrast enhancement to irreversible injury, infarct age, and contractile function. Circulation. 1999; 100:1992-2002. [DOI] [PubMed] [Google Scholar]
- 17.Arheden H, Saeed M, Higgins CB, Gao DW, Bremerich J, Wyttenbach R, Dae MW, Wendland MF. Measurement of the distribution volume of gadopentetate dimeglumine at echo‐planar MR imaging to quantify myocardial infarction: comparison with 99mTc‐DTPA autoradiography in rats. Radiology. 1999; 211:698-708. [DOI] [PubMed] [Google Scholar]
- 18.Aletras AH, Tilak GS, Natanzon A, Hsu L‐Y, Gonzalez FM, Hoyt RF, Arai AE. Retrospective determination of the area at risk for reperfused acute myocardial infarction with T2‐weighted cardiac magnetic resonance imaging: histopathological and displacement encoding with stimulated echoes (DENSE) functional validations. Circulation. 2006; 113:1865-1870. [DOI] [PubMed] [Google Scholar]
- 19.Friedrich MG, Abdel‐Aty H, Taylor A, Schulz‐Menger J, Messroghli D, Dietz R. The salvaged area at risk in reperfused acute myocardial infarction as visualized by cardiovascular magnetic resonance. J Am Coll Cardiol. 2008; 51:1581-1587. [DOI] [PubMed] [Google Scholar]
- 20.Mewton N, Rapacchi S, Augeul L, Ferrera R, Loufouat J, Boussel L, Micolich A, Rioufol G, Revel D, Ovize M, Croisille P. Determination of the myocardial area at risk with pre‐ versus post‐reperfusion imaging techniques in the pig model. Basic Res Cardiol. 2011; 106:1247-1257. [DOI] [PubMed] [Google Scholar]
- 21.Eitel I, Friedrich MG. T2‐weighted cardiovascular magnetic resonance in acute cardiac disease. J Cardiovasc Magn Reson. 2011; 13:13. [DOI] [PMC free article] [PubMed] [Google Scholar]
- 22.McAteer MA, Sibson NR, von ZurMuhlen C, Schneider JE, Lowe AS, Warrick N, Channon KM, Anthony DC, Choudhury RP. In vivo magnetic resonance imaging of acute brain inflammation using microparticles of iron oxide. Nat Med. 2007; 13:1253-1258. [DOI] [PMC free article] [PubMed] [Google Scholar]
- 23.Bhindi R, Khachigian LM, Lowe HC. DNAzymes targeting the transcription factor Egr‐1 reduce myocardial infarct size following ischemia‐reperfusion in rats. J Thromb Haemost. 2006; 4:1479-1483. [DOI] [PubMed] [Google Scholar]
- 24.Bhindi R, Witting PK, McMahon AC, Khachigian LM, Lowe HC. Rat models of myocardial infarction—pathogenetic insights and clinical relevance. Thromb Haemost. 2006; 96:602-610. [PubMed] [Google Scholar]
- 25.Grieve SM, Lonborg J, Mazhar J, Tan TC, Ho E, Liu CC, Lay W, Gill AJ, Kuchel P, Bhindi R, Figtree GA. Cardiac magnetic resonance imaging of rapid VCAM‐1 up‐regulation in myocardial ischemia‐reperfusion injury. Eur Biophys J. 2013; 42:61-70. [DOI] [PubMed] [Google Scholar]
- 26.Wu KC, Zerhouni EA, Judd RM, Lugo‐Olivieri CH, Barouch LA, Schulman SP, Blumenthal RS, Lima JAC. Prognostic significance of microvascular obstruction by magnetic resonance imaging in patients with acute myocardial infarction. Circulation. 1998; 97:765-772. [DOI] [PubMed] [Google Scholar]
- 27.Fishbein MC, Maclean D, Maroko PR. Experimental myocardial infarction in the rat: qualitative and quantitative changes during pathologic evolution. Am J Pathol. 1978; 90:57-70. [PMC free article] [PubMed] [Google Scholar]
- 28.Wayman NS, McDonald MC, Chatterjee PK, Thiemermann C. Models of coronary artery occlusion and reperfusion for the discovery of novel antiischemic and antiinflammatory drugs for the heart. Methods Mol Biol. 2003; 225:199-208. [DOI] [PubMed] [Google Scholar]
- 29.Chimenti S, Carlo E, Masson S, Bai A, Latini R. Myocardial infarction: animal models. Methods Mol Med. 2004; 98:217-226. [DOI] [PubMed] [Google Scholar]
- 30.Schelbert EB, Hsu L, Anderson SA, Mohanty BD, Karim SM, Kellman P, Aletras AH, Arai AE. Late gadolinium enhancement cardiac magnetic resonance identifies post infarction myocardial fibrosis and the border zone at the near cellular level in ex vivo rat hearts. Circ Cardiovasc Imaging. 2010; 3:743-752. [DOI] [PMC free article] [PubMed] [Google Scholar]
- 31.Kellman P, Aletras AH, Mancini C, McVeigh ER, Arai AE. T2‐prepared SSFP improves diagnostic confidence in edema imaging in acute myocardial infarction compared to turbo spin echo. Magn Reson Med. 2007; 57:891-897. [DOI] [PMC free article] [PubMed] [Google Scholar]
- 32.Aletras AH, Kellman P, Derbyshire JA, Arai AE. Acute TSE‐SSFP: A hybrid method for T2‐weighted imaging of edema in the heart. Magn Reson Med. 2008; 59:229-235. [DOI] [PubMed] [Google Scholar]
- 33.Ugander M, Bagi PS, Oki AJ, Chen B, Hsu L‐Y, Aletras AH, Shah S, Greiser A, Kellman P, Arai AE. Myocardial edema as detected by pre‐contrast T1 and T2 CMR delineates area at risk associated with acute myocardial infarction. JACC Cardiovasc Imaging. 2012; 5:596-603. [DOI] [PMC free article] [PubMed] [Google Scholar]
- 34.Masci PG, Andreini D, Francone M, Bertella E, De Luca L, Coceani M, Mushtaq S, Mariani M, Carbone I, Pontone G, Agati L, Bogaert J, Lombardi M. Prodromal angina is associated with myocardial salvage in acute ST‐segment elevation myocardial infarction. Eur Heart J Cardiovasc Imaging. 2013; 14:1041-1048. [DOI] [PubMed] [Google Scholar]
- 35.Thuny F, Lairez O, Roubille F, Mewton N, Rioufol G, Sportouch C, Sanchez I, Bergerot C, Thibault H, Cung TT, Finet G, Argaud L, Revel D, Derumeaux G, Bonnefoy‐Cudraz E, Elbaz M, Piot C, Ovize M, Croisille P. Post‐conditioning reduces infarct size and edema in patients with ST‐segment elevation myocardial infarction. J Am Coll Cardiol. 2012; 59:2175-2181. [DOI] [PubMed] [Google Scholar]
Associated Data
This section collects any data citations, data availability statements, or supplementary materials included in this article.
Supplementary Materials
Appendix 1 Supplementary Movie S1.
Appendix 2 Supplementary Movie S2.
Appendix 3 Legends to supplementary movies S1 and S2.


