

Abstract
Background
Stroke is a leading cause of death and long‐term disability in the United States. There is a well‐documented association between ambient particulate matter air pollution (PM) and cardiovascular disease morbidity and mortality. Given the pathophysiologic mechanisms of these effects, short‐term elevations in PM may also increase the risk of ischemic and/or hemorrhagic stroke morbidity and mortality, but the evidence has not been systematically reviewed.
Methods and Results
We provide a comprehensive review of all observational human studies (January 1966 to January 2014) on the association between short‐term changes in ambient PM levels and cerebrovascular events. We also performed meta‐analyses to evaluate the evidence for an association between each PM size fraction (PM2.5, PM10, PM2.5‐10) and each outcome (total cerebrovascular disease, ischemic stroke/transient ischemic attack, hemorrhagic stroke) separately for mortality and hospital admission. We used a random‐effects model to estimate the summary percent change in relative risk of the outcome per 10‐μg/m3 increase in PM.
Conclusions
We found that PM2.5 and PM10 are associated with a 1.4% (95% CI 0.9% to 1.9%) and 0.5% (95% CI 0.3% to 0.7%) higher total cerebrovascular disease mortality, respectively, with evidence of inconsistent, nonsignificant associations for hospital admission for total cerebrovascular disease or ischemic or hemorrhagic stroke. Current limited evidence does not suggest an association between PM2.5‐10 and cerebrovascular mortality or morbidity. We discuss the potential sources of variability in results across studies, highlight some observations, and identify gaps in literature and make recommendations for future studies.
Keywords: air pollution, cerebrovascular disease, meta‐analysis, particulate matter, stroke
Introduction
Stroke is a leading cause of death and long‐term disability in the United States.1 An estimated 795 000 Americans experience a new or recurrent stroke, resulting in >135 000 deaths and >829 000 hospital admissions per year.2 Direct and indirect costs for stroke in 2008 are estimated at >$65 billion in the United States.3 Because of the large proportion of stroke survivors with long‐term disability, the true cost due to diminished productivity and reduced quality of life among disabled survivors of stroke and their caregivers is likely even greater. Therefore, identifying modifiable risk factors for stroke is of significant public health interest.
A large body of literature shows that short‐term increases (ie, over hours to days) in ambient particulate matter (PM) are associated with higher risk of cardiovascular morbidity and mortality4–10 and triggering of myocardial infarction,11–12 arrhythmias,13–15 and heart failure exacerbations.16–18 The effects of short‐term exposure are thought to be mediated through a combination of autonomic, hemostatic, inflammatory, and vascular endothelial disturbances with consequent changes in cardiac and vascular function.19–30
Given the putative pathophysiologic mechanisms thought to underlie these effects, it is plausible that transient elevations in PM could similarly increase the risk of stroke. Specifically, acute PM‐related changes in blood pressure, vascular function, atherosclerotic plaque stability, and hemostatic balance could increase the risk of atherothrombotic strokes; acute elevations in blood pressure or vascular endothelial activation could trigger small vessel (lacunar) strokes; episodes of atrial fibrillation could lead to increased risk of cardioembolic stroke; and transient elevations in arterial blood pressure could increase the risk of cerebral hemorrhage.31 However, relatively fewer studies have evaluated this hypothesis and the results have been inconsistent, with some,32–35 but not other,36–40 studies finding evidence of a positive association.
The evidence linking short‐term changes in ambient PM to the risk of stroke morbidity or mortality has not been systematically reviewed. Accordingly, our aim is to provide a comprehensive review and meta‐analysis of the association between short‐term changes in ambient PM levels and risk of stroke morbidity and mortality.
Methods
Search Strategy and Data Abstraction
We searched PubMed, Web of Knowledge, and Embase databases to identify all observational human studies, published in English from January 1966 to January 2014, evaluating the relationship between short‐term changes in ambient PM levels and hospital admissions, emergency department visits, or deaths for stroke or cerebrovascular disease, using the terms “particulate matter” or “particle” in combination with “stroke” or “cerebrovascular disease.” We also retrieved additional studies from the references of these articles to identify studies not captured by the initial search.
The initial study selection was based on the examination of the titles and/or abstracts among all the identified articles. The full texts of all potentially relevant articles were further reviewed. Studies were included in the meta‐analysis if they examined the association of fine PM (PM2.5, PM with aerodynamic diameter <2.5 μm), respirable PM (PM10, PM with aerodynamic diameter <10 μm), or coarse PM (PM2.5‐10, PM with aerodynamic diameter between 10 and 2.5 μm) 0 to 4 days before the event with total cerebrovascular disease, ischemic stroke, transient ischemic attack, or hemorrhagic stroke. We excluded from review any studies that did not report point estimates or 95% CIs, and those where the outcome reflected a composite end point of stroke and other diseases (eg, International Classification of Diseases, Ninth Revision [ICD‐9]: 430 to 448 or diagnosis related group [DRG] 14 to 17, 22).
Two reviewers independently abstracted data from each article, including study population (geographic location, age, sex), study design, outcome definition, outcome assessment (death certificate, administrative data, medical records), PM size fractions and average exposure levels, available lags considered, and measures of association. For each study we abstracted results for all outcomes, PM size fractions, and/or lagged exposures reported. All discrepancies regarding study eligibility or details were resolved by consensus between the reviewers.
Statistical Analyses
We separately evaluated the evidence for or against an association between each PM size fraction (PM2.5, PM10, PM2.5‐10), each outcome (total cerebrovascular disease, ischemic stroke/transient ischemic attack, hemorrhagic stroke), and separately for mortality and hospital admission, yielding a total of 3×3×2=18 potential separate analyses. For each analysis, we used a DerSimonian and Laird random‐effects model to estimate the summary percent change in relative risk of the outcome per 10‐μg/m3 increase in PM. When results from both single‐ and multi‐pollutant models were available, we included only results from single‐pollutant models. If effect estimates were reported for several different lag periods, we selected the available lag emphasized by the study authors or the lag most commonly evaluated among studies in that category. In addition, when effect estimates were reported for multiple cities, seasons (warm/cold) or temperatures (high/low), we selected an overall effect estimate derived from all cities, seasons, or temperatures. If no overall effect estimate was reported for individual seasons41 or nonoverlapping temperature ranges,42–43 we included effect estimates for each season or temperature range. When effect estimates were reported for multiple age groups (eg, 65+, 45+, or all ages), we selected the age group with the most events.
We assessed publication bias by performing Egger regression test for funnel asymmetry in addition to visual inspection of the funnel plots. If there was evidence of publication bias, we additionally applied trim and fill methods to adjust for publication bias.44 We assessed the heterogeneity across studies by computing a P value based on the Cochran's Q statistic, although this statistic has low power when the sample size is small. We also calculated the I2 statistic, the percentage of variation across studies explained by heterogeneity rather than chance. Unlike the Q statistics, the I2 statistics is not inherently dependent on sample size and is more intuitive.
Sensitivity Analyses
We performed sensitivity analyses pooling effect estimates of the same lag group reported in individual studies or by geographic locations (Europe, East Asia, Latin America, North America, and Australia). We also performed sensitivity analyses excluding studies that defined cerebrovascular disease using a subset of ICD codes (eg, ICD‐10: 60 to 61, 63 to 64), as opposed to the broader definition of ICD‐10: 60 to 69 in other studies for the same category or excluding studies using administrative records in case ascertainment, as opposed to medical review performed in stroke registry.
All analyses were performed using “metafor” package in R statistical software (R v2.13). A 2‐sided P value of <0.05 was considered statistically significant.
Results
In our initial literature search, we identified 480 human observational studies potentially eligible for inclusion. After reviewing the titles, abstracts, and full texts, there were 60 studies that were potentially eligible for review and meta‐analysis (Figure 1). We excluded 15 of these studies because they did not report point estimates or confidence intervals, defined the outcome very broadly, and or reported results for a PM size fraction other than PM2.5, PM10, or PM2.5‐10.
Figure 1.
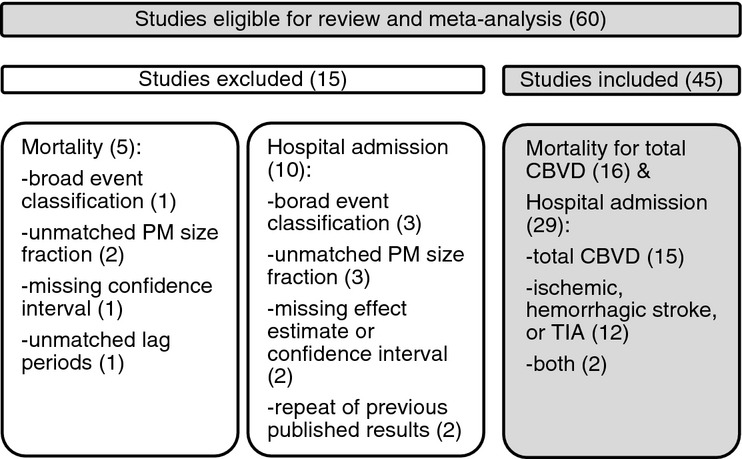
Search strategy and rationale for excluding 15 studies. CBVD indicates cerebrovascular disease; PM, particulate matter; TIA, transient ischemic attack.
Thus, this review and meta‐analysis consisted of 45 studies reporting point estimates and 95% CIs for the association between short‐term exposures to PM2.5, PM10, or PM2.5‐10 and hospitalization or mortality for total cerebrovascular diseases, ischemic stroke, or hemorrhagic stroke (Figure 1). Of these studies, 17 studies (Table 1) reported on hospital admissions for total cerebrovascular disease,8,32–33,32–36,39,45–56 14 studies (Table 1) reported on hospital admissions for ischemic or hemorrhagic stroke,32,34,37,40,42,54,57–63 and 16 studies (Table 2) reported on mortality for total cerebrovascular disease.41,43,64–77
Table 1.
Description of 29 Studies of Associations Between Short‐term Exposure to PM and Hospital Admission for CBVD or Ischemic or Hemorrhagic Stroke
| Source | Location | Design | Outcome/Number of Daily Events | Outcome Source | N | Age (y) | Mean Exposure Level (μg/m3) | Lag (d) | % Change in Observed Effect (95% CI) * |
|---|---|---|---|---|---|---|---|---|---|
| PM2.5 | |||||||||
| Dominici et al33 | 204 urban counties, US | T | CBVD (ICD‐9: 430 to 438)/5.4 | A | 11.5 million | 75+, 65 to 74, 65+ | 13.4 | 0 | 0.8% (0.3% to 1.3%) to 2.1% (0.6% to 3.6%) |
| Lisabeth et al34 | Nueces County, TX | T | Ischemic stroke and TIA/2 | M | 3508 | 45+ | 7 | 0, 1 | 6.0% (−1.7% to 14.2%) |
| Delfino et al35 | Southern CA, US | T | CBVD (ICD‐9: 430 to 438)/NA | A | 10 438 | 45+ | NA | NA | 1.9% (0.3% to 3.5%) |
| Peng et al56 | 108 urban counties, US | T | CBVD (ICD‐9: 430 to 438)/NA | A | NA | 75+, 65 to 74, 65+ | 13.5 | 0, 1, 2 | NA |
| O'Donnell et al40 | Ontario, Canada | C | Ischemic stroke and TIA (TOAST)/NA | M | 9202 | All ages | 6.9 | 0–1 | −0.7% (−6.2% to 5.1%) |
| Wellenius et al59 | Boston, MA | C | Ischemic stroke/NA | M | 1705 | 21+ | NA | 0 | 17.7% (4.2% to 33.0%) |
| PM10 | |||||||||
| Wong et al46 | Hong Kong | T | CBVD (ICD‐9: 430 to 438)/NA | A | NA | All ages | 44.99 | 2 | 0.3% (−0.4% to 1.0%) |
| Wordley et al47 | Bringmingham, England | T | CBVD (ICD‐9: 430 to 436)/6.6 | A | NA | All ages | 25.6 | 0 | 2.1% (0.1% to 4.1%) |
| Le Tertre et al45 | Eight cities, Europe | T | CBVD (ICD‐9: 430 to 438)/NA | A | NA | 65+ | NA | 0–1 | 0% (−0.3% to 0.3%) |
| Tsai et al42 | Kaohsiung, Taiwan | C | Ischemic stroke (ICD‐9: 433 to 435)/8.73 | A | 12 758 | All ages | 78.82 | 0–2 | −0.5% (−6.2% to 5.7%), 5.9% (4.3% to 7.4%) |
| Wellenius et al63 | 9 cities, US | C | Ischemic stroke/NA | A | 155 503 | 65+ | 28.36 | 0 | 0.4% (0% to 0.9%) |
| Hemorrhage/NA | 19 314 | 65+ | 28.36 | 0 | −0.3% (−2.4% to 2.0%) | ||||
| Henrotin et al58 | Dijon, France | C | Ischemic stroke (TOAST)/NA | M | 762 | 40+ | 21.1 | 0, 1, 2, 3 | −4.0% (−11.0% to 3.6%) to 1.1% (−6.6% to 9.4%) |
| Hemorrhage (TOAST)/NA | 99 | 40+ | 21.1 | 0, 1, 2, 3 | −9.9% (−26.9% to 11.1%) to 10% (−9.6% to 33.9%) | ||||
| Larrieu et al8 | Eight cities, France | T | Stroke (ICD‐10: 60 to 64, G45 to 46)/34.4 | A | 11 105 389 | All ages | 21.0 to 28.9 | 0–1 | 0.2% (−1.5% to 1.9%) |
| Stroke (ICD‐10: 60 to 64, G45 to 46)/24.9 | 11 105 389 | 65+ | 21.0 to 28.9 | 0–1 | 0.8% (−0.9% to 2.5%) | ||||
| Vidale et al60 | Como, Italy | T | Ischemic stroke/0.73 | M | 759 | All | NA | 0, 1, 2, 3, 4, 5 | NA |
| Andersen et al57 | Copenhagen, Denmark | C | Ischemic stroke (SSS)/NA | M | 6798 | All ages | 27.1 | 0, 1, 2, 3, 4, 0–4 | −3.9% (−11.5% to 6.5%) to 8.7% (−0.9% to 19.3%) |
| Hemorrhage (SSS)/NA | 585 | All ages | 27.1 | 0, 1, 2, 3, 4, 0–4 | −3.9% (−11.6% to 6.5%) to 13.3% (2.3% to 25.5%) | ||||
| Bedata et al62 | Manchester and Liverpool, England | C | Minor stroke+TIA/NA | M | 709 | All | 22.6/20.6 | 0, 1, 2, 3 | −8.8% (−15.6% to 1.3%) to 12.9% (−1.3% to 29.2%) |
| Corea et al54 | Mantua, Italy | C | CBVD/NA | M | 781 | All | NA | 0 | NA |
| Ischemic stroke/NA | 567 | All | NA | 0 | NA | ||||
| Hemorrhage/NA | 106 | All | NA | 0 | NA | ||||
| TIA/NA | 108 | All | NA | 0 | NA | ||||
| Nascimento et al51 | Sao Jose dos Campos, Brazil | T | Stroke (ICD‐10: 60 to 64)/0.8 | A | 407 | All | 24.4 | 0, 1, 2 | 0.5% (−0.4% to 1.4%)to 1.4% (0.5% to 2.3%) |
| Oudin et al55 | Scania, Sweden | C | Ischemic stroke/6 | M | 11 267 | All | 16.3 | 0–1 | NA |
| Zheng et al53 | Lanzhou, China | T | CBVD (ICD‐9: 430 to 438)/6 | A | 28 243 | All | 187.07 | 0, 1, 2, 3, 0–1, 0–2, 0–3 | −0.1% (−0.3% to 0.1%) |
| PM2.5‐10+PM2.5 | |||||||||
| Halonen et al39 | Helsinki, Finland | T | Stroke (ICD‐10: I60 to 61, I63 to 64)/4 | A | 10 383 | 65+ | 9.5 | 0, 1, 2, 3, 0–4 | −2.2% (−5.0% to 0.6%) to 0% (−2.8% to 3.0%) |
| PM10+PM2.5 | |||||||||
| Chan et al32 | Taipei, Taiwan | T | CBVD (ICD‐9: 430 to 437)/1.0 | A | 7341 | 50+ | PM10 (50.2) | 0, 1, 2, 3 | 0% (−1.2% to 1.3%) to 1.2% (0.4% to 1.9%) |
| Stroke (ICD‐9: 430 to 434)/3.5 | 2184 | 50+ | PM2.5 (31.5) | −3.6% (−8.9% to 2.1%) to 1.1% (0.3% to 1.9%) | |||||
| Ischemic stroke (ICD‐9: 433 to 434)/0.7 | 1494 | 50+ | PM10 (50.2) | −1.4% (−4.5% to 1.9%) to 0.1% (−3.0% to 3.2%) | |||||
| PM2.5 (31.5) | −6.8% (−3.6% to 0.5%) to −4.1% (−8.6% to 0.5%) | ||||||||
| Hemorrhage (ICD‐9: 430 to 432)/0.3 | 690 | 50+ | PM10 (50.2) | −0.6% (−2.6% to 1.4%) to 1.6% (−0.6% to 3.9%) | |||||
| PM2.5 (31.5) | −2.1% (−5.7% to 1.8%) to 3.0% (−0.6% to 6.6%) | ||||||||
| Jalaludin et al49 | Sydney, Australia | T | CBVD (ICD‐9: 430 to 438)/11.3 | A | NA | 65+ | PM10 (16.8) | 0, 1, 2, 3, 0−1 | −2.6% (−4.9% to −0.3%) to −1.6% (−4.0% to 0.8%) |
| PM2.5 (9.5) | −3.1% (−6.3% to −0.3%) to −2.2% (−5.2% to 0.9%) | ||||||||
| Villeneuve et al37 | Edmonton, Canada | C | Ischemic stroke (ICD‐9: 434, 436)/NA | A | 4850 | 65+ | PM10 (24.2) | 0, 1, 0–2 | −1.3% (−4.3% to 1.9%) to 0% (−3.0% to 3.1%) |
| PM2.5 (8.5) | 0% (−7.5 to 8.1%) to 0% (−6.0% to 6.4%) | ||||||||
| Hemorrahage (ICD‐9: 430, 432)/NA | 2329 | 65+ | PM10 (24.2) | 0.6% (−5.7% to 7.3%) to 1.9% (−4.9% to 9.1%) | |||||
| PM2.5 (8.5) | −1.6% (−14.3% to 13.0%) to 11.3% (−2.1% to 26.6%) | ||||||||
| TIA (ICD‐9: 435)/NA | 4855 | 65+ | PM10 (24.2) | −3.8% (−8.0% to 0.6%) to −0.6% (−4.2% to 3.1%) | |||||
| Bell et al48 | Taipei, Taiwan | T | CBVD (ICD‐9: 430 to 437)/3.9 | A | 11 466 | All ages | PM10 (49.1) | 0, 1, 2, 3, 0–3 | −0.7% (−1.6% to 0.1%) to 0.9% (0.1% to 1.8%) |
| PM2.5 (31.6) | −0.7% (−2.8% to 1.4%) to 0.6% (−0.7% to 1.9%) | ||||||||
| PM2.5 (8.5) | −6.3% (−16.2% to 4.8%) to −1.6% (−9.0% to 6.4%) | ||||||||
| Mechtouff et al61 | Lyon, France | C | Ischemic stroke/1.8 | M | 376 | All | PM10 (31.6) | 0–1, 0–2, 0–3, 0–4 | −3.9% (−13.0% to 6.3%) |
| PM2.5 (23.8) | −2.9% (−15.6% to 11.5%) | ||||||||
| PM10+PM2.5‐10+PM2.5 | |||||||||
| Lippmann et al50 | Detroit, US | T | Stroke (ICD‐9: 431 to 437)/13 | A | NA | 65+ | PM10 (31) | 0, 1 | 0.9% (−1.1% to 3.0%) |
| PM2.5 (18) | 0.7% (−2.2% to 3.7%) | ||||||||
| PM2.5‐10 (13) | 1.9% (−1.9% to 5.9%) | ||||||||
| Anderson et al36 | Midland area, England | T | CBVD (ICD‐9: 430 to 438)/NA | M | NA | 65+ | PM10 (23.3) | 0–1 | −1.4% (−3.3% to 0.6%), |
| PM2.5 (14.5) | −0.9% (−3.7% to 2.0%), | ||||||||
| PM2.5‐10 (14.6) | 6.0% (−1.7% to 14.2%) | ||||||||
| Alessandrini et al52 | Rome, Italy | T | CBVD (ICD‐9: 430 to 438)/NA | A | 26 557 | 35+ | PM10 (37) | 0 | 0.5% (−1.2% to 2.1%) |
| PM2.5 (23.4) | 1.1% (−1.8% to 4.2%) | ||||||||
| PM2.5‐10 (14.6) | −2.2% (−4.4% to 0%) | ||||||||
A indicates administrative records; C, case‐crossover; CBVD, cerebrovascular disease; M, medical record review; PM, particulate matter; T, time‐series.
Per 10 μg/m3 increase in pollutant levels.
Table 2.
Description of 16 Studies of Associations Between Short‐term Exposure to PM and Mortality for CBVD Mortality Based on Death Certificate
| Source | Location | Design | Outcome | Daily Number of Events | N | Age (y) | Mean Exposure Level (μg/m3) | Lag (d) | % Change in Observed Effect (95% CI) * |
|---|---|---|---|---|---|---|---|---|---|
| PM2.5 | |||||||||
| Franklin et al71 | 27 communities, US | C | CBVD (ICD‐9: 430 to 438) | NA | 95 687 | All ages | 15.7 | 0, 1, 0–1 | 1.0% (0% to 2.0%) |
| Yorifuji et al72 | Tokyo, Japan | T | CBVD (ICD‐10: 60 to 61, 63, 69.0 to 69.3) | 19.7 | 41 440 | All ages | 21.6 | 0, 1, 2, 0–1, 0–2 | −0.2% (−1.2% to 0.8%) to 1.3% (0.2% to 2.4%) |
| Subarachnoid hemorrhage (ICD‐10: 60, 69.3) | 2.4 | 0.9% (−1.9% to 3.8%) to 4.3% (0.4% to 8.4%) | |||||||
| Intracerebral hemorrhage (ICD‐10: 61, 69.1) | 5.6 | −1.4% (−3.4% to 0.6%) to 1.2% (−0.9% to 3.3%) | |||||||
| Ischemic stroke (ICD‐10: 63, 69.3) | 11.7 | −0.3% (−1.7% to 1.1%) to 1.4% (0% to 2.8%) | |||||||
| PM10 | |||||||||
| Hong et al64 | Seoul, Korea | T | CBVD (ICD‐10: 60 to 69) | 15.3 | NA | All ages, 65+, 65− | 71.1 | 0 | 0% (−1.7% to 1.6%) to 1.0% (−0.3% to 2.2%) |
| Wong et al69 | Hong Kong, China | T | CBVD (ICD‐9: 430 to 438) | NA | NA | All ages | 9 | 2 | 0.7% (−0.2% to 1.6%) |
| Kan et al65 | Shanghai, China | T | CBVD (ICD‐9: 430 to 438) | 3.3 | 2426 | All ages | 97 | 1 | 0.8% (0% to 1.6%) |
| Kim et al66 | Seoul, Korea | T | CBVD (ICD‐10: 60 to 69) | 15 | NA | All ages | 69.2 | 0, 1, 2 | 0.6% (0.1% to 1.0%) to 0.7% (0.2% to 1.2%) |
| Qian et al67 | Wuhan, China | T | CBVD (ICD‐9: 430 to 438) | 14 | 20 409 | 65+ | 141.8 | 0, 1, 0–1, 0–4 | 0.3% (−0.2% to 0.8%) to 0.6% (0.3% to 0.9%) |
| Kettunen et al41 | Helsinki, Finland | T | CBVD (ICD‐10: 60 to 61, 63 to 64) | NA | 3265 | 65+ | 16.3 | 1 | −5.9% (−11.9% to 0.5%) to 13.3% (2.3% to 25.5%) |
| Revich and Shaposhnikov 68 | Moscow, Russia | T | CBVD (ICD‐10: 60 to 69) | 68.8 | NA | All ages | 34 | 0 | 0.5% (0% to 0.9%) to 0.7% (0.1% to 1.3%) |
| CBVD (ICD‐10: 60 to 69) | 41 | NA | 75+ | 34 | 0 | ||||
| Li et al43 | Tianjin, China | T | CBVD (ICD‐9: 60 to 69) | 21.5 | 111 087 | 65+ | 95 | 0–1 | −0.6% (−2.0% to 0.8%) to 1.0% (0.3% to 1.7%) |
| Romieu et al76 | Multicities,Latin America | T | CBVD (ICD‐10: 60 to 69) | 0.7 to 14.99 | 263 to 43 805 | All | 29.6 to 78.4 | 0–3 | 0.2% (−1.6% to 2.1%) to 2.6% (0.8% to 4.5%) |
| Diaz et al74 | Madrid, Spain | C | CBVD (ICD‐10: 60 to 69) | 4.3 | NA | All | 31.4 | 0, 1, 2, 3, 4 | 1.8% (−0.4% to 4.0%) |
| PM2.5‐10 | |||||||||
| Perez et al73 | Barcelona, Spain | C | CBVD (ICD‐10: 60 to 69) | 3 | 3269 | All ages | 14 | 1, 2, 0–1 | −0.1% (−1.2% to 1.0%) to 8.7% (1.8% to 16.1%) |
| Perez et al75 | Barcelona, Spain | C | CBVD (ICD‐10: 60 to 69) | 3.2 | 1375 | All | 13.5 | 1, 2 | 3.5% (−0.6% to 7.9%) |
| PM2.5+PM10 | |||||||||
| Faustini et al77 | Rome, Italy | C | CBVD (ICD‐9: 430 to 438) | 3.6, 14.5 | 15 884, 8 552 785 | All | PM10 (36.4), PM2.5 (20.2) | 0, 1, 2, 3, 4, 5, 0–1, 2–5, 0–5 | 0.6% (−0.7% to 1.9%) to 1.4% (−0.1% to 2.8%) |
| PM2.5+PM2.5‐10 | |||||||||
| Zanobetti and Schwartz 70 | 112 cities, US | T | CBVD (ICD‐10: 60 to 69) | 11.7 | 330 613 | All | NA | 0–1 0–2 | 1.0% (0% to 2.0%) 1.8% (0.9% to 2.6%) |
C indicates case‐crossover; CBVD, cerebrovascular disease; PM, particulate matter; T, time‐series.
Per 10‐μg/m3 increase in pollutant levels.
Studies were conducted in Europe (n=20), East Asia (n=12), North America (n=11), Australia (n=1), and Latin America (n=1), using either time‐series (n=29) or case‐crossover (n=16) study designs. Mean PM levels reported in the studies varied widely for PM2.5 (range 5.0 to 31.6 μg/m3), PM10 (6.9 to 187.1 μg/m3), and PM2.5‐10 (7.5 to 14.6 μg/m3). In mortality studies, mortality was ascertained based on death certificates from local, regional, and national public health agencies. Hospital admission events were ascertained based on administrative/billing data, emergency department logs, or review of medical records or from existing stroke registries. The lag periods considered included single‐day lags (lag 0, 1, 2, 3, 4) and cumulative lags up to 4 days (ie, 1‐ to 4‐day moving average) before the event.
PM2.5 and Hospital Admission
Total cerebrovascular disease
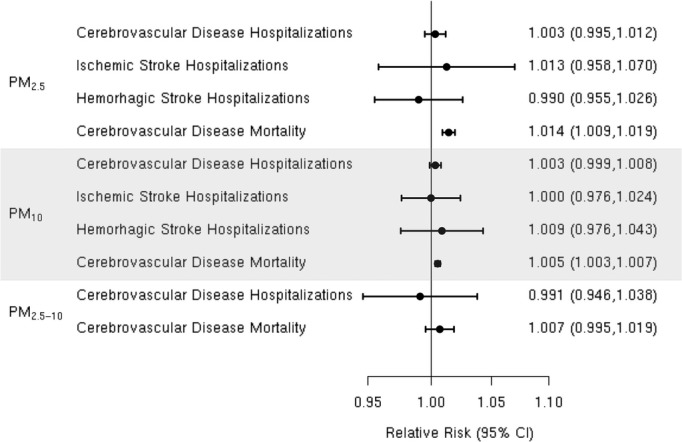
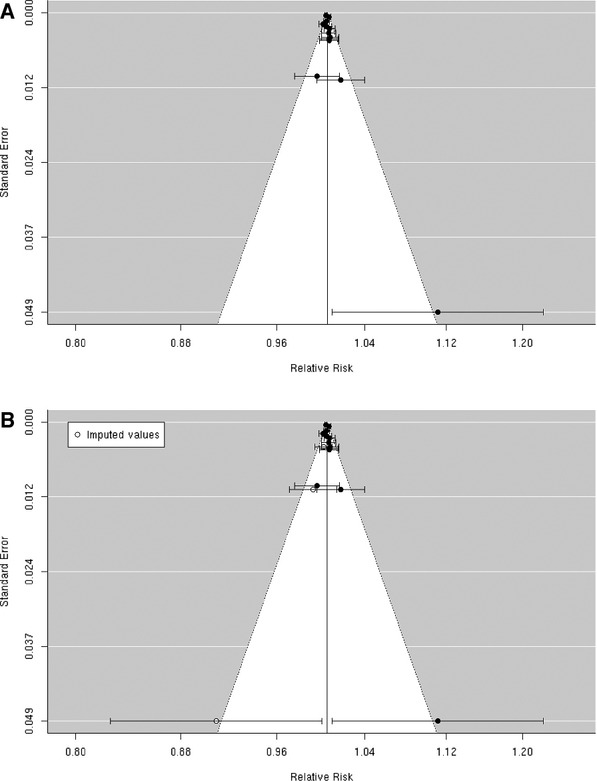
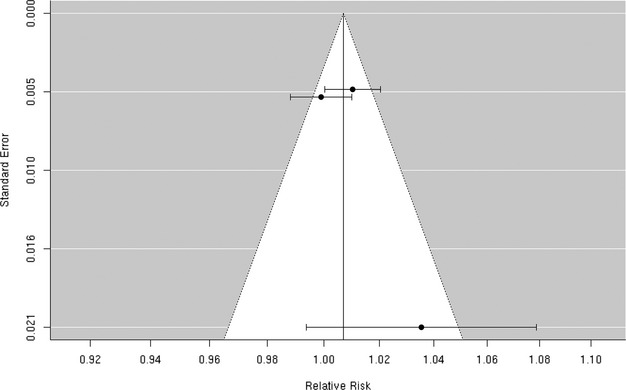
A random‐effects summary estimate of the association between PM2.5 and hospital admission for total cerebrovascular disease suggests a nonsignificant 0.3% (95% CI −0.5% to 1.2%) higher risk of hospitalization for total cerebrovascular disease per 10‐μg/m3 increase in PM2.5 (Figure 2). These studies were significantly heterogeneous (I2=64.16%, P=0.04). The largest study was Dominici et al,33 which evaluated this association among 11.5 million Medicare beneficiaries aged ≥65 years residing in 204 US urban counties. The authors found a statistically significant 0.8% (95% CI 0.3% to 1.3%) higher risk of hospital admission for total cerebrovascular disease per 10‐μg/m3 increase in PM2.5. An additional 8 studies evaluated this association in diverse populations, with 4 reporting a positive association and 4 reporting a negative association between PM2.5 and risk of hospitalization for total cerebrovascular disease (Figure 3). We found that the association between PM2.5 and hospital admission for total cerebrovascular disease varied by geographic locations, with East Asia and North America showing statistically significant positive associations (Table 3). Sensitivity analyses pooling point estimates by individual lag subgroups (lag 0, lag 1, lag 2, lag 3 and lag 0 to lag 1) did not materially change the results (Table 3). The results did not materially change when excluding studies that defined hospital admissions using ICD‐10: 60 to 61, 63 to 6439 as opposed to ICD‐10: 60 to 69 as used in all other studies (Table 3). We observed evidence suggestive of publication bias (Egger regression test, P=0.02; Figure 4A). When we applied trim and fill methods (estimated 4 studies missing) to adjust for publication bias, such evidence disappeared (Egger regression test, P=0.95; Figure 4B), but these studies remained heterogeneous (I2=79.55%, P=0.001).
Figure 2.
Summary relative risk (95% CI) for the associations between short‐term exposure to particulate matter PM2.5, PM10, and PM2.5‐10 morality and hospitalization for cerebrovascular disease (CBVD) and hospitalization for ischemic or hemorrhagic stroke.
Figure 3.
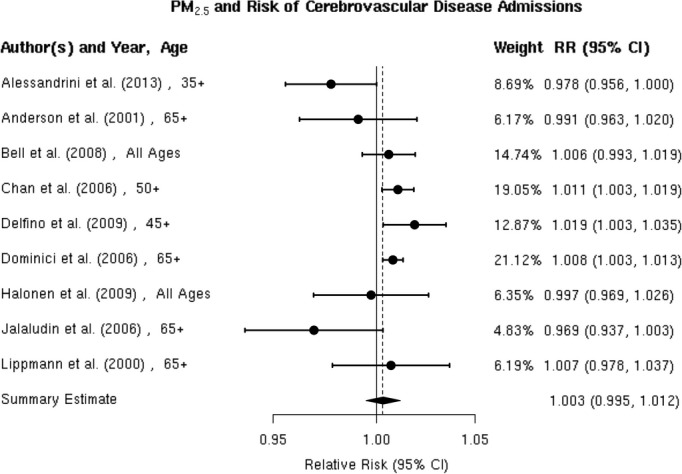
Individual study relative risk (95% CI) for the association between particulate matter PM2.5 and hospital admissions for cerebrovascular disease (CBVD).32–33,32–36,39,48–50,52
Table 3.
Sensitivity Analyses of Summary Relative Risk (95% CI) for the Associations of Particulate Matter (PM) With Cerebrovascular Disease (CBVD), Ischemic Stroke (IS), or Hemorrhagic Stroke (HS)
| Analysis | PM2.5 | PM10 | ||
|---|---|---|---|---|
| Studies Included | Effect Estimate (95% CI) | Studies Included | Effect Estimate (95% CI) | |
| Studies by individual lag subgroups | ||||
| Hospital admission (CBVD) | ||||
| Lag 0 | 32–33,39,48–50 | 1.000 (0.988 to 1.013) | 32,47,49,51 | 1.001 (0.989 to 1.013) |
| Lag 1 | 32,48–49 | 0.997 (0.989 to 1.006) | 32,48–51,53 | 0.999 (0.997 to 1.001) |
| Lag 2 | 32,48–49 | 1.001 (0.990 to 1.011) | 32,46,48–49,51,53 | 1.000 (0.999 to 1.007) |
| Lag 3 | 32,48–49 | 1.002 (0.984 to 1.020) | 32,48–49,53 | 1.002 (0.994 to 1.010) |
| Lag 0–1 | 35–36,49 | 0.999 (0.973 to 1.025) | 8,36,45,49,53 | 0.996 (0.996 to 1.002) |
| Hospital admission (IS) | ||||
| Lag 0 | 32,34,37,59 | 1.066 (0.929 to 1.223) | 32,37,57–58,57–63 | 0.994 (0.980 to 1.008) |
| Lag 1 | 32,34,37 | 1.016 (0.890 to 1.160) | 32,37,57–58,62 | 1.007 (0.992 to 1.022) |
| Lag 2 | — | — | 32,57–58,62 | 1.000 (0.973 to 1.027) |
| Lag 3 | — | — | 32,57–58,62 | 1.001 (0.984 to 1.017) |
| Hospital admission (HS) | ||||
| Lag 0 | 32,37 | 0.990 (0.955 to 1.026) | 32,37,58 | 0.995 (0.981 to 1.010) |
| Lag 1 | 32,37 | 1.035 (0.934 to 1.147) | 32,37,58 | 0.999 (0.980 to 1.019) |
| Lag 2 | — | — | 32,58 | 0.997 (0.977 to 1.017) |
| Lag 3 | — | — | 32,58 | 1.016 (0.994 to 1.039) |
| Mortality (CBVD) | ||||
| Lag 0 | 41,71–72 | 1.011 (1.002 to 1.019) | 41,64,66–68 | 1.006 (1.004 to 1.009) |
| Lag 1 | 41,71–72 | 1.006 (0.995 to 1.017) | 41,65–67 | 1.007 (1.003 to 1.011) |
| Lag 2 | — | — | 41,66,69,72 | 1.004 (1.000 to 1.008) |
| Lag 0–1 | 70–72 | 1.012 (1.004 to 1.019) | — | — |
| Excluding studies using a subset of ICD‐10 codes to define CBVD | ||||
| Hospital admission | 32,36,45–50 | 1.002 (0.995 to 1.009) | 32–33,32–36,32–50 | 1.006 (0.994 to 1.017) |
| Mortality | 43,64–69 | 1.004 (1.000 to 1.008) | 71–72 | 1.015 (1.007 to 1.022) |
| Excluding studies using administrative data for case ascertainment | ||||
| Hospital admission (IS) | 57–58 | 0.994 (0.967 to 1.022) | 34,40,59,62 | 0.972 (0.927 to 1.018) |
| Studies by geographic locations | ||||
| Hospital admission (CBVD) | ||||
| Europe | 39,52,57 | 0.987 (0.972 to 1.002) | 8,45,47,52,57 | 1.003 (0.995 to 1.011) |
| East Asia | 32,48 | 1.009 (1.003 to 1.016) | 32,46,48,53 | 1.002 (0.996 to 1.009) |
| Latin America | — | — | 51 | 1.014 (1.005 to 1.023) |
| North America | 33,35,50 | 1.010 (1.003 to 1.017) | 50 | 1.009 (0.989 to 1.008) |
| Australia | 49 | 0.969 (0.937 to 1.003) | 49 | 0.984 (0.960 to 1.008) |
| Hospital admission (IS) | ||||
| Europe | 61 | 0.971 (0.846 to 1.115) | 52,57–58,62 | 0.977 (0.931 to 1.025) |
| East Asia | 32 | 0.932 (0.864 to 1.005) | 32,42 | 1.017 (0.969 to 1.067) |
| Latin America | — | — | — | — |
| North America | 34,37,40,59 | 1.039 (0.977 to 1.104) | 37,63 | 1.003 (0.994 to 1.012) |
| Australia | — | — | — | — |
| Hospital admission (HS) | ||||
| Europe | — | — | 58 | 0.901 (0.731 to 1.111) |
| East Asia | 32 | 0.990 (0.954 to 1.028) | 32,42 | 1.016 (0.960 to 1.075) |
| Latin America | — | — | — | — |
| North America | 37 | 0.984 (0.857 to 1.130) | 37,63 | 0.998 (0.978 to 1.019) |
| Australia | — | — | — | — |
| Mortality (CBVD) | ||||
| Europe | 41,77 | 1.014 (1.000 to 1.028) | 41,68,74,77 | 1.005 (1.001 to 1.009) |
| East Asia | 72 | 1.013 (1.002 to 1.024) | 43,64–67,69 | 1.005 (1.003 to 1.008) |
| Latin America | — | — | 76 | 1.004 (1.003 to 1.005) |
| North America | 70–71 | 1.015 (1.007 to 1.022) | — | — |
| Australia | — | — | — | — |
Figure 4.
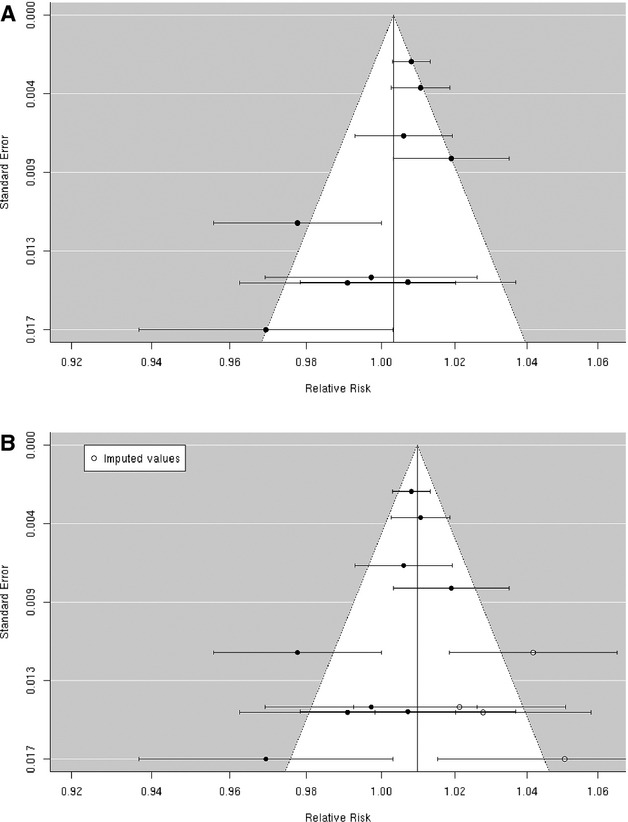
A, Funnel plot of individual study relative risk (95% CI) for the association between particulate matter PM2.5 and hospital admissions for cerebrovascular disease (CBVD); (B) after applying trim and fill methods to adjust for publication bias.
Ischemic stroke
We reviewed 6 studies evaluating the association between PM2.5 and risk of ischemic stroke hospitalization.32,34,37,40,59,61 Chan et al and Villeneuve et al assessed ischemic stroke based on administrative records. Lisabeth et al used population‐based stroke surveillance data from the BASIC (Brain Attack Surveillance in Corpus Christi) Project. O'Donnell et al used data from a stroke registry in Ontario, Canada, and Wellenius et al, and Mechtouff et al conducted a detailed medical record review of patients hospitalized with acute ischemic stroke. Lisabeth et al and Wellenius et al reported positive associations between PM2.5 and ischemic stroke hospitalization, while the remaining studies found either no association37 or a negative association32,40,61 (Figure 5). A random‐effects summary estimate suggests a nonsignificant 1.3% (95% CI −4.2% to 7.0%) higher risk of ischemic stroke hospitalization per 10‐μg/m3 increase in PM2.5 (Figure 2). These studies were significantly heterogeneous (I2=64.41%, P=0.03), and there was no evidence of publication bias (Egger regression test, P=0.39; Figure 6). Results were qualitatively similar in sensitivity analyses by individual lag subgroups or when excluding studies using administrative records in case ascertainment (Table 3). The associations did not vary by geographic locations (Table 3).
Figure 5.
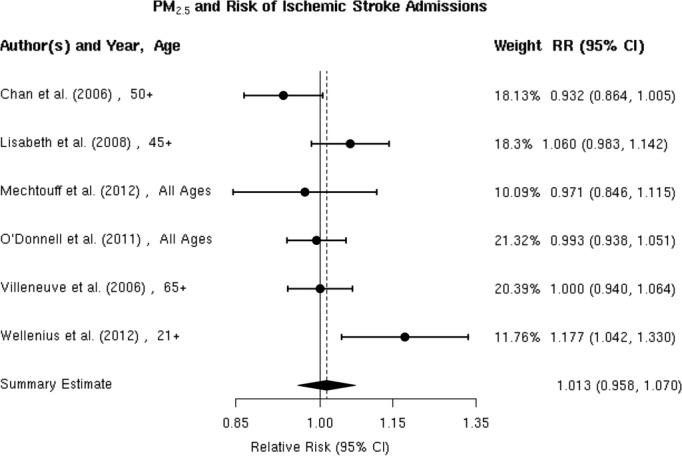
Individual study relative risk (95% CI) for the association between particulate matter PM2.5 and hospital admissions for ischemic stroke.32,34,37,40,59,61
Figure 6.

Funnel plot of individual study relative risk (95% CI) for the association between particulate matter PM2.5 and hospital admissions for ischemic stroke.
Hemorrhagic stroke
We found only 2 studies that evaluated the association between PM2.5 and the risk of hospitalization for hemorrhagic stroke,32,37 both of which reported no evidence of an association (Figure 7). The random‐effects summary estimate suggests a nonsignificant −1.0% (95% CI −4.5% to 2.6%) lower risk of hospitalization for hemorrhagic stroke per 10‐μg/m3 increase in PM2.5 (Figure 2). There was no evidence of heterogeneity across studies (I2=0, P=0.93), and the Egger regression test statistic for funnel plot symmetry could not be computed due to the small sample size (Figure 8). Sensitivity analyses by individual lag subgroups or geographic locations did not materially change the results (Table 3).
Figure 7.
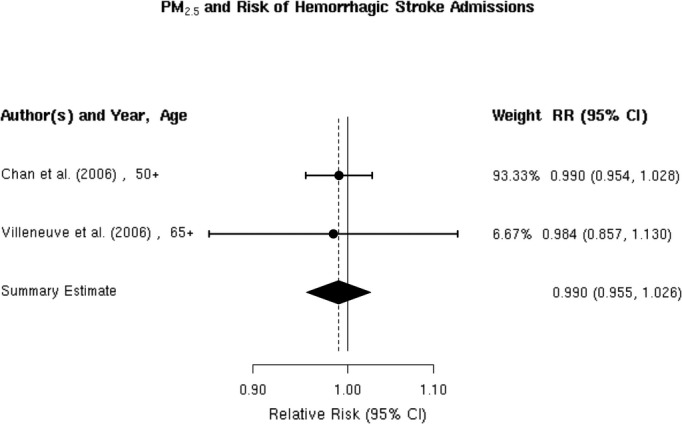
Individual study relative risk (95% CI) for the association between particulate matter PM2.5 and hospital admissions for hemorrhagic stroke.32,37
Figure 8.
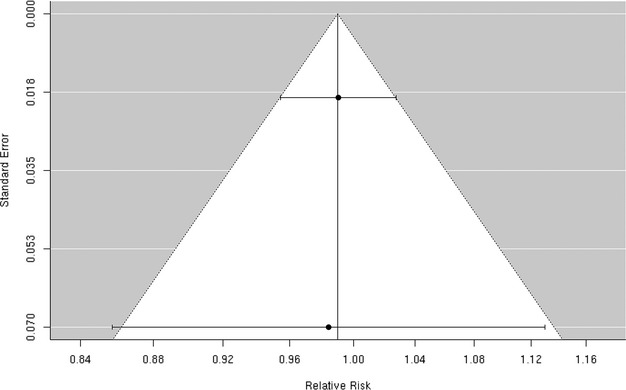
Funnel plot of individual study relative risk (95% CI) for the association between particulate matter PM2.5 and hospital admissions for hemorrhagic stroke.
PM2.5 and Mortality
We reviewed 5 studies41,70–72,77 examining the association between PM2.5 and cerebrovascular mortality, all of which reported a positive association (Figure 9). The random‐effects summary estimate suggests a statistically significant 1.4% (95% CI 0.9% to 1.9%) higher risk of cerebrovascular mortality per 10‐μg/m3 increase in PM2.5 (Figure 2). These studies were homogeneous (I2=6.78%, P=0.28), and we found no evidence suggestive of publication bias (Egger regression test P=0.43; Figure 10). Results did not materially change in sensitivity analyses pooling point estimates by individual lag subgroups or excluding 2 studies that defined total cerebrovascular disease death by ICD‐10: 60 to 61, 63 to 6441 and ICD‐10: 61, 63, and 6972, as opposed to ICD‐10: 60 to 69 used in other studies (Table 3). The associations did not vary by geographic locations (Table 3).
Figure 9.
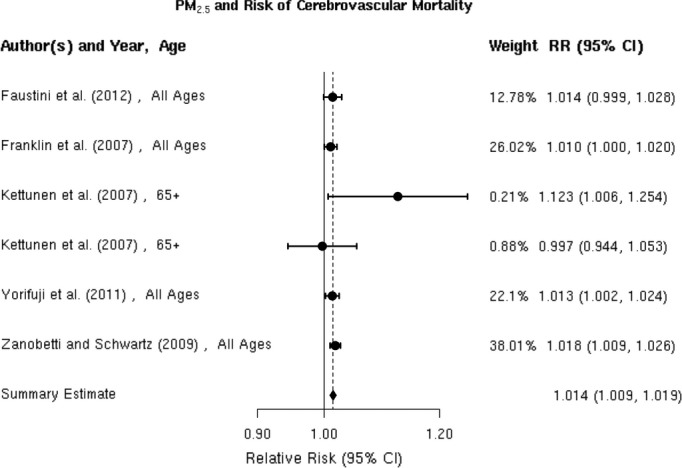
Individual study relative risk (95% CI) for the association between particulate matter PM2.5 and mortality for cerebrovascular disease (CBVD).41,70–72,77
Figure 10.
Funnel plot of individual study relative risk (95% CI) for the association between particulate matter PM2.5 and mortality for cerebrovascular disease (CBVD).
PM10 and Hospital Admission
Total cerebrovascular disease
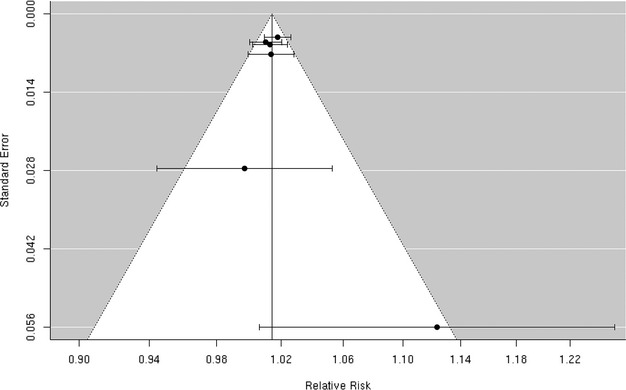
We reviewed 12 studies8,32,36,45–53 of the association between PM10 and hospitalization for the composite end point of all cerebrovascular disease (Figure 11). Of these, 3 studies including Chan et al, Nascimento et al, and Wordley et al32,47,51 reported a positive, statistically significant association between PM10 and cerebrovascular hospitalization. Five additional studies8,45–46,50,52 reported positive associations that did not reach statistical significance and the remaining 4 studies36,48–49,53 found no evidence of a positive association. The random‐effects summary estimate suggests a nonsignificant 0.3% (95% CI −0.1% to 0.8%) higher risk of cerebrovascular hospitalizations per 10‐μg/m3 increase in PM10 (Figure 2). These studies were heterogeneous (I2=76.54%, P=0.001) with no evidence of publication bias (Egger regression test, P=0.94; Figure 12). The results did not materially change in sensitivity analyses pooling effect estimates by individual lag subgroups or when excluding hospital admission cases defined by ICD‐10: 61 to 648 (Table 3). The associations were largely insensitive to stratification by geographic locations with the exception of Latin America, where we observed a greater increase in risk compared with other locations (Table 3).
Figure 11.
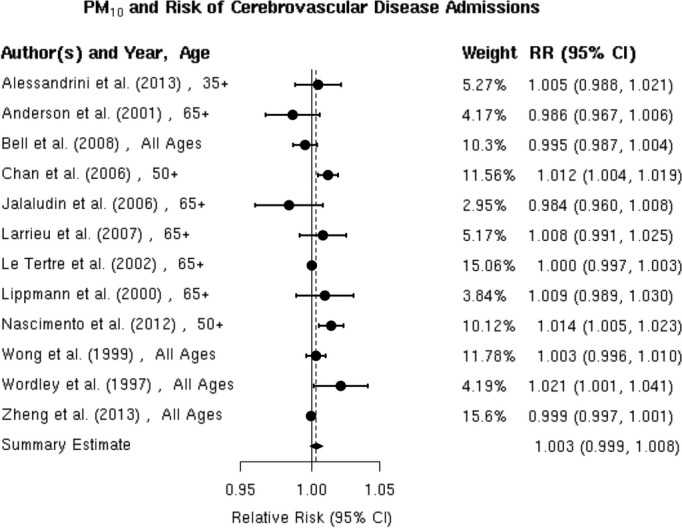
Individual study relative risk (95% CI) for the association between particulate matter PM10 and hospital admissions for cerebrovascular disease (CBVD).8,32,36,45–53
Figure 12.
Funnel plot of individual study relative risk (95% CI) for the association between particulate matter PM10 and hospital admissions for cerebrovascular disease (CBVD).
Ischemic stroke
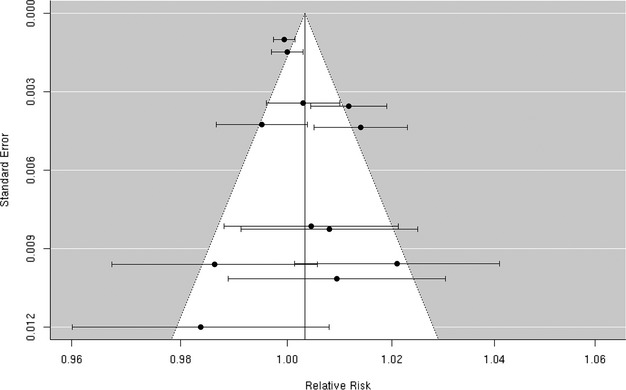
We reviewed 8 studies32,37,42,57–58,57–63 evaluating the association between PM10 and risk of hospitalization for ischemic stroke (Figure 13). In Taiwan, Tsai et al found a positive, statistically significant association but only on days with a mean temperature ≥20°C. Wellenius et al found a statistically significant, positive association between PM10 and ischemic stroke hospitalization among Medicare beneficiaries aged ≥65 years residing in 6 US cities. The remaining studies failed to find evidence of a statistically significant, positive association between PM10 and ischemic stroke hospitalization. Using data from a Danish national stroke registry, Andersen et al found positive, but not statistically significant, associations, with a somewhat stronger and sometimes statistically significant association among patients presenting without comorbid atrial fibrillation. Henrotin et al also found a positive, but not statistically significant, association between PM10 levels and ischemic stroke hospitalization in the context of the Dijon Stroke Registry. The random‐effects summary estimate is null (0.0% [95% CI −2.4% to 2.4%]) and currently does not support the presence of an overall association between PM10 and ischemic stroke hospitalization (Figure 2). These studies were heterogeneous (I2=86.53%, P<0.0001), and sensitivity analyses pooling estimates by individual lag subgroups did not materially change the results (Table 3). The results were largely insensitive to stratification by geographic locations with the exception of East Asia, where we observed a greater increase in relative risk compared with other locations (Table 3).There is evidence suggestive of publication bias (Egger regression test, P=0.03; Figure 14A). When we applied trim and fill methods to adjust for publication bias (estimated 4 missing studies), we no longer observed evidence of publication bias (Egger regression test, P=0.85; Figure 14B), but these studies remained heterogeneous (I2=86.74%, P<0.0001).
Figure 13.
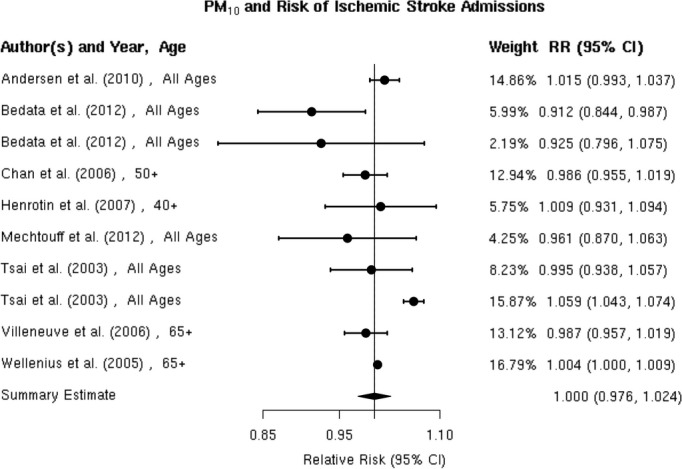
Individual study relative risk (95% CI) for the association between PM10 and hospital admissions for ischemic stroke.32,37,42,57–58,57–63
Figure 14.
A, Funnel plot of individual study relative risk (95% CI) for the association between particulate matter PM10 and hospital admissions for ischemic stroke; (B) After applying trim and fill methods to adjust for publication bias.
Hemorrhagic stroke
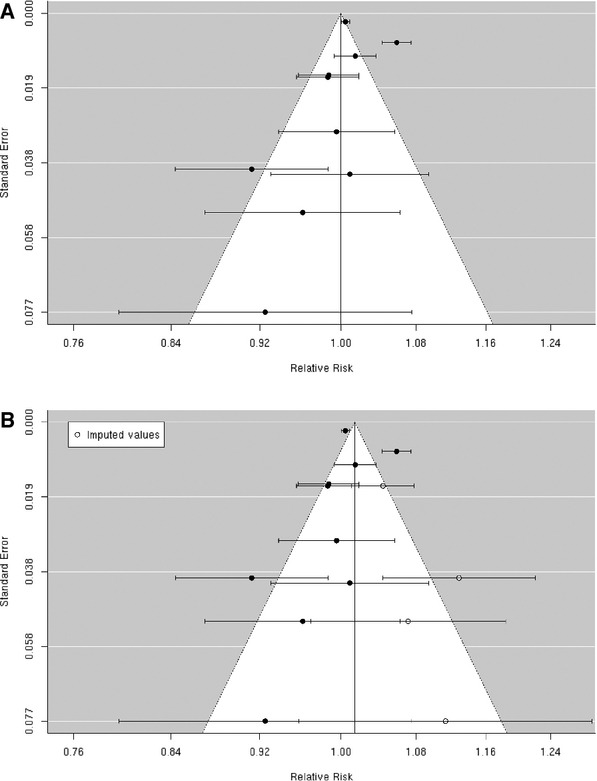
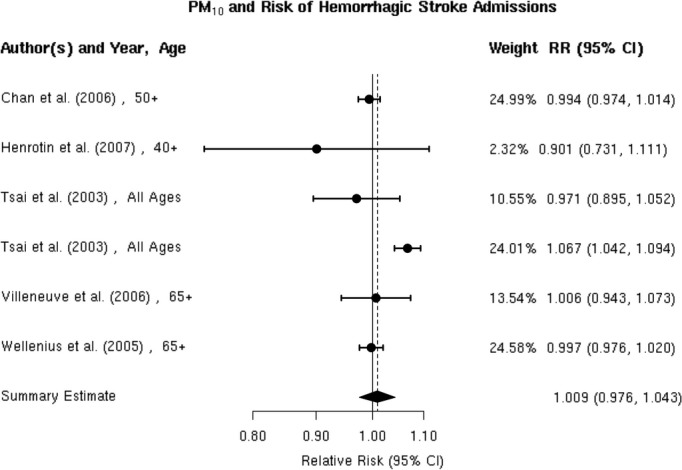
Most,32,37,42,58,63 but not all,42 studies failed to find any association between short‐term exposure to PM10 and hospital admission for hemorrhagic stroke (Figure 15). The notable exception was the study by Tsai et al in Taiwan, which found a positive and statistically significant association but only on days with a mean temperature ≥20°C. The random‐effects summary estimate suggests a 0.9% (95% CI −2.4% to 4.3%) higher risk of hemorrhagic stroke hospital admission per 10‐μg/m3 in PM10 (Figure 2). The pooled studies exhibited considerable heterogeneity (I2=78.84%, P=0.0001). Sensitivity analyses by individual lag subgroups or geographic locations did not materially change the results (Table 3). We did not observe publication bias (Egger regression test, P=0.22; Figure 16).
Figure 15.
Individual study relative risk (95% CI) for the association between particulate matter PM10 and hospital admissions for hemorrhagic stroke.32,37,42,58,63
Figure 16.
Funnel plot of individual study relative risk (95% CI) for the association between particulate matter PM10 and hospital admissions for hemorrhagic stroke.
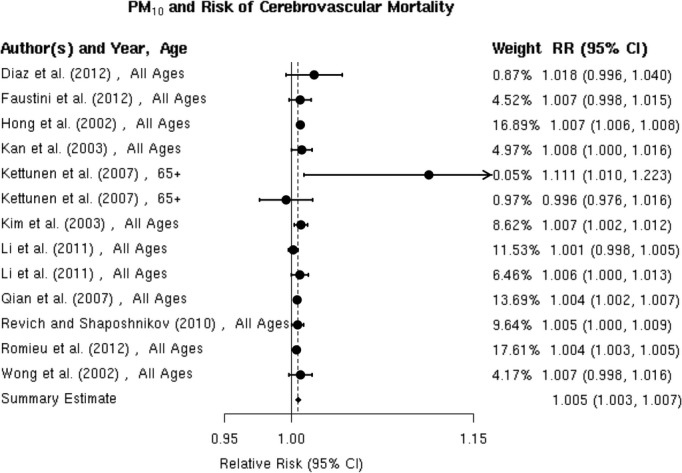
PM10 and Mortality
All41,43,64–68,74,76–77 studies reported positive associations between PM10 and total cerebrovascular mortality (Figure 17). For example, Hong et al reported a statistically significant 0.7% (0.6% to 0.8%) higher risk of cerebrovascular mortality per 10‐μg/m3 increase in PM10 level in Seoul, Korea. Romieu et al reported a statistically significant 0.4% (95% CI 0.3% to 0.5%) higher risk of cerebrovascular mortality per 10‐μg/m3 increase in PM10 level in 9 Latin American cities, and Li et al found a statistically significant 0.7% (95% CI 0.0% to 1.3%) higher risk of cerebrovascular mortality in Tianjin, China, although only on days with a mean temperature ≥20°C. Similarly, in Helsinki, Finland, Kettunen et al reported a positive and statistically significant association between PM10 and cerebrovascular mortality only in the warm season (May to October). The random‐effects summary of 0.5% (95% CI 0.3% to 0.7%) higher risk of cerebrovascular mortality per 10‐μg/m3 increase in PM10 supports the presence of a statistically significant association between PM10 and cerebrovascular mortality (Figure 2). These studies were heterogeneous (I2=84.25%, P<0.0001), and there is evidence suggestive of publication bias (Egger regression test, P=0.05; Figure 18A). When we applied trim and fill methods to adjust for publication bias (estimated 3 missing studies), we no longer observed publication bias (Egger regression test, P=0.99; Figure 18B), but these studies remained heterogeneous (I2=40.72%, P=0.01). The results did not materially change in sensitivity analyses pooling point estimates by individual lag subgroups or excluding 2 studies that defined total cerebrovascular mortality using ICD‐10: 60 to 61, 63 to 6441 or ICD‐10: 61, 63, and 6972 (Table 3). The associations did not vary by geographic locations (Table 3).
Figure 17.
Individual study relative risk (95% CI) for the association between particulate matter PM10 and mortality for cerebrovascular disease (CBVD).41,43,64–69,74,76–77
Figure 18.
A, Funnel plot of individual study relative risk (95% CI) for the association between particulate matter PM10 and mortality for cerebrovascular disease (CBVD); (B) After applying trim and fill methods to adjust for publication bias.
PM2.5‐10 and Hospital Admission
Total cerebrovascular disease
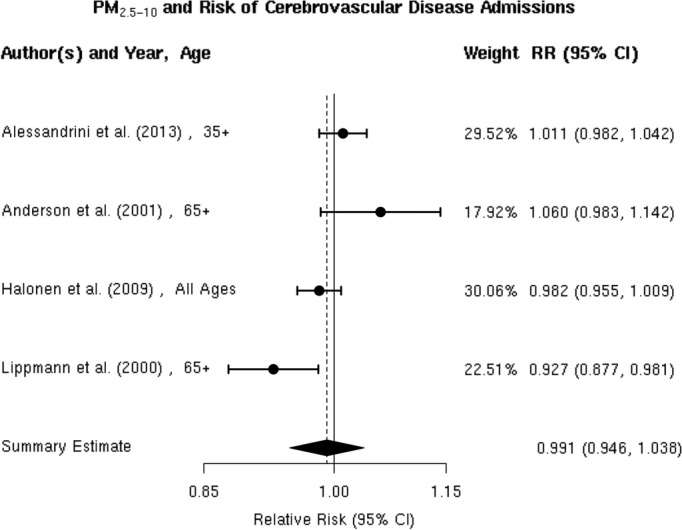
We found 4 studies36,39,50,52 that examined the association between PM2.5‐10 and hospital admission for cerebrovascular diseases, and the results were heterogeneous (Figure 19). Two of these studies36,52 reported a positive, but not statistically significant, association, while the other 2 studies39,50 reported a negative but not statistically significant association. We did not include the study by Peng et al, because they did not report the association between PM2.5‐10 and cerebrovascular hospital admission. The random‐effects summary of −0.9% (95% CI −5.4% to 3.8%) excess relative risk suggests that short‐term exposure to PM2.5‐10 is not associated with hospital admissions for total cerebrovascular disease (Figure 2). We observed no publication bias (Egger regression test, P=0.74; Figure 20), and these studies were heterogeneous (I2=80.12%, P=0.01). Sensitivity analyses by geographical locations or excluding hospital admissions defined by ICD‐10: 60 to 61, 63 to 6439 did not materially change the results (pooled relative risk 0.996 [95% CI 0.926 to 1.071]; data not shown in Table 3).
Figure 19.
Individual study relative risk (95% CI) for the association between particulate matter PM2.5‐10 and hospital admissions for cerebrovascular disease (CBVD).36,39,50,52
Figure 20.
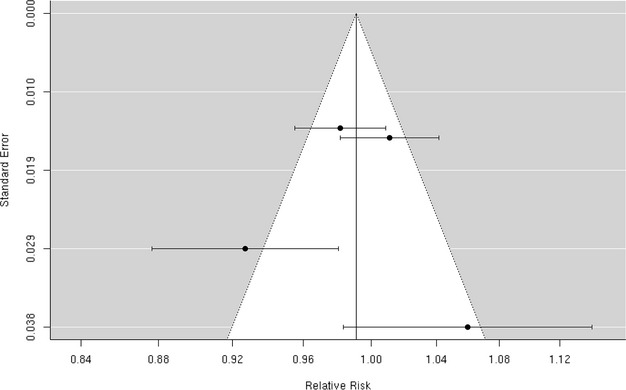
Funnel plot of individual study relative risk (95% CI) for the association between particulate matter PM2.5‐10 and hospital admissions for cerebrovascular disease (CBVD).
PM2.5‐10 and Mortality
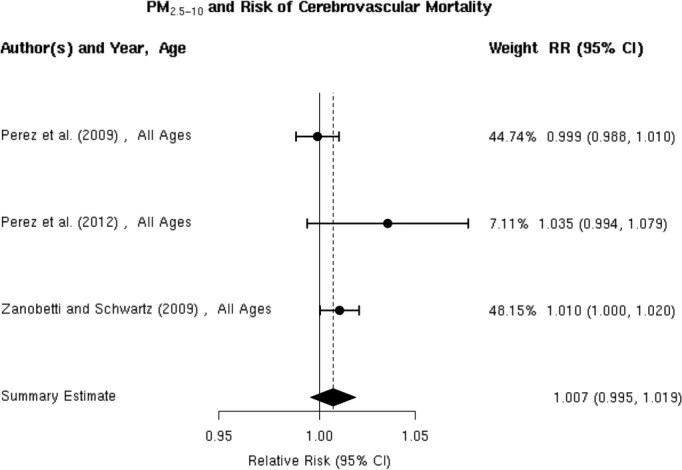
Three70,73,75 studies reported effect estimates for the association between short‐term exposure to PM2.5‐10 and total cerebrovascular disease mortality (Figure 21). In 47 US cities, Zanobetti and Schwartz 2009 found a 0.8% (95% CI 0.1% to 1.6%) higher risk of total cerebrovascular disease mortality per 10‐μg/m3 increase in PM2.5‐10 over 2 days before deaths. The summary estimate of 0.7% (95% CI −0.5% to 1.9%) excess relative risk does not yet support the presence of a statistically significant association between PM2.5‐10 and cerebrovascular mortality (Figure 2). These studies were not heterogeneous (I2=46.83%, P=0.12), and we did not observe publication bias (Egger regression test, P=0.21; Figure 22). Sensitivity analysis limited to the European studies yielded a summary estimate of 1.1% (95% CI −2.2% to 4.5%) higher risk of total cerebrovascular disease per 10‐μg/m3 increase in PM2.5‐10.
Figure 21.
Individual study relative risk (95% CI) for the association between particulate matter PM2.5‐10 and mortality for cerebrovascular disease (CBVD).70,73,75
Figure 22.
Funnel plot of individual study relative risk (95% CI) for the association between particulate matter PM2.5‐10 and mortality for cerebrovascular disease (CBVD).
Discussion
Findings of key epidemiologic studies and the meta‐analyses presented here suggest that particulate matter air pollution is associated with a statistically significant higher risk of cerebrovascular disease mortality, with weaker evidence for the presence of associations with different types of strokes such as ischemic and hemorrhagic strokes. Specifically, we found a summary estimate of 1.4% (95% CI 0.9% to 1.9%) higher risk of cerebrovascular mortality per 10‐μg/m3 increase in PM2.5. Several studies suggest that hospital admission for total cerebrovascular disease or ischemic stroke may be associated with PM2.5, but the weight of the published evidence does not yet show a positive and statistically significant association, as suggested by the summary estimates of 0.3% (95% CI −0.5% to 1.2%) and 1.3% (95% CI −4.2% to 7.0%) excess relative risk, respectively. Only 2 studies have specifically considered hemorrhagic stroke, but these studies do not suggest that risk of hemorrhagic stroke is associated with PM2.5 levels.
Results for PM10 were similar to those for PM2.5. Specifically, we found a summary estimate of 0.5% (95% CI 0.3% to 0.7%) higher risk of cerebrovascular mortality per 10‐μg/m3 increase in PM10. The evidence for the presence of an association between PM10 and hospital admission for total cerebrovascular disease or ischemic stroke remains inconsistent, as suggested by the summary estimates of 0.3% (95% CI −0.1% to 0.8%) and 0.0% (95% CI −2.4% to 2.4%) excess risk per 10‐μg/m3 increase in PM10, respectively. Additional large studies will be needed to convincingly demonstrate the presence or absence of these associations in future meta‐analyses. The few available studies do not clearly suggest an association between PM10 and hospital admissions for hemorrhagic stroke.
Substantially fewer studies have considered the association between PM2.5‐10 and cerebrovascular mortality or morbidity and the evidence currently available does not indicate the presence of such associations, as suggested by summary estimates of 0.9% (95% CI 5.4% to 3.8%) and 0.7% (95% CI −0.5% to 1.9%) excess risk per 10‐μg/m3 increase in PM2.5‐10, respectively. We found no studies relating PM2.5‐10 specifically with risk of ischemic stroke or hemorrhagic stroke hospitalization.
The meta‐analytic summary estimates often masked considerable variability among studies, even where we did not find statistically significant heterogeneity. There are likely multiple sources that may explain this underlying variability in results across studies. First, ambient particulate matter is a heterogeneous mixture of various compounds (eg, organic and elemental carbon, metals, sulfates, nitrates, and microorganisms) from multiple sources (eg, traffic, manufacturing, power generation). The role of each component or source—individually or in conjunction—as an acute trigger of cardiovascular events including stroke remains unclear.78
Second, exposure misclassification may bias effect estimate toward the null79 and may arise from different strategies used to assess PM exposure at the community level and the type of air pollution monitoring network accessible to researchers. For example, O'Donnell et al estimated city‐specific associations between ischemic stroke hospital admission and PM2.5 using measurements from 19 monitors in cities of various sizes in Ontario, Canada. They found a −0.7% (95% CI −6.3% to 5.1%) decrease in hospital admission for ischemic stroke when including monitoring data from all cities. After only including cases with monitoring data from the 4 largest cities, where >1 single monitor in each city was used, they found a 1.1% (95% CI −4.0% to 6.5%) higher risk of hospital admission for ischemic stroke, perhaps due to reduction of exposure misclassification. In addition, delay times from stroke onset to hospital presentation can lead to exposure misclassification, which may bias the results toward the null.79
Third, cerebrovascular disease and stroke are composite end points that include strokes of different etiologies (eg, ischemic versus intracerebral hemorrhage versus subarachnoid hemorrhage). It seems plausible that PM would have different associations with risk of acute ischemic stroke versus intracerebral hemorrhage. Even ischemic stroke is a heterogeneous disease with multiple potential etiologies including large artery atherothombosis, small vessel disease, cardioembolic events, and other less common ischemic stroke etiologies. Indeed, there is limited evidence to suggest that some etiologic subtypes of ischemic stroke may be more strongly associated with PM.59 As the distribution of ischemic stroke etiologies varies across populations, even specifically considering studies of ischemic stroke leaves considerable room for heterogeneity in outcome.
Fourth, studies using ICD‐9/10 codes to ascertain ischemic or hemorrhagic stroke often lead to outcome misclassification and is expected to have biased effect estimates toward the null hypothesis of no association.80 Stroke registries in which cases are ascertained by medical record review can be valuable source for identifying cases particularly for studying stroke of different etiologies.
Fifth, current epidemiologic studies often account for temporal or meteorologic confounders in different ways. Finally, differences in demographic characteristics of underlying population (eg, percent of participants younger than 65 years old), local meteorology, average PM levels, or quality control of ascertainment of stroke and subtypes (eg, interindividual variations between medical coders during stroke ascertainment) may also contribute to heterogeneity of results across studies including the observed geographic variations of the association between PM2.5 and hospital admission for total cerebrovascular disease. For example, the elderly and those with certain comorbid conditions are thought to be more susceptible to cardiovascular effects of air pollution.78 To the extent that population demographics and the distribution of stroke risk factors and comorbid conditions vary greatly across study populations, this may contribute substantially to the heterogeneity of results across studies.
Research Gaps and Recommendations
These results highlight a number of important gaps in the current literature. First, most prior studies have evaluated a composite end point of cerebrovascular events, but additional large studies specifically considering ischemic stroke, ischemic stroke subtypes, and hemorrhagic stroke are still needed. Second, few studies to date have evaluated whether the association between PM and stroke varies by PM composition or source. Studies to identify PM components or sources most relevant to stroke mortality and morbidity are needed. Third, most studies have focused on PM2.5 and PM10 but study of PM2.5‐10 is also warranted for its relevance to morbidity, as evidenced in prior studies of association with cardiovascular disease.56 We did not have sufficiently large sample size to draw a conclusion for PM2.5‐10 in this study. Fourth, given the heavy reliance of prior studies on administrative data, outcome misclassification due to the use of ICD codes is prevalent in current studies particularly for stroke subtypes. More epidemiologic studies based on registry data or using medical record review for outcome ascertainment should be carried out to replicate current results. Additionally, history of prior stroke is an important risk factor for stroke, but few studies have considered recurrent versus first stroke.55 Studies are needed to evaluate the association between stroke recurrence and particulate matter. Fifth, few studies have identified subgroups of the population that may be at increased risk of stroke mortality and morbidity. In addition, studies are needed to identify whether or not patients with non‐cardioembolic (large‐artery atherosclerosis, small‐vessel disease) or cardioembolic ischemic stroke are at greater risk of hospital admission for ischemic stroke associated with PM10. Sixth, most available studies of ischemic stroke and subtypes or hemorrhagic stroke suffer from exposure misclassification due to the use of date of hospital admission rather than date and time of stroke symptom onset. Novel epidemiologic study design or statistical methods of data analysis that address this issue may help minimize such misclassification. Seventh, given the inconsistent results for an association between PM10 and hospital admission for total cerebrovascular diseases, additional large studies are needed to replicate the current results for PM10. Eighth, given a borderline significant increase in risk of hospital admission for ischemic stroke associated with PM2.5 within 24 hours but not 48 hours of onset, more studies are need to evaluate the temporal window of PM2.5 exposure most relevant to ischemic stroke and subtypes. To conclude, more studies, particularly large studies that simultaneously leverage statistical correction of exposure or outcome errors, case ascertainment via physician diagnosis and accurate exposure data for PM components or PM2.5‐10 are warranted to further elucidate the association between short‐term change in ambient particulates and stroke.
Sources of Funding
The work was supported by grants R00‐ES015774 and R01‐ES020871 from the National Institute of Environmental Health Sciences (NIEHS), NIH. The contents of this report are solely the responsibility of the authors and do not necessarily represent the official views of the sponsoring institutions.
Disclosures
Dr Wellenius has received consulting fees from Environmental Health and Engineering, Inc, for work unrelated to this manuscript. Other authors declare no competing financial interest.
References
- 1.Roger VL, Go AS, Lloyd‐Jones DM, Adams RJ, Berry JD, Brown TM, Carnethon MR, Dai S, de Simone G, Ford ES, Fox CS, Fullerton HJ, Gillespie C, Greenlund KJ, Hailpern SM, Heit JA, Ho PM, Howard VJ, Kissela BM, Kittner SJ, Lackland DT, Lichtman JH, Lisabeth LD, Makuc DM, Marcus GM, Marelli A, Matchar DB, McDermott MM, Meigs JB, Moy CS, Mozaffarian D, Mussolino ME, Nichol G, Paynter NP, Rosamond WD, Sorlie PD, Stafford RS, Turan TN, Turner MB, Wong ND, Wylie‐Rosett JAmerican Heart Association Statistics C, Stroke Statistics S. Heart disease and stroke statistics—2011 update: a report from the American Heart Association. Circulation. 2011; 123:e18-e209. [DOI] [PMC free article] [PubMed] [Google Scholar]
- 2.Go AS, Mozaffarian D, Roger VL, Benjamin EJ, Berry JD, Borden WB, Bravata DM, Dai S, Ford ES, Fox CS, Franco S, Fullerton HJ, Gillespie C, Hailpern SM, Heit JA, Howard VJ, Huffman MD, Kissela BM, Kittner SJ, Lackland DT, Lichtman JH, Lisabeth LD, Magid D, Marcus GM, Marelli A, Matchar DB, McGuire DK, Mohler ER, Moy CS, Mussolino ME, Nichol G, Paynter NP, Schreiner PJ, Sorlie PD, Stein J, Turan TN, Virani SS, Wong ND, Woo D, Turner MB. Executive summary: heart disease and stroke statistics—2013 update: a report from the American Heart Association. Circulation. 2013; 127:143-152. [DOI] [PubMed] [Google Scholar]
- 3.Di Carlo A. Human and economic burden of stroke. Age Ageing. 2009; 38:4-5. [DOI] [PubMed] [Google Scholar]
- 4.Samet JM, Dominici F, Curriero FC, Coursac I, Zeger SL. Fine particulate air pollution and mortality in 20 U.S. Cities, 1987–1994. N Engl J Med. 2000; 343:1742-1749. [DOI] [PubMed] [Google Scholar]
- 5.Samet JM, Zeger SL, Dominici F, Curriero F, Coursac I, Dockery DW, Schwartz J, Zanobetti A. The National Morbidity, Mortality, and Air Pollution Study. Part II: morbidity and mortality from air pollution in the United States. Res Rep Health Eff Inst. 2000; 94:5-70. [PubMed] [Google Scholar]
- 6.Schwartz J. Air pollution and hospital admissions for heart disease in eight U.S. counties. Epidemiology. 1999; 10:17-22. [PubMed] [Google Scholar]
- 7.Pope CA, III, Muhlestein JB, May HT, Renlund DG, Anderson JL, Horne BD. Ischemic heart disease events triggered by short‐term exposure to fine particulate air pollution. Circulation. 2006; 114:2443-2448. [DOI] [PubMed] [Google Scholar]
- 8.Larrieu S, Jusot JF, Blanchard M, Prouvost H, Declercq C, Fabre P, Pascal L, Tertre AL, Wagner V, Riviere S, Chardon B, Borrelli D, Cassadou S, Eilstein D, Lefranc A. Short term effects of air pollution on hospitalizations for cardiovascular diseases in eight French cities: the PSAS program. Sci Total Environ. 2007; 387:105-112. [DOI] [PubMed] [Google Scholar]
- 9.Peel JL, Metzger KB, Klein M, Flanders WD, Mulholland JA, Tolbert PE. Ambient air pollution and cardiovascular emergency department visits in potentially sensitive groups. Am J Epidemiol. 2007; 165:625-633. [DOI] [PubMed] [Google Scholar]
- 10.Zanobetti A, Schwartz J. Air pollution and emergency admissions in Boston, MA. J Epidemiol Community Health. 2006; 60:890-895. [DOI] [PMC free article] [PubMed] [Google Scholar]
- 11.Peters A, Dockery DW, Muller JE, Mittleman MA. Increased particulate air pollution and the triggering of myocardial infarction. Circulation. 2001; 103:2810-2815. [DOI] [PubMed] [Google Scholar]
- 12.D'Ippoliti D, Forastiere F, Ancona C, Agabiti N, Fusco D, Michelozzi P, Perucci CA. Air pollution and myocardial infarction in Rome: a case‐crossover analysis. Epidemiology. 2003; 14:528-535. [DOI] [PubMed] [Google Scholar]
- 13.Peters A, Liu E, Verrier RL, Schwartz J, Gold DR, Mittleman M, Baliff J, Oh JA, Allen G, Monahan K, Dockery DW. Air pollution and incidence of cardiac arrhythmia. Epidemiology. 2000; 11:11-17. [DOI] [PubMed] [Google Scholar]
- 14.Luttmann‐Gibson H, Gold DR, Link M, Mittleman MA, Rich DQ, Schwartz J, Verrier RL, Dockery DW. Daily air pollution effects on cardiac arrhythmias in patients with implanted cardioverter defibrillators. Epidemiology. 2002; 13:S170 [Google Scholar]
- 15.Dockery DW, Luttmann‐Gibson H, Rich DQ, Link MS, Mittleman MA, Gold DR, Koutrakis P, Schwartz JD, Verrier RL. Association of air pollution with increased incidence of ventricular tachyarrhythmias recorded by implanted cardioverter defibrillators. Environ Health Perspect. 2005; 113:670-674. [DOI] [PMC free article] [PubMed] [Google Scholar]
- 16.Schwartz J, Morris R. Air pollution and hospital admissions for cardiovascular disease in Detroit, Michigan. Am J Epidemiol. 1995; 142:23-35. [DOI] [PubMed] [Google Scholar]
- 17.Morris RD, Naumova EN. Carbon monoxide and hospital admissions for congestive heart failure: evidence of an increased effect at low temperatures. Environ Health Perspect. 1998; 106:649-653. [DOI] [PMC free article] [PubMed] [Google Scholar]
- 18.Wellenius GA, Bateson TF, Mittleman MA, Schwartz J. Particulate air pollution is associated with hospital admissions for congestive heart failure among the elderly in Pittsburgh, PA. Epidemiology. 2003; 14:S83 [Google Scholar]
- 19.Peters A, Doring A, Wichmann HE, Koenig W. Increased plasma viscosity during an air pollution episode: a link to mortality? Lancet. 1997; 349:1582-1587. [DOI] [PubMed] [Google Scholar]
- 20.Liao D, Creason J, Shy C, Williams R, Watts R, Zweidinger R. Daily variation of particulate air pollution and poor cardiac autonomic control in the elderly. Environ Health Perspect. 1999; 107:521-525. [DOI] [PMC free article] [PubMed] [Google Scholar]
- 21.Pope CA, III, Verrier RL, Lovett EG, Larson AC, Raizenne ME, Kanner RE, Schwartz J, Villegas GM, Gold DR, Dockery DW. Heart rate variability associated with particulate air pollution. Am Heart J. 1999; 138:890-899. [DOI] [PubMed] [Google Scholar]
- 22.Seaton A, Soutar A, Crawford V, Elton R, McNerlan S, Cherrie J, Watt M, Agius R, Stout R. Particulate air pollution and the blood. Thorax. 1999; 54:1027-1032. [DOI] [PMC free article] [PubMed] [Google Scholar]
- 23.Gold DR, Litonjua A, Schwartz J, Lovett E, Larson A, Nearing B, Allen G, Verrier M, Cherry R, Verrier R. Ambient pollution and heart rate variability. Circulation. 2000; 101:1267-1273. [DOI] [PubMed] [Google Scholar]
- 24.Creason J, Neas L, Walsh D, Williams R, Sheldon L, Liao D, Shy C. Particulate matter and heart rate variability among elderly retirees: the Baltimore 1998 PM study. J Expo Anal Environ Epidemiol. 2001; 11:116-122. [DOI] [PubMed] [Google Scholar]
- 25.Peters A, Frohlich M, Doring A, Immervoll T, Wichmann HE, Hutchinson WL, Pepys MB, Koenig W. Particulate air pollution is associated with an acute phase response in men; results from the MONICA‐Augsburg Study. Eur Heart J. 2001; 22:1198-1204. [DOI] [PubMed] [Google Scholar]
- 26.van Eeden SF, Hogg JC. Systemic inflammatory response induced by particulate matter air pollution: the importance of bone‐marrow stimulation. J Toxicol Environ Health A. 2002; 65:1597-1613. [DOI] [PubMed] [Google Scholar]
- 27.Nemmar A, Hoet PH, Dinsdale D, Vermylen J, Hoylaerts MF, Nemery B. Diesel exhaust particles in lung acutely enhance experimental peripheral thrombosis. Circulation. 2003; 107:1202-1208. [DOI] [PubMed] [Google Scholar]
- 28.O'Neill MS, Veves A, Zanobetti A, Sarnat JA, Gold DR, Economides PA, Horton ES, Schwartz J. Diabetes enhances vulnerability to particulate air pollution‐associated impairment in vascular reactivity and endothelial function. Circulation. 2005; 111:2913-2920. [DOI] [PubMed] [Google Scholar]
- 29.Tornqvist H, Mills NL, Gonzalez M, Miller MR, Robinson SD, Megson IL, Macnee W, Donaldson K, Soderberg S, Newby DE, Sandstrom T, Blomberg A. Persistent endothelial dysfunction in humans after diesel exhaust inhalation. Am J Respir Crit Care Med. 2007; 176:395-400. [DOI] [PubMed] [Google Scholar]
- 30.Dales R, Liu L, Szyszkowicz M, Dalipaj M, Willey J, Kulka R, Ruddy TD. Particulate air pollution and vascular reactivity: the bus stop study. Int Arch Occup Environ Health. 2007; 81:159-164. [DOI] [PubMed] [Google Scholar]
- 31.Caplan LR. Stroke. 2011New York, NY: Oxford University Press [Google Scholar]
- 32.Chan CC, Chuang KJ, Chien LC, Chen WJ, Chang WT. Urban air pollution and emergency admissions for cerebrovascular diseases in Taipei, Taiwan. Eur Heart J. 2006; 27:1238-1244. [DOI] [PubMed] [Google Scholar]
- 33.Dominici F, Peng RD, Bell ML, Pham L, McDermott A, Zeger SL, Samet JM. Fine particulate air pollution and hospital admission for cardiovascular and respiratory diseases. JAMA. 2006; 295:1127-1134. [DOI] [PMC free article] [PubMed] [Google Scholar]
- 34.Lisabeth LD, Escobar JD, Dvonch JT, Sanchez BN, Majersik JJ, Brown DL, Smith MA, Morgenstern LB. Ambient air pollution and risk for ischemic stroke and transient ischemic attack. Ann Neurol. 2008; 64:53-59. [DOI] [PMC free article] [PubMed] [Google Scholar]
- 35.Delfino RJ, Brummel S, Wu J, Stern H, Ostro B, Lipsett M, Winer A, Street DH, Zhang L, Tjoa T, Gillen DL. The relationship of respiratory and cardiovascular hospital admissions to the southern California wildfires of 2003. Occup Environ Med. 2009; 66:189-197. [DOI] [PMC free article] [PubMed] [Google Scholar]
- 36.Anderson HR, Bremner SA, Atkinson RW, Harrison RM, Walters S. Particulate matter and daily mortality and hospital admissions in the west midlands conurbation of the United Kingdom: associations with fine and coarse particles, black smoke and sulphate. Occup Environ Med. 2001; 58:504-510. [DOI] [PMC free article] [PubMed] [Google Scholar]
- 37.Villeneuve PJ, Chen L, Stieb D, Rowe BH. Associations between outdoor air pollution and emergency department visits for stroke in Edmonton, Canada. Eur J Epidemiol. 2006; 21:689-700. [DOI] [PubMed] [Google Scholar]
- 38.Barnett AG, Williams GM, Schwartz J, Best TL, Neller AH, Petroeschevsky AL, Simpson RW. The effects of air pollution on hospitalizations for cardiovascular disease in elderly people in Australian and New Zealand cities. Environ Health Perspect. 2006; 114:1018-1023. [DOI] [PMC free article] [PubMed] [Google Scholar]
- 39.Halonen JI, Lanki T, Yli‐Tuomi T, Tiittanen P, Kulmala M, Pekkanen J. Particulate air pollution and acute cardiorespiratory hospital admissions and mortality among the elderly. Epidemiology. 2009; 20:143-153. [DOI] [PubMed] [Google Scholar]
- 40.O'Donnell MJ, Fang J, Mittleman MA, Kapral MK, Wellenius GA. Fine particulate air pollution (PM2.5) and the risk of acute ischemic stroke. Epidemiology. 2011; 22:422-431. [DOI] [PMC free article] [PubMed] [Google Scholar]
- 41.Kettunen J, Lanki T, Tiittanen P, Aalto PP, Koskentalo T, Kulmala M, Salomaa V, Pekkanen J. Associations of fine and ultrafine particulate air pollution with stroke mortality in an area of low air pollution levels. Stroke. 2007; 38:918-922. [DOI] [PubMed] [Google Scholar]
- 42.Tsai SS, Goggins WB, Chiu HF, Yang CY. Evidence for an association between air pollution and daily stroke admissions in Kaohsiung, Taiwan. Stroke. 2003; 34:2612-2616. [DOI] [PubMed] [Google Scholar]
- 43.Li G, Zhou M, Cai Y, Zhang Y, Pan X. Does temperature enhance acute mortality effects of ambient particle pollution in Tianjin City, China. Sci Total Environ. 2011; 409:1811-1817. [DOI] [PubMed] [Google Scholar]
- 44.Duval S, Tweedie R. A nonparametric “trim and fill” method of accounting for publication bias in meta‐analysis. J Am Stat Assoc. 2000; 95:89-98. [Google Scholar]
- 45.Le Tertre A, Medina S, Samoli E, Forsberg B, Michelozzi P, Boumghar A, Vonk JM, Bellini A, Atkinson R, Ayres JG, Sunyer J, Schwartz J, Katsouyanni K. Short‐term effects of particulate air pollution on cardiovascular diseases in eight European cities. J Epidemiol Community Health. 2002; 56:773-779. [DOI] [PMC free article] [PubMed] [Google Scholar]
- 46.Wong TW, Lau TS, Yu TS, Neller A, Wong SL, Tam W, Pang SW. Air pollution and hospital admissions for respiratory and cardiovascular diseases in Hong Kong. Occup Environ Med. 1999; 56:679-683. [DOI] [PMC free article] [PubMed] [Google Scholar]
- 47.Wordley J, Walters S, Ayres JG. Short term variations in hospital admissions and mortality and particulate air pollution. Occup Environ Med. 1997; 54:108-116. [DOI] [PMC free article] [PubMed] [Google Scholar]
- 48.Bell ML, Levy JK, Lin Z. The effect of sandstorms and air pollution on cause‐specific hospital admissions in Taipei, Taiwan. Occup Environ Med. 2008; 65:104-111. [DOI] [PubMed] [Google Scholar]
- 49.Jalaludin B, Morgan G, Lincoln D, Sheppeard V, Simpson R, Corbett S. Associations between ambient air pollution and daily emergency department attendances for cardiovascular disease in the elderly (65+ years), Sydney, Australia. J Eposure Sci Environ Epidemiol. 2006; 16:225-237. [DOI] [PubMed] [Google Scholar]
- 50.Lippmann M, Ito K, Nadas A, Burnett RT. Association of particulate matter components with daily mortality and morbidity in urban populations. Res Rep Health Eff Inst. 2000:5-72. [PubMed] [Google Scholar]
- 51.Nascimento LFC, Francisco JB, Patto MBR, Antunes AM. Environmental pollutants and stroke‐related hospital admissions. Cad Saude Publica. 2012; 28:1319-1324. [DOI] [PubMed] [Google Scholar]
- 52.Alessandrini ER, Stafoggia M, Faustini A, Gobbi GP, Forastiere F. Saharan dust and the association between particulate matter and daily hospitalisations in Rome, Italy. Occup Environ Med. 2013; 70:432-434. [DOI] [PubMed] [Google Scholar]
- 53.Zheng S, Wang MZ, Wang SG, Tao Y, Shang KZ. Short‐term effects of gaseous pollutants and particulate matter on daily hospital admissions for cardio‐cerebrovascular disease in Lanzhou: evidence from a heavily polluted city in China. Int J Environ Res Public Health. 2013; 10:462-477. [DOI] [PMC free article] [PubMed] [Google Scholar]
- 54.Corea F, Silvestrelli G, Baccarelli A, Giua A, Previdi P, Siliprandi G, Murgia N. Airborne pollutants and lacunar stroke: a case cross‐over analysis on stroke unit admissions. Neurol Int. 2012; 4:e11. [DOI] [PMC free article] [PubMed] [Google Scholar]
- 55.Oudin A, Forsberg B, Jakobsson K. Air pollution and stroke. Epidemiology. 2012; 23:505-506. [DOI] [PubMed] [Google Scholar]
- 56.Peng RD, Chang HH, Bell ML, McDermott A, Zeger SL, Samet JM, Dominici F. Coarse particulate matter air pollution and hospital admissions for cardiovascular and respiratory diseases among medicare patients. J Am Med Assoc. 2008; 299:2172-2179. [DOI] [PMC free article] [PubMed] [Google Scholar]
- 57.Andersen ZJ, Olsen TS, Andersen KK, Loft S, Ketzel M, Raaschou‐Nielsen O. Association between short‐term exposure to ultrafine particles and hospital admissions for stroke in Copenhagen, Denmark. Eur Heart J. 2010; 31:2034-2040. [DOI] [PubMed] [Google Scholar]
- 58.Henrotin JB, Besancenot JP, Bejot Y, Giroud M. Short‐term effects of ozone air pollution on ischaemic stroke occurrence: a case‐crossover analysis from a 10‐year population‐based study in Dijon, France. Occup Environ Med. 2007; 64:439-445. [DOI] [PMC free article] [PubMed] [Google Scholar]
- 59.Wellenius GA, Burger MR, Coull BA, Schwartz J, Suh HH, Koutrakis P, Schlaug G, Gold DR, Mittleman MA. Ambient air pollution and the risk of acute ischemic stroke. Arch Intern Med. 2012; 172:229-234. [DOI] [PMC free article] [PubMed] [Google Scholar]
- 60.Vidale S, Bonanomi A, Guidotti M, Arnaboldi M, Sterzi R. Air pollution positively correlates with daily stroke admission and in hospital mortality: a study in the urban area of Como, Italy. Neurol Sci. 2010; 31:179-182. [DOI] [PubMed] [Google Scholar]
- 61.Mechtouff L, Canoui‐Poitrine F, Schott AM, Nighoghossian N, Trouillas P, Termoz A, Porthault‐Chatard S, David JS, Chasles V, Derex L. Lack of association between air pollutant exposure and short‐term risk of ischaemic stroke in Lyon, France. Int J Stroke. 2012; 7:669-674. [DOI] [PubMed] [Google Scholar]
- 62.Bedada GB, Smith CJ, Tyrrell PJ, Hirst AA, Agius R. Short‐term effects of ambient particulates and gaseous pollutants on the incidence of transient ischaemic attack and minor stroke: a case‐crossover study. Environ Health. 2012; 11:77. [DOI] [PMC free article] [PubMed] [Google Scholar]
- 63.Wellenius GA, Schwartz J, Mittleman MA. Air pollution and hospital admissions for ischemic and hemorrhagic stroke among medicare beneficiaries. Stroke. 2005; 36:2549-2553. [DOI] [PubMed] [Google Scholar]
- 64.Hong YC, Lee JT, Kim H, Ha EH, Schwartz J, Christiani DC. Effects of air pollutants on acute stroke mortality. Environ Health Perspect. 2002; 110:187-191. [DOI] [PMC free article] [PubMed] [Google Scholar]
- 65.Kan H, Jia J, Chen B. Acute stroke mortality and air pollution: new evidence from Shanghai, China. J Occup Health. 2003; 45:321-323. [DOI] [PubMed] [Google Scholar]
- 66.Kim H, Kim Y, Hong YC. The lag‐effect pattern in the relationship of particulate air pollution to daily mortality in Seoul, Korea. Int J Biometeorol. 2003; 48:25-30. [DOI] [PubMed] [Google Scholar]
- 67.Qian Z, He Q, Lin HM, Kong L, Liao D, Dan J, Bentley CM, Wang B. Association of daily cause‐specific mortality with ambient particle air pollution in Wuhan, China. Environ Res. 2007; 105:380-389. [DOI] [PubMed] [Google Scholar]
- 68.Revich B, Shaposhnikov D. The effects of particulate and ozone pollution on mortality in Moscow, Russia. Air Qual Atmos Health. 2010; 3:117-123. [DOI] [PMC free article] [PubMed] [Google Scholar]
- 69.Wong TW, Tam WS, Yu TS, Wong AH. Associations between daily mortalities from respiratory and cardiovascular diseases and air pollution in Hong Kong, China. Occup Environ Med. 2002; 59:30-35. [DOI] [PMC free article] [PubMed] [Google Scholar]
- 70.Zanobetti A, Schwartz J. The effect of fine and coarse particulate air pollution on mortality: a national analysis. Environ Health Perspect. 2009; 117:898-903. [DOI] [PMC free article] [PubMed] [Google Scholar]
- 71.Franklin M, Zeka A, Schwartz J. Association between PM2.5 and all‐cause and specific‐cause mortality in 27 US communities. J Eposure Sci Environ Epidemiol. 2007; 17:279-287. [DOI] [PubMed] [Google Scholar]
- 72.Yorifuji T, Kawachi I, Sakamoto T, Doi H. Associations of outdoor air pollution with hemorrhagic stroke mortality. J Occup Environ Med. 2011; 53:124-126. [DOI] [PubMed] [Google Scholar]
- 73.Perez L, Medina‐Ramon M, Kunzli N, Alastuey A, Pey J, Perez N, Garcia R, Tobias A, Querol X, Sunyer J. Size fractionate particulate matter, vehicle traffic, and case‐specific daily mortality in Barcelona, Spain. Environ Sci Technol. 2009; 43:4707-4714. [DOI] [PubMed] [Google Scholar]
- 74.Diaz J, Tobias A, Linares C. Saharan dust and association between particulate matter and case‐specific mortality: a case‐crossover analysis in Madrid (Spain). Environ Health. 2012; 11:11. [DOI] [PMC free article] [PubMed] [Google Scholar]
- 75.Perez L, Tobias A, Querol X, Pey J, Alastuey A, Diaz J, Sunyer J. Saharan dust, particulate matter and cause‐specific mortality: a case‐crossover study in Barcelona (Spain). Environ Int. 2012; 48:150-155. [DOI] [PubMed] [Google Scholar]
- 76.Romieu I, Gouveia N, Cifuentes LA, de Leon AP, Junger W, Vera J, Strappa V, Hurtado‐Diaz M, Miranda‐Soberanis V, Rojas‐Bracho L, Carbajal‐Arroyo L, Tzintzun‐Cervantes G. Multicity study of air pollution and mortality in Latin America (the ESCALA study). Res Rep Health Eff Inst. 2012:5-86. [PubMed] [Google Scholar]
- 77.Faustini A, Stafoggia M, Cappai G, Forastiere F. Short‐term effects of air pollution in a cohort of patients with chronic obstructive pulmonary disease. Epidemiology. 2012; 23:861-879. [DOI] [PubMed] [Google Scholar]
- 78.Brook RD, Rajagopalan S, Pope CA, III, Brook JR, Bhatnagar A, Diez‐Roux AV, Holguin F, Hong Y, Luepker RV, Mittleman MA, Peters A, Siscovick D, Smith SC, Jr, Whitsel L, Kaufman JD. Particulate matter air pollution and cardiovascular disease: an update to the scientific statement from the American Heart Association. Circulation. 2010; 121:2331-2378. [DOI] [PubMed] [Google Scholar]
- 79.Lokken RP, Wellenius GA, Coull BA, Burger MR, Schlaug G, Suh HH, Mittleman MA. Air pollution and risk of stroke: underestimation of effect due to misclassification of time of event onset. Epidemiology. 2009; 20:137-142. [DOI] [PMC free article] [PubMed] [Google Scholar]
- 80.Johnsen SP, Overvad K, Sorensen HT, Tjonneland A, Husted SE. Predictive value of stroke and transient ischemic attack discharge diagnoses in the Danish National Registry of Patients. J Clin Epidemiol. 2002; 55:602-607. [DOI] [PubMed] [Google Scholar]