

Abstract
Background
There has been a paradigm shift in the definition of timing of early invasive strategy (EIS) for patients admitted with non‐ST‐elevation myocardial infarction (NSTEMI) in the last decade. Data on trends of EIS for NSTEMI and associated in‐hospital outcomes are limited. Our aim is to analyze temporal trends in the incidence, utilization of early invasive strategy, and in‐hospital outcomes of NSTEMI in the United States.
Methods and Results
We analyzed the 2002–2011 Nationwide Inpatient Sample databases to identify all patients ≥40 years of age with the principal diagnosis of acute myocardial infarction (AMI) and NSTEMI. Logistic regression was used for overall, age‐, sex‐, and race/ethnicity‐stratified trend analysis. From 2002 to 2011, we identified 6 512 372 patients with AMI. Of these, 3 981 119 (61.1%) had NSTEMI. The proportion of patients with NSTEMI increased from 52.8% in 2002 to 68.6% in 2011 (adjusted odds ratio [OR; per year], 1.055; 95% confidence interval [CI], 1.054 to 1.056) in the overall cohort. Similar trends were observed in age‐, sex‐, and race/ethnicity‐stratified groups. From 2002 to 2011, utilization of EIS at day 0 increased from 14.9% to 21.8% (Ptrend<0.001) and utilization of EIS at day 0 or 1 increased from 27.8% to 41.4% (Ptrend<0.001). Risk‐adjusted in‐hospital mortality in the overall cohort decreased during the study period (adjusted OR [per year], 0.976; 95% CI, 0.974 to 0.978).
Conclusions
There have been temporal increases in the proportion of NSTEMI and, consistent with guidelines, greater utilization of EIS. This has been accompanied by temporal decreases in in‐hospital mortality and length of stay.
Keywords: early invasive strategy, in‐hospital mortality, non‐ST‐elevation myocardial infarction, temporal trends
Introduction
Acute coronary syndromes (ACS) continue to be a major cause of morbidity and mortality.1 Data from the United States and Europe have reported a decrease in the incidence of ST‐elevation myocardial infarction (STEMI) with an increase in non‐ST‐elevation myocardial infarction (NSTEMI) in the past decade.2–6 Current 2012 American College of Cardiology/American Heart Association (ACC/AHA) guidelines recommend early invasive strategy (EIS) for management of patients with NSTEMI and refractory angina or electrical or hemodynamic insufficiency (class IB), initially stabilized patients with NSTEMI, and high risk of clinical events (class IA). The early invasive approach (within 12 to 24 hours of presentation) to reduce ischemic complications is also recommended in initially stabilized high‐risk patients with NSTEMI (class IIA).7 The optimal timing of EIS has been debated and undergone a paradigm shift in the last decade. The transition from 48 hours to within 24 hours occurred after the publication of the Timing of Intervention in Acute Coronary Syndromes (TIMACS) trial in 2009.8–9 However, there is a paucity of information with regard to the secular trends in utilization of EIS in patients with NSTEMI and how this may vary among different NSTEMI patient populations. Using a large nationwide administrative database, the present study aimed to analyze and describe age‐, sex‐, and race/ethnicity‐specific trends in the incidence, utilization of EIS, and in‐hospital outcomes for NSTEMI in the United States from 2002 to 2011.
Methods
Data Source
Data were obtained from the 2002 to 2011 Nationwide Inpatient Sample (NIS) databases. The NIS, sponsored by the Agency for Healthcare Research and Quality as a part of the Healthcare Cost and Utilization Project (HCUP), is the largest publicly available all‐payer inpatient care database in the United States. It contains discharge‐level data from ≈8 million hospital stays from approximately 1000 hospitals designed to approximate a 20% stratified sample of all community hospitals in the United States. Criteria used for stratified sampling of hospitals include hospital ownership, bed size, teaching status, urban or rural location, and geographic region. Discharge weights are provided for each patient discharge record, which were used to obtain national estimates. Discharge weights are calculated for NIS data by first stratifying the NIS hospitals on the same variables used for creating the sample. A weight is then calculated for each stratum by dividing the number of universe discharges in that stratum (obtained from American Hospital Association data) by the number of NIS discharges in the stratum. Weighted estimates are calculated by uniformly applying stratum weights to the discharges according to the stratum from which the discharge was drawn. Weights are assigned to each discharge and are stored in each record in the data element, DISCWT. When the discharge weights are applied to the unweighted NIS data, the result is an estimate of the number of discharges for all inpatient discharges from community hospitals in the United States. This study was deemed exempt by the New York Medical College Institutional Review Board (Valhalla, NY) because HCUP‐NIS is a public database with no personal identifying information.
Study Population
We used the International Classification of Diseases, Ninth Edition, Clinical Modification (ICD‐9‐CM), codes 410.xx to identify all patients ≥40 years of age with the principal diagnosis of acute myocardial infarction (AMI; N=6 512 372). Patients with the principal diagnosis of NSTEMI were then identified using ICD‐9‐CM codes 410.7x (n=3 981 119). We chose the principal diagnosis because it is considered the primary reason for hospital admission. EIS was defined as coronary angiography (ICD‐9‐CM procedure codes 88.55, 88.66, 37.22, or 37.23) with or without revascularization (ie, percutaneous coronary intervention (PCI; ICD‐9‐CM procedure codes 00.66, 36.01, 36.02, 36.05, 36.06 and 36.07) or coronary artery bypass graft surgery (CABG; ICD‐9‐CM procedure code 36.1x) on day 0 (considered within 24 hours of admission) or on days 0 or 1 (considered within 48 hours of admission).
Outcomes Measured
We initially studied the overall age‐, sex‐, and race/ethnicity‐specific trends in the incidence of NSTEMI. We then examined the trends in utilization of the EIS in patients with NSTEMI. Our primary outcome of interest was all‐cause, in‐hospital mortality, defined as death during the hospitalization encounter in the NIS database. We used the average length of stay and total hospital cost as secondary outcomes. We analyzed the overall age‐, sex‐, and race/ethnicity‐specific trends in utilization of the EIS, risk‐adjusted in‐hospital mortality, average length of stay, and total hospital cost in patients with NSTEMI. The NIS provides total charges, which reflect the amount a hospital billed for services, rather than actual costs or the amount a hospital received in payment. In this study, we used the HCUP Cost‐to‐Charge Ratio File developed by the Agency for Healthcare Research and Quality (AHRQ) to translate total charges into costs. Each file contains hospital‐specific cost‐to‐charge ratios based on all‐payer inpatient cost for nearly every hospital in the NIS databases. Cost information is obtained from the hospital accounting reports collected by the Centers for Medicare and Medicaid Services.
Patient and Hospital Characteristics
Baseline patient characteristics used included demographics (age, sex, race/ethnicity, primary expected payer, weekday versus weekend admission), 29 Elixhauser co‐morbidities as defined by the AHRQ and other clinically relevant comorbidities (smoking, dyslipidemia, known coronary artery disease [CAD], family history of CAD, previous myocardial infarction [MI], previous transient ischemic attack or stroke, previous PCI, previous CABG, carotid artery disease, dementia, and atrial fibrillation). A list of ICD‐9‐CM and Clinical Classifications Software codes used to identify comorbidities and in‐hospital procedures is provided in Table 1. Hospital characteristics, such as hospital region (Northeast, Midwest, South, and West), bed size (small, medium, and large), location (rural or urban), and teaching status were also included.
Table 1.
International Classification of Diseases, Ninth Edition, Clinical Modification (ICD‐9‐CM) and Clinical Classifications Software (CCS) Codes Used to Identify Comorbidities
| Comorbidities | Source | Code(s) |
|---|---|---|
| Smoking | ICD‐9‐CM | V15.82, 305.1 |
| Dyslipidemia | CCS | 53 |
| Coronary artery disease | ICD‐9‐CM | 414.00‐414.07 |
| Family history of coronary artery disease | ICD‐9‐CM | V17.3 |
| Previous myocardial infarction | ICD‐9‐CM | 412 |
| Previous transient ischemic attack/stroke | ICD‐9‐CM | V12.54 |
| Previous percutaneous coronary intervention | ICD‐9‐CM | V45.82 |
| Previous coronary artery bypass grafting | ICD‐9‐CM | V45.81 |
| Carotid artery disease | ICD‐9‐CM | 433.10 |
| Atrial fibrillation | ICD‐9‐CM | 427.31 |
| Dementia | ICD‐9‐CM | 290.xx, 294.1x, 294.2x, 294.8, 331.0‐331.12, 331.82, 797 |
Statistical Analysis
Weighted data were used for all statistical analyses. For trend analysis, we used Mantel‐Haenszel's chi‐square (χ2) test of linear association for categorical variables and linear regression for continuous variables. To assess whether the incidence of NSTEMI, utilization of EIS, or in‐hospital mortality has changed over time, unadjusted and multivariable adjusted logistic regression models were constructed. Our independent variable, calendar year, was initially entered as a continuous variable in the regression models to obtain unadjusted and adjusted odds ratios (ORs; per year) for the temporal trends. To determine whether there was a temporal variability from year to year in the incidence of NSTEMI, utilization of EIS, or in‐hospital mortality, we also evaluated calendar year as a categorical variable, with 2002 as the reference year. The regression models adjusted for all demographics (except sex and race/ethnicity for sex and race/ethnicity‐specific trends, respectively), hospital characteristics, and all Elixhauser and other clinically relevant comorbidities. The methodology has been utilized in our previous analysis of NIS databases.10–11 We graphically displayed the unadjusted and adjusted ORs and 95% confidence intervals (CIs) for incidence of NSTEMI, utilization of EIS for NSTEMI, or in‐hospital mortality over time.
Statistical analysis was performed using IBM SPSS Statistics 20.0 (IBM Corp., Armonk, NY). All P values were 2 sided with a significance threshold of P<0.001 (a lower‐than‐usual P‐value threshold was selected to correct for the effects of a large sample size as well as inflation of type I error because of repeated testing using a large number of variables). Categorical variables are expressed as percentage and continuous variables as mean± SEM. OR, and 95% CI were used to report the results of logistic regression.
Results
Temporal Trends in NSTEMI
From 2002 to 2011, we identified 6 512 372 patients ≥40 years of age admitted with AMI. Of these, 3 981 119 (61.1%) had NSTEMI. Among patients with AMI, the proportion of those presenting with NSTEMI increased from 52.8% in 2002 to 68.6% in 2011 (Ptrend<0.001). After adjusting for baseline demographics, hospital characteristics, and comorbidities, we observed an increasing trend in the proportion of patients hospitalized with NSTEMI from 2002 to 2011 (adjusted OR [per year], 1.055; 95% CI, 1.054 to 1.056; P<0.001; Figure 1; Table 2).
Figure 1.
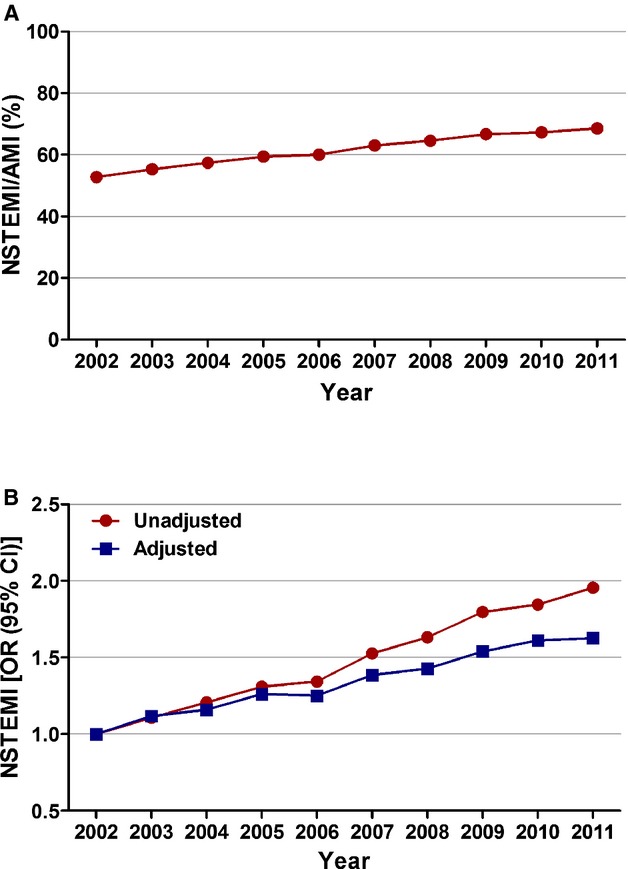
Temporal trends in incidence of non‐ST‐elevation myocardial infarction (STEMI). A, NSTEMI (%) was calculated as the number of patients with NSTEMI divided by the number of patients with acute myocardial infarction (AMI) per year×100; Ptrend<0.001. B, Trends in NSTEMI presented as unadjusted and adjusted odds ratio and 95% confidence interval (CI) for each year relative to 2002 (reference year). Regression model adjusted for demographics, hospital characteristics, and 29 Elixhauser and other clinically relevant comorbidities. 95% CIs are depicted, but are too narrow to be visualized outside the marker width.
Table 2.
Adjusted Temporal Trends of Proportion of Non‐ST‐Elevation Myocardial Infarction: Overall Cohort, Age, Sex, and Race/Ethnicity Stratified
| 2002 | 2003 | 2004 | 2005 | 2006 | 2007 | 2008 | 2009 | 2010 | 2011 | Adjusted OR (Per Year) | |
|---|---|---|---|---|---|---|---|---|---|---|---|
| Overall | 1.00 | 1.12 (1.11 to 1.13) | 1.16 (1.15 to 1.17) | 1.26 (1.25 to 1.27) | 1.25 (1.24 to 1.26) | 1.39 (1.37 to 1.40) | 1.43 (1.42 to 1.44) | 1.54 (1.53 to 1.55) | 1.61 (1.60 to 1.63) | 1.63 (1.61 to 1.64) | 1.055 (1.054 to 1.056) |
| Age, y | |||||||||||
| 40 to 64 | 1.00 | 1.10 (1.08 to 1.11) | 1.17 (1.15 to 1.18) | 1.26 (1.25 to 1.28) | 1.24 (1.23 to 1.26) | 1.35 (1.33 to 1.37) | 1.36 (1.34 to 1.38) | 1.48 (1.46 to 1.50) | 1.50 (1.48 to 1.53) | 1.50 (1.48 to 1.52) | 1.045 (1.044 to 1.046) |
| 65 to 74 | 1.00 | 1.12 (1.10 to 1.14) | 1.17 (1.15 to 1.19) | 1.26 (1.24 to 1.29) | 1.25 (1.23 to 1.27) | 1.46 (1.44 to 1.49) | 1.41 (1.39 to 1.44) | 1.54 (1.51 to 1.57) | 1.63 (1.60 to 1.66) | 1.65 (1.62 to 1.68) | 1.056 (1.055 to 1.058) |
| ≥75 | 1.00 | 1.14 (1.12 to 1.16) | 1.15 (1.13 to 1.16) | 1.26 (1.24 to 1.28) | 1.27 (1.25 to 1.29) | 1.39 (1.37 to 1.41) | 1.52 (1.50 to 1.55) | 1.62 (1.60 to 1.64) | 1.74 (1.71 to 1.76) | 1.80 (1.77 to 1.83) | 1.066 (1.065 to 1.068) |
| Sex | |||||||||||
| Men | 1.00 | 1.12 (1.11 to 1.14) | 1.16 (1.15 to 1.17) | 1.25 (1.24 to 1.27) | 1.22 (1.21 to 1.24) | 1.33 (1.32 to 1.35) | 1.37 (1.35 to 1.38) | 1.46 (1.44 to 1.47) | 1.52 (1.50 to 1.53) | 1.53 (1.51 to 1.54) | 1.046 (1.045 to 1.047) |
| Women | 1.00 | 1.11 (1.09 to 1.12) | 1.15 (1.14 to 1.17) | 1.27 (1.25 to 1.29) | 1.29 (1.27 to 1.31) | 1.47 (1.45 to 1.49) | 1.52 (1.50 to 1.54) | 1.67 (1.65 to 1.70) | 1.77 (1.75 to 1.80) | 1.80 (1.78 to 1.83) | 1.070 (1.069 to 1.071) |
| Race/ethnicity | |||||||||||
| White | 1.00 | 1.12 (1.11 to 1.13) | 1.16 (1.15 to 1.17) | 1.25 (1.24 to 1.26) | 1.23 (1.22 to 1.24) | 1.37 (1.36 to 1.38) | 1.41 (1.40 to 1.43) | 1.53 (1.52 to 1.55) | 1.60 (1.58 to 1.62) | 1.63 (1.61 to 1.64) | 1.055 (1.054 to 1.055) |
| African American | 1.00 | 1.04 (1.01 to 1.07) | 1.11 (1.08 to 1.14) | 1.24 (1.20 to 1.28) | 1.31 (1.27 to 1.35) | 1.45 (1.41 to 1.49) | 1.47 (1.43 to 1.52) | 1.50 (1.45 to 1.54) | 1.83 (1.78 to 1.89) | 1.75 (1.70 to 1.80) | 1.070 (1.068 to 1.073) |
| Hispanic | 1.00 | 1.24 (1.20 to 1.28) | 1.26 (1.22 to 1.30) | 1.38 (1.33 to 1.42) | 1.43 (1.39 to 1.48) | 1.46 (1.41 to 1.50) | 1.60 (1.54 to 1.65) | 1.74 (1.69 to 1.80) | 1.59 (1.54 to 1.64) | 1.78 (1.73 to 1.84) | 1.056 (1.053 to 1.059) |
| Asian/Pacific Islander | 1.00 | 1.09 (1.03 to 1.16) | 1.20 (1.13 to 1.27) | 1.32 (1.24 to 1.41) | 1.23 (1.16 to 1.31) | 1.67 (1.58 to 1.78) | 1.56 (1.47 to 1.65) | 1.51 (1.42 to 1.60) | 1.63 (1.53 to 1.73) | 1.48 (1.40 to 1.57) | 1.051 (1.046 to 1.056) |
Multivariable adjustment for baseline demographics, hospital characteristics, and 29 Elixhauser and other clinically relevant comorbidities as outlined in the methodology. Adjusted odds ratios (OR; per year) for trend were determined using logistic regression models evaluating calendar year as a continuous variable. Numbers in parenthesis represent 95% confidence interval.
The increase in proportion of NSTEMI was observed in all age groups. During the study period, it increased from 45.4% to 60.2% in those 40 to 64 years of age (adjusted OR [per year], 1.045; 95% CI, 1.044 to 1.046; P<0.001), from 54.5% to 70.7% in those 65 to 74 (adjusted OR [per year], 1.056; 95% CI, 1.055 to 1.058; P<0.001), and from 59% to 77.1% in patients ≥75 (adjusted OR [per year], 1.066; 95% CI, 1.065 to 1.068; P<0.001). When stratified according to sex, women (56.1% to 73.6%; adjusted OR [per year], 1.070; 95% CI, 1.069 to 1.071; P<0.001) had a steeper proportional increase, compared to men (50.4% to 65.3%; adjusted OR [per year], 1.046; 95% CI, 1.045 to 1.047; P<0.001). Increase in NSTEMI proportions were also observed across all races. African‐American patients showed the greatest proportional increase (Figure 2; Table 2).
Figure 2.
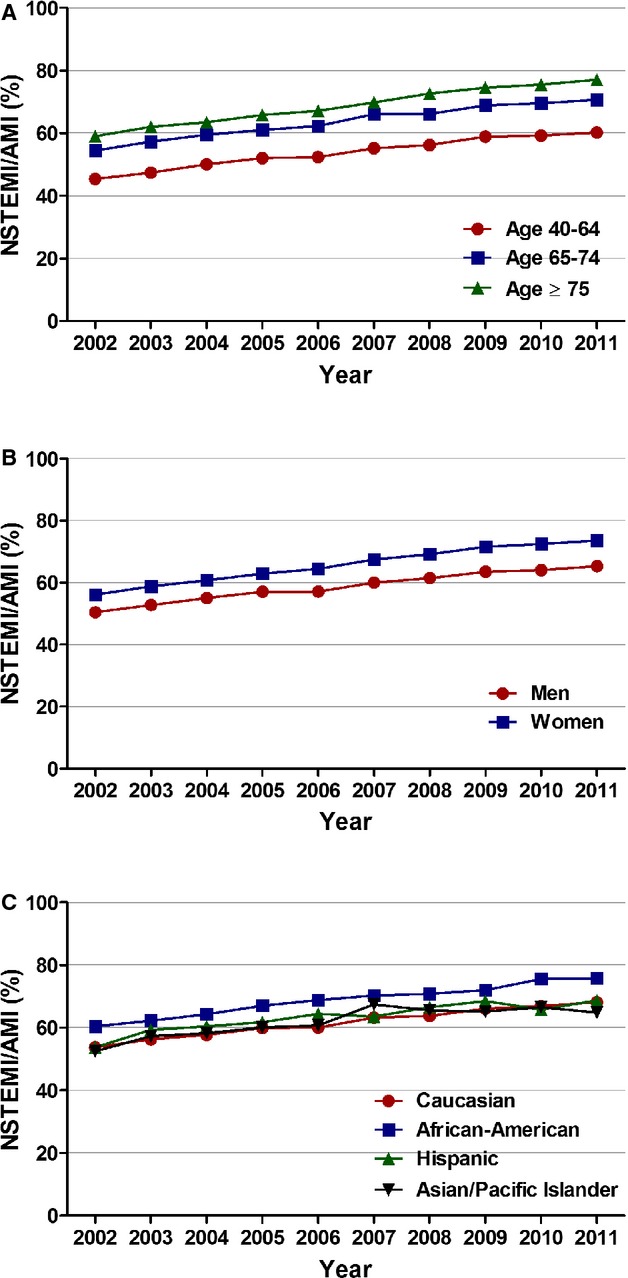
Age, sex, and race/ethnicity specific trends in incidence rates of non‐ST‐elevation myocardial infarction. A, Age stratified; Ptrend<0.001, (B) sex stratified; Ptrend<0.001, and (C) race/ethnicity stratified; Ptrend<0.001. AMI indicates acute myocardial infarction; NSTEMI, non‐ST‐elevation myocardial infarction.
Changing Baseline Characteristics of Patients With NSTEMI
Table 3 depicts the baseline demographic, hospital, and clinical characteristics of patients admitted with NSTEMI from 2002 to 2011. There was a slight decrease in mean age at admission during the study period (70.36±13.11 years in 2002 versus 69.87±13.53 in 2011; P<0.001). More specifically, there was an increase in the proportion of NSTEMI patients aged 40 to 64 years and decrease in those aged ≥75 years from 2002 to 2011 (Ptrend<0.001). Similarly, there was a small, but statistically significant, increase in the proportion of men (56% in 2002 to 57.5% in 2011; Ptrend<0.001) and a consequent decrease in the proportion of women (44.0% in 2002 to 42.5% in 2011; Ptrend<0.001) with NSTEMI during the study period. The prevalence of smoking, dyslipidemia, CAD, previous MI, carotid artery disease, diabetes mellitus, hypertension, obesity, peripheral vascular disease, chronic renal failure, alcohol abuse, deficiency anemias, coagulopathy, fluid/electrolyte disorders, and previous PCI increased from 2002 to 2011 (Ptrend<0.001 for all). The prevalence of heart failure and chronic pulmonary diseases remained relatively constant throughout the study period.
Table 3.
Baseline Demographics, Hospital Characteristics, Comorbidities, Utilization of Early Invasive Strategy, and Overall In‐Hospital Mortality in Patients With Non‐ST‐Elevation Myocardial Infarction
| Variable | 2002 | 2003 | 2004 | 2005 | 2006 | 2007 | 2008 | 2009 | 2010 | 2011 | P Value |
|---|---|---|---|---|---|---|---|---|---|---|---|
| No. of cases (weighted) | 393 937 | 405 415 | 390 093 | 384 392 | 395 477 | 384 373 | 406 566 | 412 679 | 397 624 | 410 563 | — |
| Age (mean, y) | 70.36 | 70.40 | 70.29 | 70.32 | 69.83 | 69.90 | 70.19 | 69.66 | 69.72 | 69.87 | <0.001 |
| Age‐stratified cases, y (% of total) | <0.001 | ||||||||||
| 40 to 64 | 32.8 | 33.3 | 33.8 | 34.4 | 36.0 | 36.0 | 35.4 | 37.0 | 37.2 | 36.7 | |
| 65 to 74 | 24.1 | 23.3 | 23.4 | 22.4 | 22.4 | 22.8 | 22.4 | 23.0 | 22.9 | 23.4 | |
| ≥75 | 43.1 | 43.4 | 42.8 | 43.3 | 41.6 | 41.2 | 42.2 | 40.0 | 39.9 | 39.9 | |
| Gender, % | <0.001 | ||||||||||
| Men | 56.0 | 56.1 | 56.4 | 56.5 | 56.8 | 56.4 | 56.4 | 57.2 | 57.1 | 57.5 | |
| Women | 44.0 | 43.9 | 43.6 | 43.5 | 43.2 | 43.6 | 43.6 | 42.8 | 42.9 | 42.5 | |
| Race, % | <0.001 | ||||||||||
| White | 79.2 | 77.4 | 78.3 | 79.6 | 77.4 | 76.2 | 77.0 | 76.1 | 75.4 | 74.8 | |
| African American | 9.2 | 9.3 | 9.7 | 7.8 | 9.4 | 10.6 | 9.6 | 9.7 | 12.3 | 11.7 | |
| Hispanic | 6.5 | 8.5 | 7.0 | 7.5 | 7.9 | 7.1 | 6.6 | 7.3 | 6.8 | 7.9 | |
| Asian/Pacific Islander | 1.8 | 2.1 | 2.1 | 1.7 | 1.9 | 2.4 | 2.4 | 2.1 | 2.3 | 2.0 | |
| Other | 3.2 | 2.7 | 2.8 | 3.5 | 3.4 | 3.8 | 4.8 | 3.3 | 3.4 | 3.5 | |
| Primary expected payer, % | <0.001 | ||||||||||
| Medicare | 65.7 | 66.4 | 64.8 | 65.5 | 63.5 | 62.8 | 62.9 | 62.3 | 62.3 | 64.0 | |
| Medicaid | 4.0 | 4.6 | 4.5 | 4.9 | 4.7 | 4.7 | 5.1 | 5.6 | 6.1 | 5.7 | |
| Private insurance | 25.3 | 23.8 | 24.6 | 23.7 | 25.0 | 25.2 | 24.7 | 24.1 | 23.8 | 22.6 | |
| Uninsured | 2.8 | 3.0 | 3.7 | 3.8 | 4.0 | 4.3 | 4.3 | 5.1 | 5.0 | 4.8 | |
| Other | 2.2 | 2.2 | 2.4 | 2.2 | 2.8 | 3.0 | 3.0 | 2.9 | 2.8 | 2.9 | |
| Weekend admission, % | 24.8 | 24.3 | 24.7 | 24.8 | 24.3 | 24.7 | 25.6 | 25.3 | 25.7 | 25.7 | <0.001 |
| Hospital characteristics | |||||||||||
| Region, % | <0.001 | ||||||||||
| Northeast | 24.1 | 23.6 | 23.3 | 24.1 | 23.1 | 21.7 | 19.0 | 20.6 | 20.5 | 19.6 | |
| Midwest | 21.1 | 23.0 | 23.3 | 20.4 | 21.9 | 23.0 | 24.7 | 22.2 | 24.8 | 21.7 | |
| South | 39.5 | 38.8 | 37.7 | 39.8 | 40.5 | 39.3 | 40.1 | 41.3 | 38.2 | 40.5 | |
| West | 15.4 | 14.6 | 15.7 | 15.7 | 14.5 | 16.0 | 16.2 | 15.9 | 16.5 | 18.2 | |
| Bed size, % | <0.001 | ||||||||||
| Small | 9.4 | 9.7 | 10.2 | 7.0 | 11.1 | 9.4 | 10.3 | 8.9 | 10.1 | 9.9 | |
| Medium | 24.4 | 25.0 | 23.7 | 24.6 | 25.1 | 25.2 | 23.1 | 21.9 | 21.8 | 24.1 | |
| Large | 66.2 | 65.3 | 66.1 | 68.4 | 63.8 | 65.4 | 66.7 | 69.1 | 68.1 | 66.0 | |
| Urban location | 86.6 | 86.8 | 89.1 | 89.9 | 90.7 | 89.2 | 88.7 | 89.6 | 88.1 | 89.8 | <0.001 |
| Teaching hospital | 43.8 | 44.4 | 46.8 | 45.4 | 51.1 | 49.3 | 45.4 | 47.3 | 46.5 | 47.9 | <0.001 |
| Comorbidities, % | |||||||||||
| Smoking | 20.5 | 20.1 | 21.6 | 23.9 | 25.4 | 27.0 | 27.9 | 31.8 | 33.0 | 35.0 | <0.001 |
| Dyslipidemia | 35.6 | 36.5 | 40.3 | 43.8 | 47.4 | 50.6 | 52.4 | 56.4 | 59.2 | 62.1 | <0.001 |
| CAD | 68.2 | 68.8 | 69.6 | 70.5 | 72.0 | 72.0 | 72.9 | 76.2 | 75.9 | 77.4 | <0.001 |
| Family h/o CAD | 3.3 | 3.2 | 4.0 | 4.9 | 5.0 | 5.7 | 6.0 | 7.3 | 8.2 | 8.3 | <0.001 |
| Previous myocardial infarction | 8.9 | 8.5 | 9.1 | 9.0 | 9.7 | 10.2 | 10.5 | 11.6 | 12.3 | 13.1 | <0.001 |
| Previous TIA/stroke* | — | — | — | — | — | 0.8 | 4.4 | 5.9 | 6.7 | 7.4 | <0.001 |
| Previous PCI | 7.0 | 7.0 | 7.2 | 7.8 | 9.1 | 10.0 | 10.7 | 12.4 | 13.5 | 15.5 | <0.001 |
| Previous CABG | 9.2 | 8.9 | 8.6 | 8.3 | 8.5 | 8.4 | 8.8 | 9.7 | 9.8 | 10.9 | <0.001 |
| CAD | 1.3 | 1.3 | 1.3 | 1.4 | 1.6 | 1.8 | 2.1 | 2.4 | 2.4 | 2.7 | <0.001 |
| Atrial fibrillation | 18.5 | 18.5 | 18.4 | 18.9 | 19.0 | 18.5 | 17.1 | 17.8 | 18.1 | 19.2 | <0.001 |
| Dementia | 5.1 | 5.4 | 5.5 | 5.8 | 6.0 | 6.2 | 7.1 | 7.1 | 7.3 | 7.8 | <0.001 |
| AIDS | 0.1 | 0.1 | 0.1 | 0.1 | 0.1 | 0.1 | 0.1 | 0.2 | 0.2 | 0.1 | <0.001 |
| Alcohol abuse | 1.8 | 1.8 | 2.0 | 2.1 | 2.4 | 2.4 | 2.5 | 2.7 | 2.8 | 2.8 | <0.001 |
| Deficiency anemias | 11.9 | 12.6 | 12.4 | 12.7 | 13.5 | 15.8 | 17.7 | 18.3 | 18.5 | 20.3 | <0.001 |
| RA/collagen vascular diseases | 1.8 | 1.7 | 1.8 | 1.9 | 2.0 | 2.1 | 2.3 | 2.3 | 2.4 | 2.6 | <0.001 |
| Chronic blood loss anemia | 1.6 | 1.6 | 1.6 | 1.7 | 1.7 | 1.7 | 1.3 | 1.2 | 1.0 | 1.0 | <0.001 |
| Congestive heart failure | 35.2 | 36.1 | 37.0 | 36.6 | 34.6 | 34.6 | 34.0 | 34.4 | 34.9 | 35.5 | <0.001 |
| Chronic pulmonary disease | 22.2 | 22.2 | 22.2 | 23.3 | 23.0 | 23.5 | 22.9 | 22.9 | 22.5 | 23.6 | <0.001 |
| Coagulopathy | 2.8 | 3.1 | 3.4 | 3.4 | 3.5 | 3.9 | 3.8 | 4.6 | 4.8 | 5.5 | <0.001 |
| Depression | 3.9 | 4.3 | 4.4 | 4.9 | 5.3 | 6.0 | 6.7 | 7.1 | 7.5 | 8.1 | <0.001 |
| Diabetes (uncomplicated) | 27.0 | 27.7 | 27.5 | 27.3 | 28.4 | 29.1 | 29.6 | 30.4 | 30.9 | 31.8 | <0.001 |
| Diabetes (complicated) | 6.1 | 6.1 | 6.0 | 6.1 | 6.0 | 6.9 | 7.1 | 7.0 | 7.3 | 8.3 | <0.001 |
| Drug abuse | 0.7 | 0.8 | 1.0 | 1.2 | 1.4 | 1.5 | 1.4 | 1.7 | 1.8 | 1.9 | <0.001 |
| Hypertension | 51.0 | 59.3 | 61.0 | 62.4 | 65.5 | 66.7 | 69.3 | 71.2 | 72.6 | 74.3 | <0.001 |
| Hypothyroidism | 7.8 | 8.1 | 8.0 | 8.5 | 8.7 | 9.8 | 10.9 | 11.0 | 11.4 | 12.4 | <0.001 |
| Liver disease | 0.7 | 0.7 | 0.9 | 0.9 | 0.9 | 1.1 | 1.1 | 1.2 | 1.3 | 1.4 | <0.001 |
| Lymphoma | 0.5 | 0.4 | 0.5 | 0.5 | 0.5 | 0.5 | 0.6 | 0.5 | 0.5 | 0.6 | <0.001 |
| Fluid and electrolyte disorder | 14.5 | 15.5 | 16.3 | 17.5 | 17.7 | 18.9 | 20.4 | 20.5 | 20.9 | 22.6 | <0.001 |
| Metastatic cancer | 0.8 | 0.7 | 0.9 | 0.9 | 0.9 | 1.0 | 1.0 | 1.0 | 0.9 | 1.0 | <0.001 |
| Other neurological disorders | 5.6 | 5.1 | 5.1 | 5.3 | 5.6 | 6.1 | 6.7 | 6.7 | 6.5 | 6.9 | <0.001 |
| Obesity | 6.6 | 6.7 | 7.0 | 7.6 | 8.1 | 9.5 | 11.1 | 12.4 | 12.1 | 14.2 | <0.001 |
| Paralysis | 1.9 | 1.8 | 1.7 | 1.6 | 1.7 | 1.8 | 2.3 | 1.9 | 1.9 | 2.0 | <0.001 |
| Peripheral vascular disease | 9.5 | 9.7 | 10.2 | 10.0 | 10.9 | 12.2 | 12.7 | 13.3 | 12.7 | 14.2 | <0.001 |
| Psychoses | 1.3 | 1.4 | 1.4 | 1.4 | 1.5 | 1.7 | 2.2 | 2.2 | 2.4 | 2.7 | <0.001 |
| Pulmonary circulation disorders | 0.1 | 0.1 | 0.1 | 0.1 | 0.1 | 0.1 | 0.2 | 0.2 | 0.2 | 0.2 | <0.001 |
| Renal failure (chronic) | 8.5 | 9.4 | 9.6 | 11.9 | 17.9 | 20.4 | 20.1 | 21.6 | 22.8 | 24.8 | <0.001 |
| Solid tumor without metastasis | 6.7 | 1.4 | 1.5 | 1.5 | 1.5 | 1.6 | 1.6 | 1.6 | 1.6 | 1.6 | <0.001 |
| Peptic ulcer (nonbleeding) | 1.5 | 0.1 | 0.1 | 0.0 | 0.0 | 0.0 | 0.0 | 0.0 | 0.0 | 0.0 | <0.001 |
| Valvular disease | 0.4 | 0.3 | 0.3 | 0.3 | 0.3 | 0.3 | 0.3 | 0.3 | 0.3 | 0.3 | <0.001 |
| Weight loss | 1.1 | 1.3 | 1.4 | 1.4 | 1.5 | 1.8 | 2.4 | 2.7 | 2.6 | 3.3 | <0.001 |
| Invasive strategy, % | |||||||||||
| Day 0 | 14.9 | 15.5 | 17.0 | 18.2 | 21.0 | 20.0 | 19.8 | 23.1 | 21.9 | 21.8 | <0.001 |
| Day 0 or 1 | 27.8 | 29.2 | 31.1 | 33.3 | 36.4 | 35.2 | 35.3 | 41.1 | 40.9 | 41.4 | <0.001 |
| In‐hospital mortality, % | 5.5 | 5.5 | 5.2 | 4.9 | 4.6 | 4.4 | 4.4 | 4.1 | 4.0 | 3.9 | <0.001 |
AIDS indicates acquired immunodeficiency syndrome; CABG, coronary artery bypass graft surgery; CAD, coronary artery disease; h/o, history of; PCI, percutaneous coronary intervention; RA, rheumatoid arthritis; TIA, transient ischemic attack.
Data for previous transient ischemic attack/stroke were available from 2007.
Trends in EIS
Utilization of EIS on day 0 of presentation increased from 14.9% in 2002 to 21.8% in 2011 (adjusted OR [per year], 1.065; 95% CI, 1.064 to 1.066; P<0.001). The adjusted temporal trends for utilization of EIS were similar across all age, sex, and racial/ethnic groups. Patients ≥75 years of age had the highest proportional increase in utilization of EIS (adjusted OR [per year], 1.072; 95% CI, 1.069 to 1.074; P<0.001; Figures 3 and 4; Table 4).
Figure 3.
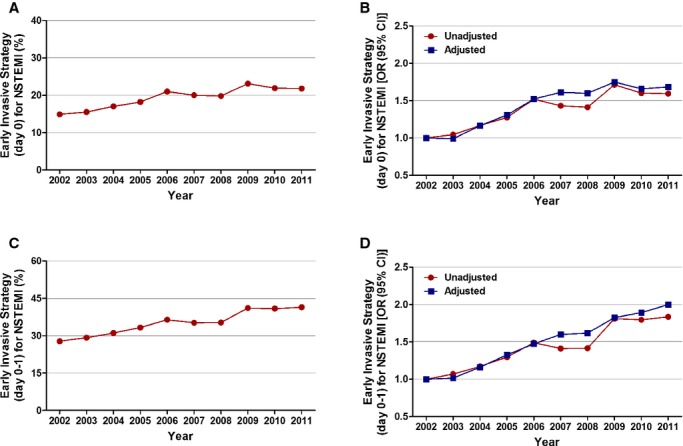
Trends in utilization of early invasive strategy for non‐ST‐elevation myocardial infarction. A, Early invasive strategy at day 0; Ptrend<0.001. B, Trends in early invasive strategy at day 0 presented as unadjusted and adjusted odds ratio and 95% confidence interval (CI) for each year relative to 2002 (reference year). Regression model adjusted for demographics, hospital characteristics, and 29 Elixhauser and other clinically relevant comorbidities. C, Early invasive strategy at day 0 or 1; Ptrend<0.001. D, Trends in early invasive strategy at day 0 or 1 presented as unadjusted and adjusted odds ratio and 95% confidence interval (CI) for each year relative to 2002 (reference year). Regression model adjusted for demographics, hospital characteristics, and 29 Elixhauser and other clinically relevant comorbidities. 95% CIs are depicted, but are too narrow to be visualized outside the marker width. NSTEMI indicates non‐ST‐elevation myocardial infarction.
Figure 4.
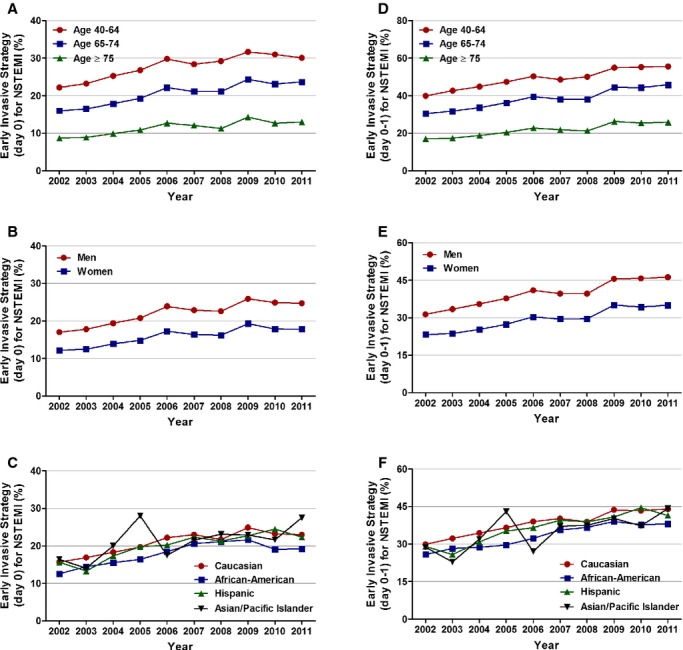
Age, sex, and race/ethnicity specific trends in utilization of early invasive strategy (EIS) for non‐ST‐elevation myocardial infarction. A, Age stratified, EIS day 0; Ptrend<0.001, (B) sex stratified, EIS day 0; Ptrend<0.001, (C) race/ethnicity stratified, EIS day 0; Ptrend<0.001, (D) age stratified, EIS day 0 or 1; Ptrend<0.001, (E) sex stratified, EIS day 0 or 1; Ptrend<0.001, and (F) race/ethnicity stratified, EIS day 0 or 1; Ptrend<0.001. NSTEMI indicates non‐ST‐elevation myocardial infarction.
Table 4.
Adjusted Temporal Trends of Non‐ST‐Elevation Myocardial Infarction With Utilization of the Early Invasive Strategy at Day 0: Overall Cohort, Age, Sex, and Race/Ethnicity Stratified
| 2002 | 2003 | 2004 | 2005 | 2006 | 2007 | 2008 | 2009 | 2010 | 2011 | Adjusted OR (Per Year) | |
|---|---|---|---|---|---|---|---|---|---|---|---|
| Overall | 1.00 | 0.99 (0.97 to 1.01) | 1.17 (1.15 to 1.18) | 1.31 (1.29 to 1.33) | 1.52 (1.50 to 1.54) | 1.61 (1.59 to 1.64) | 1.60 (1.58 to 1.62) | 1.75 (1.72 to 1.77) | 1.66 (1.63 to 1.68) | 1.68 (1.66 to 1.71) | 1.065 (1.064 to 1.066) |
| Age, y | |||||||||||
| 40 to 64 | 1.00 | 1.00 (0.98 to 1.02) | 1.22 (1.19 to 1.24) | 1.34 (1.31 to 1.37) | 1.52 (1.49 to 1.56) | 1.62 (1.59 to 1.66) | 1.71 (1.67 to 1.75) | 1.77 (1.73 to 1.80) | 1.75 (1.71 to 1.79) | 1.73 (1.70 to 1.77) | 1.068 (1.066 to 1.070) |
| 65 to 74 | 1.00 | 1.00 (0.97 to 1.03) | 1.12 (1.08 to 1.15) | 1.24 (1.21 to 1.28) | 1.49 (1.44 to 1.53) | 1.57 (1.52 to 1.61) | 1.52 (1.48 to 1.57) | 1.68 (1.63 to 1.73) | 1.58 (1.53 to 1.62) | 1.64 (1.59 to 1.69) | 1.061 (1.059 to 1.064) |
| ≥75 | 1.00 | 0.97 (0.95 to 1.00) | 1.16 (1.12 to 1.19) | 1.37 (1.33 to 1.40) | 1.60 (1.56 to 1.65) | 1.73 (1.68 to 1.78) | 1.58 (1.53 to 1.62) | 1.90 (1.85 to 1.95) | 1.70 (1.66 to 1.75) | 1.77 (1.72 to 1.82) | 1.072 (1.069 to 1.074) |
| Sex | |||||||||||
| Men | 1.00 | 0.99 (0.97 to 1.01) | 1.15 (1.13 to 1.17) | 1.32 (1.29 to 1.34) | 1.52 (1.49 to 1.54) | 1.62 (1.59 to 1.65) | 1.62 (1.59 to 1.65) | 1.75 (1.72 to 1.78) | 1.68 (1.65 to 1.71) | 1.71 (1.68 to 1.75) | 1.067 (1.066 to 1.069) |
| Women | 1.00 | 0.99 (0.96 to 1.01) | 1.19 (1.16 to 1.22) | 1.30 (1.26 to 1.33) | 1.53 (1.50 to 1.57) | 1.60 (1.56 to 1.64) | 1.56 (1.53 to 1.60) | 1.75 (1.71 to 1.79) | 1.63 (1.59 to 1.67) | 1.63 (1.60 to 1.67) | 1.061 (1.059 to 1.063) |
| Race/ethnicity | |||||||||||
| White | 1.00 | 1.01 (0.99 to 1.03) | 1.19 (1.17 to 1.21) | 1.31 (1.28 to 1.33) | 1.53 (1.51 to 1.56) | 1.66 (1.63 to 1.68) | 1.59 (1.57 to 1.62) | 1.84 (1.81 to 1.87) | 1.71 (1.68 to 1.74) | 1.72 (1.69 to 1.75) | 1.068 (1.067 to 1.070) |
| African American | 1.00 | 1.15 (1.09 to 1.22) | 1.31 (1.24 to 1.38) | 1.39 (1.31 to 1.47) | 1.63 (1.55 to 1.72) | 1.87 (1.78 to 1.97) | 1.96 (1.86 to 2.06) | 1.90 (1.81 to 2.00) | 1.64 (1.57 to 1.73) | 1.75 (1.67 to 1.84) | 1.057 (1.053 to 1.061) |
| Hispanic | 1.00 | 0.85 (0.80 to 0.90) | 1.09 (1.03 to 1.16) | 1.25 (1.18 to 1.32) | 1.36 (1.29 to 1.44) | 1.51 (1.43 to 1.60) | 1.47 (1.39 to 1.56) | 1.61 (1.53 to 1.70) | 1.81 (1.71 to 1.91) | 1.57 (1.49 to 1.66) | 1.072 (1.068 to 1.077) |
| Asian/Pacific Islander | 1.00 | 0.88 (0.79 to 0.99) | 1.05 (0.95 to 1.17) | 1.63 (1.46 to 1.81) | 1.12 (1.00 to 1.26) | 1.18 (1.06 to 1.31) | 1.40 (1.27 to 1.55) | 1.33 (1.20 to 1.47) | 1.47 (1.32 to 1.63) | 1.66 (1.50 to 1.83) | 1.055 (1.047 to 1.064) |
Multivariable adjustment for baseline demographics, hospital characteristics, and 29 Elixhauser and other clinically relevant comorbidities as outlined in the methodology. Adjusted odds ratios (OR; per year) for trend were determined using logistic regression models evaluating calendar year as a continuous variable. Numbers in parenthesis represent 95% confidence interval.
We also analyzed the utilization of EIS at day 0 or 1. Results showed a temporal increase in the overall as well as the age‐, race/ethnicity‐, and sex‐stratified cohorts (Figures 3 and 4; Table 5).
Table 5.
Adjusted Temporal Trends of Non‐ST‐Elevation Myocardial Infarction With Utilization of the Early Invasive Strategy at Day 0 to 1: Overall Cohort, Age, Sex, and Race/Ethnicity Stratified
| 2002 | 2003 | 2004 | 2005 | 2006 | 2007 | 2008 | 2009 | 2010 | 2011 | Adjusted OR (Per Year) | |
|---|---|---|---|---|---|---|---|---|---|---|---|
| Overall | 1.00 | 1.02 (1.00 to 1.03) | 1.16 (1.15 to 1.18) | 1.33 (1.31 to 1.35) | 1.47 (1.45 to 1.49) | 1.60 (1.58 to 1.62) | 1.62 (1.60 to 1.64) | 1.82 (1.80 to 1.85) | 1.89 (1.87 to 1.92) | 2.00 (1.97 to 2.03) | 1.084 (1.083 to 1.085) |
| Age, y | |||||||||||
| 40 to 64 | 1.00 | 1.07 (1.05 to 1.09) | 1.26 (1.23 to 1.29) | 1.44 (1.41 to 1.47) | 1.54 (1.51 to 1.57) | 1.72 (1.68 to 1.75) | 1.86 (1.82 to 1.90) | 1.99 (1.95 to 2.03) | 2.11 (2.07 to 2.15) | 2.26 (2.21 to 2.31) | 1.096 (1.094 to 1.097) |
| 65 to 74 | 1.00 | 1.00 (0.97 to 1.02) | 1.10 (1.07 to 1.13) | 1.23 (1.25 to 1.31) | 1.43 (1.40 to 1.47) | 1.56 (1.51 to 1.60) | 1.51 (1.48 to 1.55) | 1.74 (1.70 to 1.78) | 1.82 (1.78 to 1.87) | 1.94 (1.90 to 1.99) | 1.082 (1.080 to 1.084) |
| ≥75 | 1.00 | 0.97 (0.95 to 1.00) | 1.14 (1.11 to 1.16) | 1.31 (1.28 to 1.34) | 1.51 (1.47 to 1.54) | 1.64 (1.60 to 1.67) | 1.58 (1.54 to 1.61) | 1.89 (1.85 to 1.93) | 1.92 (1.88 to 1.96) | 2.01 (1.96 to 2.05) | 1.089 (1.087 to 1.091) |
| Sex | |||||||||||
| Men | 1.00 | 1.04 (1.02 to 1.06) | 1.19 (1.17 to 1.21) | 1.37 (1.34 to 1.39) | 1.49 (1.46 to 1.52) | 1.65 (1.62 to 1.68) | 1.68 (1.65 to 1.70) | 1.88 (1.85 to 1.91) | 1.97 (1.94 to 2.01) | 2.10 (2.06 to 2.13) | 1.088 (1.087 to 1.090) |
| Women | 1.00 | 0.98 (0.96 to 1.00) | 1.13 (1.10 to 1.15) | 1.27 (1.25 to 1.30) | 1.45 (1.42 to 1.48) | 1.54 (1.51 to 1.57) | 1.54 (1.50 to 1.57) | 1.75 (1.71 to 1.78) | 1.78 (1.74 to 1.82) | 1.87 (1.83 to 1.91) | 1.078 (1.077 to 1.080) |
| Race/ethnicity | |||||||||||
| White | 1.00 | 1.04 (1.03 to 1.06) | 1.19 (1.17 to 1.21) | 1.34 (1.32 to 1.36) | 1.49 (1.47 to 1.51) | 1.64 (1.62 to 1.67) | 1.60 (1.58 to 1.62) | 1.90 (1.87 to 1.92) | 1.94 (1.91 to 1.97) | 2.05 (2.02 to 2.09) | 1.086 (1.085 to 1.087) |
| African American | 1.00 | 1.11 (1.06 to 1.16) | 1.20 (1.14 to 1.25) | 1.23 (1.18 to 1.29) | 1.43 (1.37 to 1.50) | 1.68 (1.61 to 1.75) | 1.79 (1.71 to 1.87) | 1.86 (1.78 to 1.94) | 1.80 (1.73 to 1.87) | 1.99 (1.91 to 2.07) | 1.079 (1.076 to 1.082) |
| Hispanic | 1.00 | 0.89 (0.85 to 0.94) | 1.09 (1.03 to 1.14) | 1.27 (1.21 to 1.33) | 1.46 (1.39 to 1.53) | 1.58 (1.51 to 1.66) | 1.63 (1.55 to 1.71) | 1.78 (1.69 to 1.86) | 2.13 (2.03 to 2.23) | 1.83 (1.74 to 1.91) | 1.092 (1.086 to 1.097) |
| Asian/Pacific Islander | 1.00 | 0.75 (0.68 to 0.83) | 0.92 (0.83 to 1.01) | 1.53 (1.39 to 1.70) | 0.90 (0.81 to 0.99) | 1.22 (1.11 to 1.34) | 1.35 (1.23 to 1.48) | 1.48 (1.35 to 1.62) | 1.62 (1.48 to 1.78) | 1.65 (1.50 to 1.81) | 1.079 (1.071 to 1.087) |
Multivariable adjustment for baseline demographics, hospital characteristics, and 29 Elixhauser and other clinically relevant comorbidities as outlined in the methodology. Adjusted odds ratios (OR; per year) for trend were determined using logistic regression models evaluating calendar year as a continuous variable. Numbers in parenthesis represent 95% confidence interval.
Primary Outcome: In‐Hospital Mortality
In‐hospital mortality decreased from 5.5% in 2002 to 3.9% in 2011 in all patients with NSTEMI (adjusted OR [per year], 0.976; 95% CI, 0.974 to 0.978; P<0.001). On age‐stratified analysis, those ≥75 years of age had the greatest decrease in in‐hospital mortality (adjusted OR [per year], 0.968; 95% CI, 0.966 to 0.971; P<0.001). Women had a steeper temporal decline in in‐hospital mortality, compared to men, from 2002 to 2011 (adjusted OR [per year], 0.965; 95% CI, 0.962 to 0.968; P<0.001 in women and adjusted OR [per year], 0.986; 95% CI, 0.984 to 0.989; P<0.001 in men). Statistically significant decline in mortality was also observed in all racial/ethnic groups.
In patients receiving EIS on day 0 of presentation, in‐hospital mortality was 2.5% in 2002 and 2.0% in 2011. However, the overall trend in this decrease was not statistically significant (adjusted OR [per year], 0.998; 95% CI, 0.991 to 1.004; P=0.471). A temporal decline in in‐hospital mortality was observed in patients treated with invasive strategy on day 0 or 1 (2.4% in 2002 to 1.8% in 2011; adjusted OR [per year], 0.988; 95% CI, 0.983 to 0.993; P<0.001; Figures 5 and 6; Table 6). In patients not receiving EIS, in‐hospital mortality decreased from 6.7% in 2002 to 5.4% in 2011 (adjusted OR [per year], 0.977; 95% CI, 0.975 to 0.979; P<0.001; Figure 6; Table 6).
Figure 5.
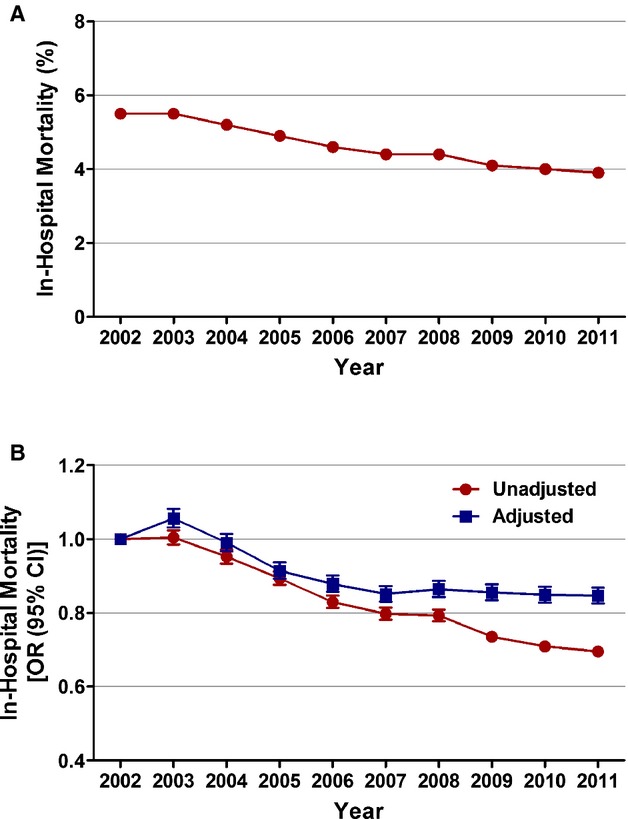
Trends in in‐hospital mortality in patients with non‐ST‐elevation myocardial infarction. A, In‐hospital mortality (%) was calculated as the number of patients who died during the hospitalization divided by the number of patients with NSTEMI per year×100; Ptrend<0.001. B, Trends in in‐hospital mortality presented as unadjusted and adjusted odds ratio (OR) and 95% confidence interval (CI) for each year relative to 2002 (reference year). Regression model adjusted for demographics, hospital characteristics, and 29 Elixhauser and other clinically relevant comorbidities. NSTEMI indicates non‐ST‐elevation myocardial infarction.
Figure 6.
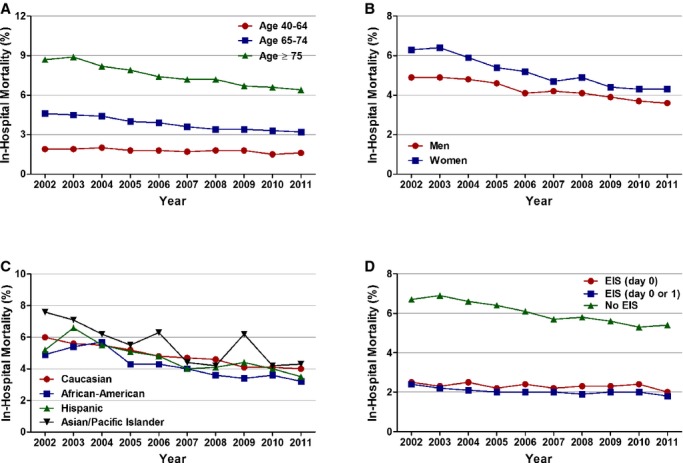
Age, sex, race/ethnicity, and utilization of invasive strategy‐specific trends in in‐hospital mortality in patients with non‐ST‐elevation myocardial infarction. A, Age stratified, (B) sex stratified, (C) race/ethnicity stratified, and (D) stratified according to utilization of invasive strategy (Ptrend<0.001 for all). No EIS was defined as patients who did not receive coronary angiography with intent to revascularize within day 0 or 1. EIS indicates early invasive strategy.
Table 6.
Adjusted Temporal Trends of Risk‐Adjusted In‐Hospital Mortality in Patients With Non‐ST‐Elevation Myocardial Infarction: Overall Cohort, Age, Sex, Race/Ethnicity, and Early Invasive Strategy Stratified
| 2002 | 2003 | 2004 | 2005 | 2006 | 2007 | 2008 | 2009 | 2010 | 2011 | Adjusted OR (Per Year) | |
|---|---|---|---|---|---|---|---|---|---|---|---|
| Overall | 1.00 | 1.06 (1.03 to 1.08) | 0.99 (0.97 to 1.01) | 0.91 (0.89 to 0.94) | 0.88 (0.86 to 0.90) | 0.85 (0.83 to 0.87) | 0.86 (0.84 to 0.88) | 0.86 (0.83 to 0.88) | 0.85 (0.83 to 0.87) | 0.85 (0.83 to 0.87) | 0.976 (0.974 to 0.978) |
| Age, y | |||||||||||
| 40 to 64 | 1.00 | 0.98 (0.91 to 1.05) | 1.07 (0.99 to 1.15) | 0.92 (0.86 to 0.99) | 0.96 (0.90 to 1.03) | 0.84 (0.78 to 0.90) | 0.92 (0.86 to 0.98) | 0.97 (0.90 to 1.03) | 0.85 (0.80 to 0.91) | 0.87 (0.82 to 0.94) | 0.983 (0.977 to 0.988) |
| 65 to 74 | 1.00 | 1.08 (1.02 to 1.14) | 1.04 (0.99 to 1.10) | 0.91 (0.86 to 0.97) | 0.88 (0.83 to 0.93) | 0.80 (0.76 to 0.85) | 0.83 (0.79 to 0.88) | 0.89 (0.84 to 0.94) | 0.88 (0.83 to 0.93) | 0.88 (0.83 to 0.93) | 0.977 (0.972 to 0.982) |
| ≥75 | 1.00 | 1.07 (1.04 to 1.10) | 0.96 (0.93 to 0.99) | 0.90 (0.88 to 0.93) | 0.85 (0.83 to 0.88) | 0.85 (0.82 to 0.88) | 0.83 (0.81 to 0.86) | 0.80 (0.77 to 0.82) | 0.81 (0.79 to 0.84) | 0.79 (0.77 to 0.82) | 0.968 (0.966 to 0.971) |
| Sex | |||||||||||
| Men | 1.00 | 1.06 (1.02 to 1.09) | 1.03 (0.99 to 1.07) | 0.98 (0.95 to 1.02) | 0.90 (0.86 to 0.93) | 0.93 (0.90 to 0.97) | 0.91 (0.88 to 0.94) | 0.96 (0.92 to 0.99) | 0.93 (0.90 to 0.97) | 0.92 (0.88 to 0.95) | 0.986 (0.984 to 0.989) |
| Women | 1.00 | 1.06 (1.02 to 1.09) | 0.95 (0.92 to 0.98) | 0.85 (0.82 to 0.88) | 0.86 (0.83 to 0.90) | 0.78 (0.75 to 0.81) | 0.82 (0.80 to 0.85) | 0.76 (0.73 to 0.79) | 0.77 (0.75 to 0.80) | 0.78 (0.76 to 0.81) | 0.965 (0.962 to 0.968) |
| Race/ethnicity | |||||||||||
| White | 1.00 | 1.02 (0.99 to 1.05) | 0.95 (0.92 to 0.97) | 0.90 (0.88 to 0.93) | 0.87 (0.84 to 0.89) | 0.85 (0.83 to 0.88) | 0.87 (0.84 to 0.89) | 0.84 (0.81 to 0.86) | 0.83 (0.81 to 0.86) | 0.85 (0.82 to 0.87) | 0.978 (0.975 to 0.980) |
| African American | 1.00 | 1.19 (1.10 to 1.30) | 1.21 (1.12 to 1.31) | 0.98 (0.90 to 1.07) | 0.94 (0.87 to 1.03) | 0.92 (0.84 to 0.99) | 0.86 (0.79 to 0.94) | 0.83 (0.76 to 0.91) | 0.93 (0.85 to 1.01) | 0.84 (0.76 to 0.92) | 0.967 (0.960 to 0.973) |
| Hispanic | 1.00 | 1.32 (1.21 to 1.44) | 1.15 (1.05 to 1.27) | 1.02 (0.93 to 1.12) | 1.03 (0.93 to 1.13) | 0.90 (0.81 to 0.99) | 0.93 (0.84 to 1.03) | 1.08 (0.98 to 1.19) | 1.06 (0.96 to 1.17) | 0.92 (0.83 to 1.01) | 0.978 (0.971 to 0.986) |
| Asian/Pacific Islander | 1.00 | 1.04 (0.89 to 1.21) | 0.90 (0.77 to 1.05) | 0.87 (0.73 to 1.03) | 0.76 (0.64 to 0.90) | 0.64 (0.54 to 0.76) | 0.60 (0.51 to 0.71) | 0.91 (0.78 to 1.07) | 0.60 (0.51 to 0.72) | 0.72 (0.61 to 0.86) | 0.952 (0.939 to 0.965) |
| EIS | |||||||||||
| Day 0 | 1.00 | 0.92 (0.84 to 1.01) | 1.02 (0.94 to 1.11) | 0.87 (0.80 to 0.95) | 0.96 (0.88 to 1.04) | 0.91 (0.84 to 0.99) | 0.92 (0.85 to 0.99) | 0.96 (0.88 to 1.04) | 1.02 (0.94 to 1.11) | 0.89 (0.82 to 0.97) | 0.998 (0.991 to 1.004) |
| Day 0 to 1 | 1.00 | 0.92 (0.86 to 0.98) | 0.93 (0.87 to 0.99) | 0.84 (0.78 to 0.89) | 0.84 (0.78 to 0.89) | 0.88 (0.83 to 0.94) | 0.85 (0.80 to 0.91) | 0.91 (0.86 to 0.97) | 0.90 (0.84 to 0.96) | 0.80 (0.75 to 0.85) | 0.988 (0.983 to 0.993) |
| No EIS | 1.00 | 1.08 (1.05 to 1.11) | 1.01 (0.99 to 1.04) | 0.94 (0.92 to 0.97) | 0.91 (0.88 to 0.93) | 0.87 (0.84 to 0.89) | 0.88 (0.86 to 0.91) | 0.86 (0.84 to 0.89) | 0.86 (0.84 to 0.88) | 0.88 (0.86 to 0.91) | 0.977 (0.975 to 0.979) |
Multivariable adjustment for baseline demographics, hospital characteristics, and 29 Elixhauser and other clinically relevant comorbidities as outlined in the methodology. Adjusted odds ratios (OR; per year) for trend were determined using logistic regression models evaluating calendar year as a continuous variable. Numbers in parenthesis represent 95% confidence interval. EIS indicates early invasive strategy.
Secondary Outcomes: Cost and Length of Stay
For secondary outcome analysis, we studied the temporal trends in cost and length of stay. Detailed results of the length and cost of stay temporal trends stratified by age, sex, and race/ethnicity are shown in Tables 7 and 8, respectively. The mean (±SEM, in days) length of stay decreased in the overall cohort of patients during the study period (5.7±0.01 in 2002 to 4.8±0.01 in 2011; Ptrend<0.001). Patients with NSTEMI undergoing EIS within day 0 had the shortest length of stay, and the length of stay declined in all patients undergoing EIS, irrespective of timing (from 4.4±0.03 in 2002 to 3.9±0.02 in 2011 for those with EIS at day 0 and from 4.8±0.02 in 2002 to 4.1±0.01 in 2011 for those with EIS within day 0 or 1; Ptrend<0.001 for all; Figure 7; Table 7).
Table 7.
Temporal Trends in Length of Stay (Mean±SE) in Days
| 2002 | 2003 | 2004 | 2005 | 2006 | 2007 | 2008 | 2009 | 2010 | 2011 | |
|---|---|---|---|---|---|---|---|---|---|---|
| Overall | 5.72 (±0.01) | 5.72 (±0.01) | 5.71 (±0.01) | 5.53 (±0.01) | 5.42 (±0.01) | 5.25 (±0.01) | 5.18 (±0.01) | 5.10 (±0.01) | 4.89 (±0.01) | 4.78 (±0.01) |
| Age, y | ||||||||||
| 40 to 64 | 4.54 (±0.01) | 4.69 (±0.02) | 4.61 (±0.02) | 4.41 (±0.01) | 4.52 (±0.02) | 4.37 (±0.02) | 4.37 (±0.01) | 4.37 (±0.01) | 4.24 (±0.01) | 4.15 (±0.01) |
| 65 to 74 | 6.11 (±0.02) | 6.02 (±0.02) | 6.04 (±0.02) | 5.82 (±0.02) | 5.64 (±0.02) | 5.59 (±0.02) | 5.45 (±0.02) | 5.45 (±0.02) | 5.16 (±0.02) | 5.04 (±0.02) |
| ≥75 | 6.40 (±0.02) | 6.35 (±0.01) | 6.40 (±0.02) | 6.28 (±0.02) | 6.09 (±0.02) | 5.84 (±0.02) | 5.73 (±0.01) | 5.57 (±0.01) | 5.35 (±0.01) | 5.20 (±0.01) |
| Sex | ||||||||||
| Men | 5.44 (±0.01) | 5.48 (±0.01) | 5.50 (±0.01) | 5.32 (±0.01) | 5.25 (±0.01) | 5.07 (±0.01) | 5.01 (±0.01) | 5.01 (±0.01) | 4.77 (±0.01) | 4.70 (±0.01) |
| Women | 6.08 (±0.02) | 6.03 (±0.01) | 5.98 (±0.02) | 5.80 (±0.02) | 5.65 (±0.02) | 5.48 (±0.02) | 5.40 (±0.01) | 5.22 (±0.01) | 5.05 (±0.01) | 4.89 (±0.01) |
| Race/ethnicity | ||||||||||
| White | 5.77 (±0.01) | 5.63 (±0.01) | 5.65 (±0.01) | 5.51 (±0.01) | 5.38 (±0.01) | 5.19 (±0.01) | 5.11 (±0.01) | 4.98 (±0.01) | 4.82 (±0.01) | 4.66 (±0.01) |
| African American | 6.23 (±0.04) | 6.64 (±0.04) | 6.64 (±0.05) | 8.99 (±0.05) | 6.06 (±0.04) | 5.67 (±0.04) | 5.73 (±0.04) | 5.59 (±0.03) | 5.29 (±0.03) | 5.24 (±0.03) |
| Hispanic | 6.05 (±0.04) | 6.59 (±0.04) | 6.55 (±0.05) | 6.02 (±0.05) | 5.92 (±0.05) | 5.70 (±0.05) | 5.85 (±0.05) | 5.72 (±0.04) | 5.52 (±0.04) | 4.89 (±0.03) |
| Asian/Pacific Islander | 7.49 (±0.17) | 7.02 (±0.10) | 6.29 (±0.10) | 6.60 (±0.11) | 6.56 (±0.10) | 5.66 (±0.08) | 5.30 (±0.06) | 5.69 (±0.09) | 5.15 (±0.06) | 5.10 (±0.07) |
| Early invasive strategy | ||||||||||
| Day 0 | 4.38 (±0.03) | 4.36 (±0.02) | 4.43 (±0.02) | 3.97 (±0.02) | 4.17 (±0.02) | 4.04 (±0.02) | 4.01 (±0.02) | 4.09 (±0.02) | 3.98 (±0.02) | 3.87 (±0.02) |
| Day 0 to 1 | 4.75 (±0.02) | 4.61 (±0.02) | 4.63 (±0.02) | 4.27 (±0.01) | 4.40 (±0.01) | 4.32 (±0.02) | 4.30 (±0.01) | 4.33 (±0.01) | 4.19 (±0.01) | 4.08 (±0.01) |
Table 8.
Temporal Trends in Total Hospital Cost (Mean±SE) in U.S. Dollars
| 2002 | 2003 | 2004 | 2005 | 2006 | 2007 | 2008 | 2009 | 2010 | 2011 | |
|---|---|---|---|---|---|---|---|---|---|---|
| Overall | $14 774 (±30) | $16 145 (±33) | $17 750 (±34) | $18 142 (±34) | $19 484 (±33) | $18 971 (±35) | $20 004 (±36) | $19 587 (±34) | $19 632 (±35) | $20 269 (±36) |
| Age, y | ||||||||||
| 40 to 64 | $14 457 (±46) | $16 501 (±54) | $17 914 (±54) | $18 353 (±53) | $19 983 (±53) | $19 495 (±58) | $21 193 (±59) | $20 372 (±54) | $20 597 (±55) | $21 287 (±56) |
| 65 to 74 | $16 827 (±73) | $17 800 (±75) | $19 980 (±81) | $20 154 (±80) | $21 517 (±77) | $21 287 (±79) | $22 268 (±84) | $22 110 (±80) | $22 125 (±84) | $22 888 (±83) |
| ≥75 | $13 875 (±44) | $14 998 (±48) | $16 429 (±52) | $16 958 (±53) | $17 956 (±51) | $17 239 (±51) | $17 767 (±55) | $17 382 (±52) | $17 265 (±53) | $17 785 (±56) |
| Sex | ||||||||||
| Men | $15 266 (±40) | $16 924 (±45) | $18 571 (±46) | $19 166 (±47) | $20 522 (±45) | $20 003 (±48) | $21 154 (±49) | $20 884 (±48) | $20 712 (±46) | $21 665 (±50) |
| Women | $14 143 (±44) | $15 153 (±47) | $16 695 (±52) | $16 816 (±50) | $18 123 (±50) | $17 642 (±50) | $18 527 (±55) | $17 850 (±49) | $18 191 (±54) | $18 382 (±51) |
| Race/ethnicity | ||||||||||
| White | $14 727 (±42) | $15 614 (±43) | $17 080 (±43) | $18 054 (±45) | $18 934 (±43) | $19 114 (±47) | $19 349 (±44) | $18 900 (±42) | $18 919 (±40) | $19 649 (±42) |
| African American | $14 863 (±118) | $17 546 (±139) | $17 702 (±134) | $16 952 (±142) | $19 202 (±132) | $18 322 (±114) | $19 142 (±142) | $18 724 (±112) | $18 050 (±95) | $19 018 (±111) |
| Hispanic | $19 282 (±189) | $19 695 (±191) | $22 802 (±255) | $22 484 (±203) | $21 509 (±152) | $22 132 (±175) | $23 788 (±199) | $22 989 (±175) | $24 329 (±173) | $28 558 (±168) |
| Asian/Pacific Islander | $25 936 (±485) | $21 668 (±364) | $24 790 (±422) | $28 487 (±562) | $26 611 (±448) | $23 703 (±358) | $27 373 (±395) | $26 322 (±380) | $24 509 (±340) | $29 743 (±434) |
| Early invasive strategy | ||||||||||
| Day 0 | $17 385 (±80) | $19 542 (±94) | $21 783 (±92) | $21 965 (±86) | $23 475 (±80) | $22 912 (±80) | $23 860 (±84) | $22 572 (±68) | $23 673 (±76) | $24 345 (±78) |
| Day 0 to 1 | $17 534 (±59) | $19 097 (±63) | $21 280 (±64) | $21610 (±61) | $23 099 (±57) | $22 594 (±59) | $23 873 (±62) | $22 823 (±53) | $23 489 (±55) | $23 971 (±55) |
Figure 7.
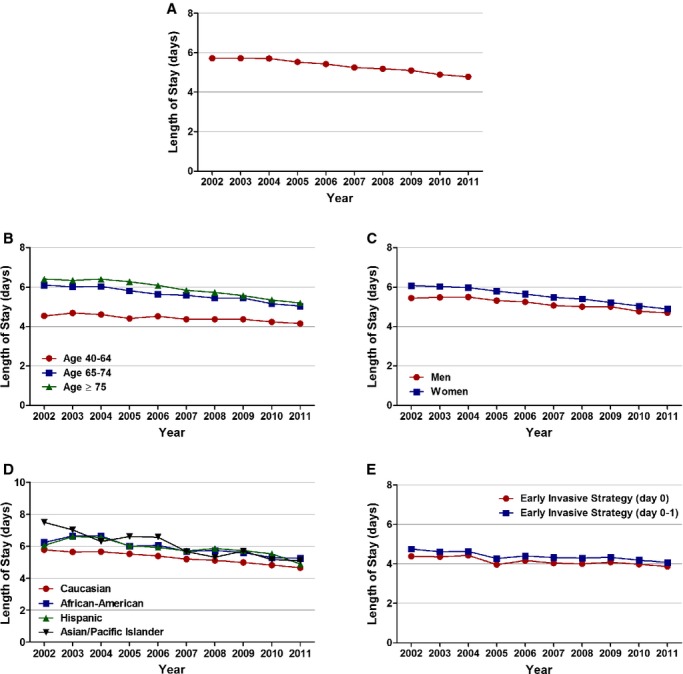
Temporal trends in length of stay, in days. A, Overall, (B) age, (C) sex, (D) race/ethnicity, and (E) timing of invasive strategy (Ptrend<0.001 for all).
Mean (±SEM, in dollars) cost of stay in the overall patient population admitted with NSTEMI increased from $14 774±30 from 2002 to $20 269±35 in 2011 (Ptrend<0.001). The mean (±SEM, in dollars) costs accrued by those undergoing EIS were higher and showed a similar increasing trend (from $17 385±80 in 2002 to $24 345±76 in 2011 for those with EIS at day 0 and from $17 534±59 in 2002 to $23 971±55 in 2011 for those with EIS within day 0 or 1; Ptrend<0.001 for all; Figure 8; Table 8).
Figure 8.
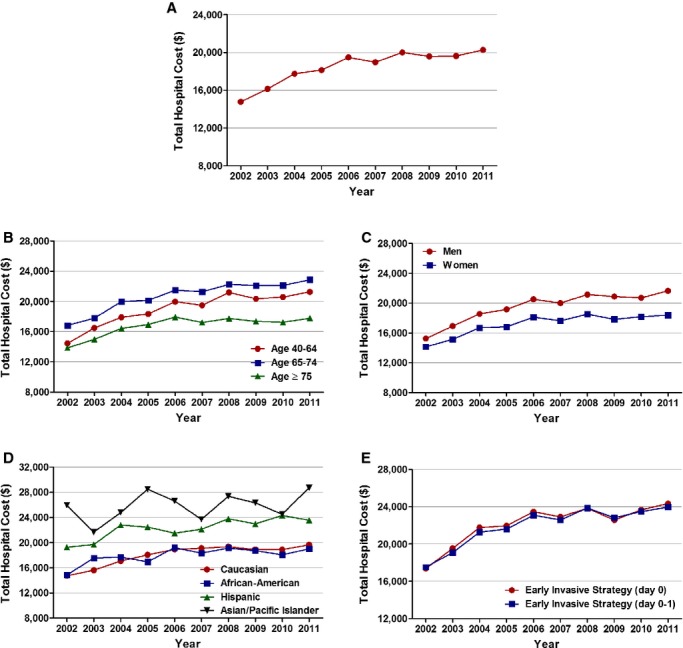
Temporal trends in cost of stay, in U.S. dollars. (A) Overall, (B) age, (C) sex, (D) race/ethnicity, and (E) timing of invasive strategy (Ptrend<0.001 for all).
Discussion
We report an increasing trend in the proportion of NSTEMI admissions for the overall cohort and in the age‐, sex‐, and race/ethnicity‐stratified subgroups from 2002 to 2011. This is associated with an increase in utilization of EIS, decreased in‐hospital mortality, and decreased length of stay during the same period.
Analysis of the National Registry of Myocardial Infarction from 1990 to 2006 reported an increase in the proportion of NSTEMI from 14.2% in 1990 to 59.1% in 2006 (P<0.001).2 The proportional increase in NSTEMI may be the result of an aging population, increasing chronic comorbidities, and reduction in smoking. Part of the increase in the proportion of NSTEMI in our study may be attributable to increased utilization and higher sensitivity of cardiac biomarkers (troponins). In the age‐ and sex‐stratified analysis, patients ≥75 years and women had the greatest proportional increase in NSTEMI. Women are also more likely to present with NSTEMI, compared to men.12 Older patients are more likely to be women and have significant comorbidities that predispose them to NSTEMI.
On trend analysis of baseline characteristics, we report an increase in the proportion of patients in the 40 to 64 years of age group. This is in concordance with the analysis of Get With The Guidelines Coronary Artery Disease Registry from 2003 to 2008,13 with that age group representing the fastest‐growing segment of our population over the years.
Importantly, there was a temporal increase in utilization of the EIS in the NSTEMI patient population. Meta‐analysis of randomized, control trials has consistently shown a benefit of EIS in the setting of NSTEMI, especially in the high‐risk patient population.14–15 Definition of optimal timing of invasive management has undergone a paradigm shift in the last decade. The 2002 ACC/AHA guidelines for management of NSTEMI16 and the 2007 ACC/AHA guidelines17 for management of NSTEMI in the elderly patient population defined the EIS as routine cardiac catheterization within 48 hours of presentation. The more recent TIMACS trial8 compared the routine early intervention (≤24 hours of presentation; median time, 14 hours) to delayed intervention (≥36 hours after presentation; median time, 50 hours). There was no significant difference in the primary endpoint, other than in the prespecified subgroup with high Global Registry of Acute Coronary Events scores. After 6 months, they reported a 28% relative reduction in secondary outcome of death, MI, and refractory ischemia in the early intervention group (OR, 0.72; 95% CI, 0.58 to 0.89; P=0.003).
The results of the CRUSADE (Can Rapid Risk Stratification of Unstable Angina Patients Suppress Adverse Outcomes With Early Implementation of the ACC/AHA Guidelines) Quality Improvement Initiative from 2000 to 2002 indicated that the EIS (within 48 hours) was not utilized in a majority of high‐risk patients with NSTEMI.18 They reported male sex, ischemic electrocardiographic changes, younger age, positive biomarkers, lack of congestive heart failure, lack of renal insufficiency, and white race as predictors of early invasive management. We analyzed the trends in both day 0 and day 0 or 1 of presentation. Utilization of EIS at day 0 increased from 14.9% in 2002 to 21.8% in 2011 (P<0.001), and utilization of EIS at day 0 or 1 increased from 27.8% in 2002 to 41.4% in 2011 (P<0.001). The increase in utilization was consistent among all age‐, race/ethnicity‐, and sex‐stratified subgroups after multivariable adjustment. Men had a higher proportional increase in EIS at both day 0 and day 0 or 1 of presentation. Previous studies have discussed the sex differences in the invasive management of ACS, with women being managed less aggressively than men.19–20
Interestingly, patients ≥75 years of age had a higher proportional increase in EIS at day 0 and patients 40 to 64 years of age had an overall higher proportional increase at day 0 or 1. Chin et al.,21 using the linked CRUSADE registry and Medicare and Medicaid claims data, reported an increased utilization of evidence based NSTEMI care and decline in in‐hospital mortality in 2006, compared with 2003 (OR, 0.82; 95% CI, 0.67 to 1.00; P=0.045) in patients ≥65 years of age with NSTEMI. Recent trend analysis from Denmark also reported an increase in initiation of coronary angiography for first‐time NSTEMI admissions at 3 days from 18.2% in 2001 to 55.7% to 2009.22
We also report a decrease in risk‐adjusted in‐hospital mortality and length of stay for patients admitted with NSTEMI. The decline in in‐hospital mortality was observed in patients receiving EIS as well as those not receiving EIS. This observation is consistent with improvement in, or better adherence to, medical therapy, independent of EIS utilization. The lower in‐hospital mortality observed in the EIS‐managed patients is likely the result of patient selection bias, as previously demonstrated by analysis of the CRUSADE registry,18 and no causal association between EIS and in‐hospital mortality can be inferred from the results of our study.
The decline in overall in‐hospital mortality was most prominent in those ≥75 years of age. We have previously reported a 24% relative reduction of in‐hospital mortality in octogenarians treated with the early invasive approach versus the initial conservative strategy (OR, 0.76; 95% CI, 0.74 to 0.78; P<0.001).23 However, it is not possible to conclusively establish a causal relationship between increasing utilization of EIS and decreasing in‐hospital mortality from this study.
Limitations
This study has certain limitations. Because this is a retrospective, observational study, the possibility of selection bias and residual measured and unmeasured confounding cannot be completely eliminated. NIS is an administrative database; there is the potential for unrecognized miscoding of diagnostic and procedure codes. There is a possibility that widespread troponin utilization in the last decade may have contributed to the increase in NSTEMI diagnosis and also potentially decreased case severity of those classified as NSTEMI. Also, conditions other than ACS may have led to troponin elevations and hence miscoding of NSTEMI exists. Clinical presentation and medication utilization variables are not available in this administrative database. It is our assumption that day 0 corresponds to ≤24 hours and days 0 or 1 corresponds to ≤48 hours, because the database does not provide the timing of procedure in hours. For trends in total hospital costs, we did not convert hospital costs into inflation‐adjusted constant dollars. The NIS databases do not include NSTEMI hospitalizations for veterans hospitalized in Veterans Affairs hospitals. We could also not account for patients transferred in from other hospitals. Last, outcomes in the NIS database are limited to in‐hospital events and causes of death are not differentiated. However, these potential limitations may be partially compensated by the large size of the database and the ability to obtain nationwide estimates using the discharge weights provided.
Conclusions
In this large, nationwide analysis of patients with MI, we report an increase in proportion of NSTEMI with increasing utilization of EIS in the United States. We also report a decrease in in‐hospital mortality and decrease in length of stay during the study period. The improved outcomes may reflect greater adherence to the evolving guideline‐recommended therapies. Nevertheless, age‐, sex‐, and race/ethnicity‐specific differences in the management and outcomes of NSTEMI were observed, and further studies are needed to develop strategies to ensure more equitable care for NSTEMI.
Disclosures
Dr Bhatt discloses the following relationships: advisory board: Elsevier Practice Update Cardiology, Medscape Cardiology, and Regado Biosciences; board of directors: Boston VA Research Institute and Society of Cardiovascular Patient Care; chair: American Heart Association Get With The Guidelines Steering Committee; data monitoring committees: Duke Clinical Research Institute, Harvard Clinical Research Institute, Mayo Clinic, and Population Health Research Institute; honoraria: American College of Cardiology (editor, Clinical Trials, Cardiosource), Belvoir Publications (editor in chief, Harvard Heart Letter), Duke Clinical Research Institute (clinical trial steering committees), Harvard Clinical Research Institute (clinical trial steering committee), HMP Communications (editor in chief, Journal of Invasive Cardiology), Population Health Research Institute (clinical trial steering committee), Slack Publications (chief medical editor, Cardiology Today's Intervention), and WebMD (CME steering committees); other: Clinical Cardiology (deputy editor) and Journal of the American College of Cardiology (section editor, pharmacology); research grants: Amarin, AstraZeneca, Bristol‐Myers Squibb, Eisai, Ethicon, Medtronic, Roche, Sanofi Aventis, and The Medicines Company; unfunded research: FlowCo, PLx Pharma, and Takeda. All other authors have no conflicts of interest to disclose.
References
- 1.Roger VL, Go AS, Lloyd‐Jones DM, Benjamin EJ, Berry JD, Borden WB, Bravata DM, Dai S, Ford ES, Fox CS, Fullerton HJ, Gillespie C, Hailpern SM, Heit JA, Howard VJ, Kissela BM, Kittner SJ, Lackland DT, Lichtman JH, Lisabeth LD, Makuc DM, Marcus GM, Marelli A, Matchar DB, Moy CS, Mozaffarian D, Mussolino ME, Nichol G, Paynter NP, Soliman EZ, Sorlie PD, Sotoodehnia N, Turan TN, Virani SS, Wong ND, Woo D, Turner MBon behalf of the American Heart Association Statistics Committee and Stroke Statistics Subcommittee. Heart disease and stroke statistics–2012 update: a report from the American Heart Association. Circulation. 2012; 125:e2-e220. [DOI] [PMC free article] [PubMed] [Google Scholar]
- 2.Rogers WJ, Frederick PD, Stoehr E, Canto JG, Ornato JP, Gibson CM, Pollack CV, Gore JM, Chandra‐Strobos N, Peterson ED, French WJ. Trends in presenting characteristics and hospital mortality among patients with ST elevation and non‐ST elevation myocardial infarction in the National Registry of Myocardial Infarction from 1990 to 2006. Am Heart J. 2008; 156:1026-1034. [DOI] [PubMed] [Google Scholar]
- 3.Khera S, Kolte D, Palaniswamy C, Mujib M, Aronow WS, Singh T, Gotsis W, Silverman G, Frishman WH. ST‐elevation myocardial infarction in the elderly—temporal trends in incidence, utilization of percutaneous coronary intervention and outcomes in the United States. Int J Cardiol. 2013; 168:3683-3690. [DOI] [PubMed] [Google Scholar]
- 4.McManus DD, Gore J, Yarzebski J, Spencer F, Lessard D, Goldberg RJ. Recent trends in the incidence, treatment, and outcomes of patients with STEMI and NSTEMI. Am J Med. 2011; 124:40-47. [DOI] [PMC free article] [PubMed] [Google Scholar]
- 5.Jennings SM, Bennett K, Lonergan M, Shelley E. Trends in hospitalisation for acute myocardial infarction in Ireland, 1997–2008. Heart. 2012; 98:1285-1289. [DOI] [PubMed] [Google Scholar]
- 6.Gierlotka M, Gąsior M, Wilczek K, Wasilewski J, Hawranek M, Tajstra M, Osadnik T, Banasiak W, Poloński L. Temporal trends in the treatment and outcomes of patients with non‐ST‐segment elevation myocardial infarction in Poland from 2004‐2010 (from the Polish Registry of Acute Coronary Syndromes). Am J Cardiol. 2012; 109:779-786. [DOI] [PubMed] [Google Scholar]
- 7.2012 Writing Committee Members. Jneid H, Anderson JL, Wright RS, Adams CD, Bridges CR, Casey DE, Ettinger SM, Fesmire FM, Ganiats TG, Lincoff AM, Peterson ED, Philippides GJ, Theroux P, Wenger NK, Zidar JP. American College of Cardiology Foundation, and American Heart Association Task Force on Practice Guidelines. 2012 ACCF/AHA focused update of the guideline for the management of patients with unstable angina/Non‐ST‐elevation myocardial infarction (updating the 2007 guideline and replacing the 2011 focused update): a report of the American College of Cardiology Foundation/American Heart Association Task Force on practice guidelines. Circulation. 2012; 126:875-910. [DOI] [PubMed] [Google Scholar]
- 8.Mehta SR, Granger CB, Boden WE, Steg PG, Bassand JP, Faxon DP, Afzal R, Chrolavicius S, Jolly SS, Widimsky P, Avezum A, Rupprecht HJ, Zhu J, Col J, Natarajan MK, Horsman C, Fox KAA, Yusuf STIMACS Investigators. Early versus delayed invasive intervention in acute coronary syndromes. N Engl J Med. 2009; 360:2165-2175. [DOI] [PubMed] [Google Scholar]
- 9.Anderson JL, Adams CD, Antman EM, Bridges CR, Califf RM, Casey DE, Chavey WE, Fesmire FM, Hochman JS, Levin TN, Lincoff AM, Peterson ED, Theroux P, Wenger NK, Wright RS, Smith SC, Jacobs AK, Halperin JL, Hunt SA, Krumholz HM, Kushner FG, Lytle BW, Nishimura R, Ornato JP, Page RL, Riegel B. ACC/AHA 2007 guidelines for the management of patients with unstable angina/non ST‐elevation myocardial infarction: a report of the American College of Cardiology/American Heart Association Task Force on Practice Guidelines (Writing Committee to Revise the 2002 Guidelines for the Management of Patients With Unstable Angina/Non ST‐Elevation Myocardial Infarction): developed in collaboration with the American College of Emergency Physicians, the Society for Cardiovascular Angiography and Interventions, and the Society of Thoracic Surgeons: endorsed by the American Association of Cardiovascular and Pulmonary Rehabilitation and the Society for Academic Emergency Medicine. Circulation. 2007; 116:148-304. [DOI] [PubMed] [Google Scholar]
- 10.Kolte D, Khera S, Aronow WS, Mujib M, Palaniswamy C, Sule S, Jain D, Gotsis W, Ahmed A, Frishman WH, Fonarow GC. Trends in incidence, management, and outcomes of cardiogenic shock complicating ST‐elevation myocardial infarction in the United States. J Am Heart Assoc. 2014; 3:e000590. [DOI] [PMC free article] [PubMed] [Google Scholar]
- 11.Khera S, Kolte D, Aronow WS, Palaniswamy C, Mujib M, Ahmed A, Chugh SS, Balasubramaniyam N, Edupuganti M, Frishman WH, Fonarow GC. Trends in acute kidney injury and outcomes after early percutaneous coronary intervention in patients ≥75 years of age with acute myocardial infarction. Am J Cardiol. 2013; 112:1279-1286. [DOI] [PubMed] [Google Scholar]
- 12.Khan NA, Daskalopoulou SS, Karp I, Eisenberg MJ, Pelletier R, Tsadok MA, Dasgupta K, Norris CM, Pilote L. Sex differences in acute coronary syndrome symptom presentation in young patients. JAMA Intern Med. 2013; 173:1863-1871. [DOI] [PubMed] [Google Scholar]
- 13.Boyer NM, Laskey WK, Cox M, Hernandez AF, Peterson ED, Bhatt DL, Cannon CP, Fonarow GC. Trends in clinical, demographic, and biochemical characteristics of patients with acute myocardial infarction from 2003 to 2008: a report from the American heart association get with the guidelines coronary artery disease program. J Am Heart Assoc. 2012; 1:e001206. [DOI] [PMC free article] [PubMed] [Google Scholar]
- 14.Mehta SR, Cannon CP, Fox KAA, Wallentin L, Boden WE, Spacek R, Widimsky P, McCullough PA, Hunt D, Braunwald E, Yusuf S. Routine vs selective invasive strategies in patients with acute coronary syndromes: a collaborative meta‐analysis of randomized trials. JAMA. 2005; 293:2908-2917. [DOI] [PubMed] [Google Scholar]
- 15.Bavry AA, Kumbhani DJ, Rassi AN, Bhatt DL, Askari AT. Benefit of early invasive therapy in acute coronary syndromes: a meta‐analysis of contemporary randomized clinical trials. J Am Coll Cardiol. 2006; 48:1319-1325. [DOI] [PubMed] [Google Scholar]
- 16.Braunwald E, Antman EM, Beasley JW, Califf RM, Cheitlin MD, Hochman JS, Jones RH, Kereiakes D, Kupersmith J, Levin TN, Pepine CJ, Schaeffer JW, Smith EE, Steward DE, Theroux P, Gibbons RJ, Alpert JS, Faxon DP, Fuster V, Gregoratos G, Hiratzka LF, Jacobs AK, Smith SC. ACC/AHA guideline update for the management of patients with unstable angina and non‐ST‐segment elevation myocardial infarction–2002: summary article: a report of the American College of Cardiology/American Heart Association Task Force on Practice Guidelines (Committee on the Management of Patients With Unstable Angina). Circulation. 2002; 106:1893-1900. [DOI] [PubMed] [Google Scholar]
- 17.Alexander KP, Newby LK, Cannon CP, Armstrong PW, Gibler WB, Rich MW, Van de Werf F, White HD, Weaver WD, Naylor MD, Gore JM, Krumholz HM, Ohman EM. Acute coronary care in the elderly, part I: non‐ST‐segment‐elevation acute coronary syndromes: a scientific statement for healthcare professionals from the American Heart Association Council on Clinical Cardiology: in collaboration with the Society of Geriatric Cardiology. Circulation. 2007; 115:2549-2569. [DOI] [PubMed] [Google Scholar]
- 18.Bhatt DL, Roe MT, Peterson ED, Li Y, Chen AY, Harrington RA, Greenbaum AB, Berger PB, Cannon CP, Cohen DJ, Gibson CM, Saucedo JF, Kleiman NS, Hochman JS, Boden WE, Brindis RG, Peacock WF, Smith SC, Pollack CV, Gibler WB, Ohman EM. Utilization of early invasive management strategies for high‐risk patients with non‐ST‐segment elevation acute coronary syndromes: results from the CRUSADE Quality Improvement Initiative. JAMA. 2004; 292:2096-2104. [DOI] [PubMed] [Google Scholar]
- 19.Heer T, Gitt AK, Juenger C, Schiele R, Wienbergen H, Towae F, Gottwitz M, Zahn R, Zeymer U, Senges J. Gender differences in acute non‐ST‐segment elevation myocardial infarction. Am J Cardiol. 2006; 98:160-166. [DOI] [PubMed] [Google Scholar]
- 20.Blomkalns AL, Chen AY, Hochman JS, Peterson ED, Trynosky K, Diercks DB, Brogan GX, Boden WE, Roe MT, Ohman EM, Gibler WB, Newby LK. Gender disparities in the diagnosis and treatment of non‐ST‐segment elevation acute coronary syndromes: large‐scale observations from the CRUSADE (Can Rapid Risk Stratification of Unstable Angina Patients Suppress Adverse Outcomes With Early Implementation of the American College of Cardiology/American Heart Association Guidelines) National Quality Improvement Initiative. J Am Coll Cardiol. 2005; 45:832-837. [DOI] [PubMed] [Google Scholar]
- 21.Chin CT, Wang TY, Chen AY, Mathews R, Alexander KP, Roe MT, Peterson ED. Trends in outcomes among older patients with non‐ST‐segment elevation myocardial infarction. Am Heart J. 2014; 167:36-42.e1. [DOI] [PubMed] [Google Scholar]
- 22.Mårtensson S, Gyrd‐Hansen D, Prescott E, Andersen PK, Zwisler A‐DO, Osler M. Trends in time to invasive examination and treatment from 2001 to 2009 in patients admitted first time with non‐ST elevation myocardial infarction or unstable angina in Denmark. BMJ Open. 2014; 4:e004052. [DOI] [PMC free article] [PubMed] [Google Scholar]
- 23.Kolte D, Khera S, Palaniswamy C, Mujib M, Fonarow GC, Ahmed A, Frishman WH, Aronow WS. Early invasive versus initial conservative treatment strategies in octogenarians with UA/NSTEMI. Am J Med. 2013; 126:1076-1083.e1. [DOI] [PubMed] [Google Scholar]