Abstract
Background
Left ventricular (LV) rotation results from contraction of obliquely oriented myocardial fibers. The net difference between systolic apical counterclockwise rotation and basal clockwise rotation is left ventricular torsion (LVT). Although LVT is altered in various cardiac diseases, determinants of LVT are incompletely understood.
Methods and Results
LV end-diastolic volume (LVEDV), LV apical and basal rotation, peak systolic LVT, and peak early diastolic untwisting rate (UTR) were measured by speckle tracking echocardiography in healthy subjects (n=8) before and after infusion of a weight-based normal saline bolus (2.1±0.3 L). Saline infusion lead to a significant increase in end-diastolic LV internal diameter (45.9±3.7 versus 47.6±4.2 mm; p=0.002) and LVEDV (90.0±21.6 versus 98.3±19.6 mL; p=0.01). Stroke volume (51.3±10.9 versus 63.0±15.5 mL; p = 0.003) and cardiac output (3.4±0.8 versus 4.4±1.5 L/min; p = 0.007) increased while there was no change in heart rate and blood pressure. There was a significant increase in the magnitude of peak systolic apical rotation (7.5±2.4 versus 10.5±2.8 degrees; p < 0.001) but no change in basal rotation (-4.1±2.3 versus -4.8±3.1 degrees; p = 0.44). Accordingly, peak systolic LVT increased by 33% following saline infusion (11.2±1.3 versus 14.9±1.7 degrees; p < 0.001). This saline-induced increase in LVT was associated with a marked increase in peak early diastolic UTR (72.3±21.4 versus 136.8±30.0 degrees/s; p < 0.001).
Conclusions
Peak systolic LVT and peak early diastolic UTR are preload dependent. Changes in LV preload should be considered when interpreting results of future LVT studies.
Keywords: Echocardiography, mechanics, cardiac volume, torsion
Introduction
Left ventricular (LV) rotation plays an important role in LV contraction and relaxation.1-3 LV rotation occurs due to contraction of obliquely oriented myocardial fibers and is characterized by rotation of the apex and base in opposite directions.4,5 This process of counter-directional rotation is known as LV torsion (LVT). In addition to the systolic phenomenon of LVT, the subsequent untwisting during early diastole is an important determinant of LV filling.3 The clinical relevance of LVT has been documented in the context of numerous cardiac diseases.6-9
Factors determining the magnitude of LVT are incompletely understood. Specifically, the relationship between established determinants of LV performance (i.e. preload) and LVT remain controversial. Initial animal studies suggested that LVT is dependent on stroke volume (SV)10,11 and the load dependent nature of LVT is further supported by the results of an elegant canine study.12 However, limited data derived from the study of transplanted hearts suggest that LVT may not be affected by alterations in preload in humans.13,14
To our knowledge, the impact of cardiac volume loading on LVT in healthy human hearts has not been previously studied. We hypothesized that a saline-induced increase in LV preload would result in a significant increase in LVT. To assess this hypothesis, we evaluated the impact of volume loading with normal saline infusion on peak systolic LVT and peak early diastolic untwisting rate (UTR) in healthy human subjects.
Methods
Study population
Healthy participants were recruited from a hospital-wide email distribution advertisement at the Massachusetts General Hospital. Subjects were eligible if they were between ages 18 – 65 years and had a body mass index (BMI, weight in kilograms divided by height in meters squared, kg/m2) of 18 – 27 kg/m2. Exclusion criteria included a history of diabetes mellitus, myocardial infarction, coronary heart disease, cardiomyopathy, hypertension, aortic stenosis, valvular regurgitation greater than mild in severity, atrial fibrillation or other cardiac arrhythmia, obstructive lung disease, chronic kidney disease (estimated glomerular filtration rate < 60 ml/min/1.73m2) or thyroid dysfunction. The study protocol was approved by the Partners Healthcare Institutional Review Board. Written informed consent was obtained from all subjects. The study was conducted in the Mallinckrodt General Clinical Research Center at the Massachusetts General Hospital between April and October 2009.
Clinical assessment and normal saline infusion protocol
The following clinical data were obtained on all subjects: age (years), height (m), weight (kg), and current / past medication use. Body-surface area (BSA) was calculated according to the DuBois algorithm: BSA = 0.20247 × Height(m)0.725 × Weight(kg)0.425. Blood pressure was measured using a mercury column sphygmomanometer and an appropriate-sized blood pressure cuff with the subject in the supine position after 5 minutes of rest. An intravenous cannula was inserted into a superficial vein in the antecubital fossa for isotonic saline (0.9% NaCl) infusion. A standardized saline volume (1200 mL × BSA) was delivered over 2 hours. Participants remained in a supine position during the infusion. Oxygen saturation was continuously monitored and heart rate, respiratory rate, and blood pressure measurements were obtained at baseline and every 20 minutes during the saline infusion.
Standard 2-dimensional echocardiography
Transthoracic echocardiography was performed using a commercially available system (Vivid-7, GE Healthcare, Milwaukee, Wisconsin) with a 1.9- to 3.8-mHz phased-array transducer. Subjects were studied after > 20 minutes of quiet rest at baseline and again immediately following saline infusion. Two-dimensional, pulsed-Doppler, and color tissue Doppler imaging were performed from standard parasternal and apical positions. For each subject the same frame rate was used for apical and basal 2-dimensional short-axis images to facilitate subsequent LVT analysis. All data were stored digitally, and off-line data analysis was performed (EchoPac, version 6.5, GE Healthcare). Cardiac structural measurements were made in accord with current guidelines with LV ejection fraction calculated using the modified Simpson technique and LV mass calculated using the area-length method.15 LV length was measured in the apical 4-chamber view and was defined as the end-diastolic length (mm) from the mitral annular plane to the endocardium at the LV apex.
Cardiac event timing including aortic valve closure and mitral valve opening were measured from appropriate pulsed-wave Doppler images. Isovolumic relaxation time (IVRT) was defined as the time difference from aortic valve closure to mitral valve opening. LV outflow tract (LVOT) diameter was measured from the parasternal long-axis view. SV was calculated as: Cross sectional areaLVOT × VTILVOT, where cross sectional area = Π(radiusLVOT)2 and VTI = velocity time integral. Cardiac output (CO) was calculated as the product of SV and heart rate. Tissue velocity measurements for indices of diastolic function16 were obtained from off-line 2-dimensional color-coded tissue Doppler images and are reported as the average of 3 consecutive cardiac cycles. Longitudinal, radial and circumferential peak systolic strain measurements were made using speckle tracking analysis. Longitudinal strain values were obtained from the apical four-chamber view, while radial and circumferential strain values were obtained from the short-axis view at the level of the papillary muscles. Longitudinal and circumferential strain values are presented as negative values and radial strain is reported as a positive value. Reported strains represent mean values of the six myocardial segments that were pre-specified by the analysis software.
Speckle tracking echocardiography and torsion analysis
For the purpose of LVT measurement, short-axis imaging standardization within and across subjects was maximized using the following criteria. The basal level was defined as the highest basal imaging plane at which uniform full thickness myocardium was observed surrounding the mitral valve at end-systole (Figure 1A). The apical level was defined as the imaging plane with no visible papillary muscles and an end-diastolic ratio of LV cavity diameter to total LV diameter of 0.5 (Figure 1B).
Figure 1.
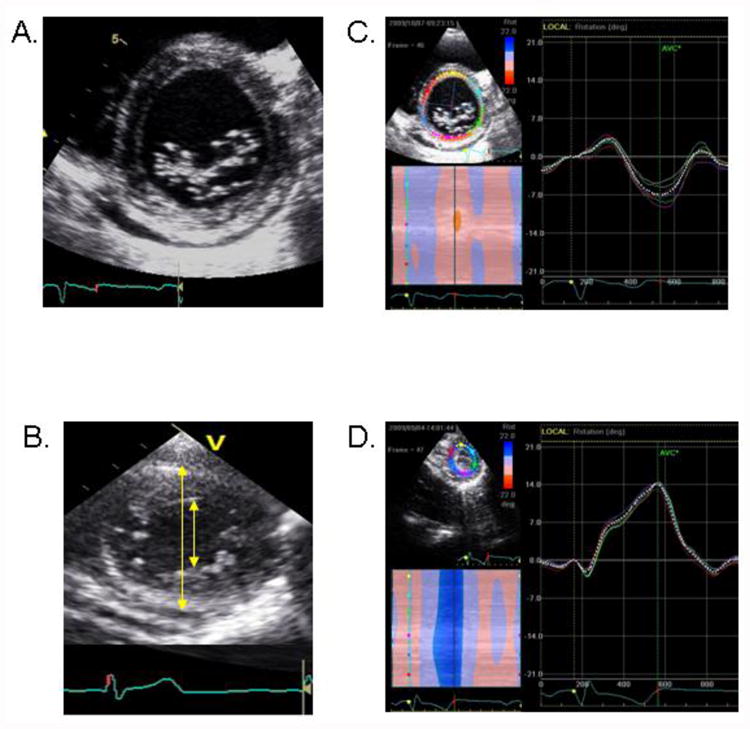
(A) Example of basal imaging level, defined by the presence of full thickness myocardium surrounding the mitral valve at end-systole. (B) Example of apical imaging level, defined by the absence of papillary muscles and the end-diastolic ratio of LV cavity diameter (inner arrow) to total LV diameter (outer arrow) of 0.5. (C) Example of basal rotation data. (D) Example of apical rotation data.
Speckle tracking analysis was used to measure LV rotation and LVT as previously described.17 The highest-quality digital 2-dimensional basal and apical images were selected and the endocardium was traced. A full thickness myocardial region of interest (ROI) was selected and suitable stable objects within this region were tracked. The reliability of tracking was confirmed by the reliability parameter of the system (V = valid tracking; X= unacceptable tracking), and was visually assessed. LV rotation at the basal and apical short-axis planes was determined as the average angular displacement of six myocardial segments. Curves of basal and apical LV rotation, LVT and UTR were automatically generated by the EchoPac software (Figure 1C and 1D). For confirmation and data analysis, raw data were then transferred into worksheets (Microsoft Excel, Seattle, Washington, 2007) for construction of LV rotation and twist versus time curves (Figure 2A and 2B). Peak systolic LVT was calculated as the maximum instantaneous difference between peak systolic apical and basal rotation. Peak early diastolic UTR was defined as the peak untwisting velocity during IVRT. LVT and UTR were examined as absolute, LV length-indexed, and LV diameter-indexed values. The timing of peak systolic apical rotation was determined as a percentage of systolic duration (%). The systolic duration was measured from the onset of the QRS complex to the aortic valve closure.18
Figure 2.
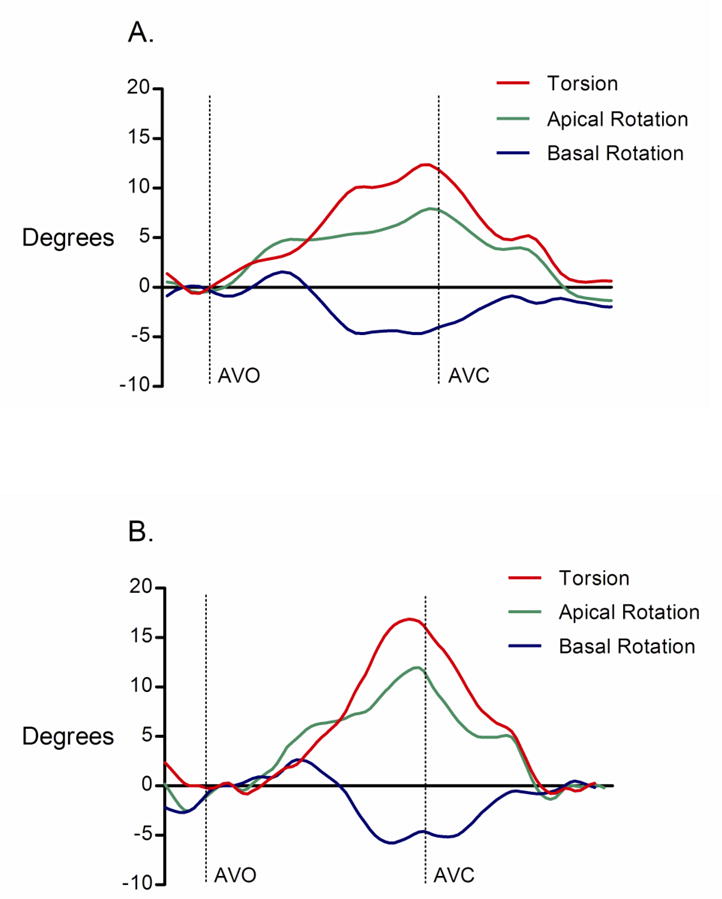
(A) Example of left ventricular torsion (LVT) versus time curve before normal saline infusion. (B) LVT versus time curve from the same study subject after normal saline infusion.
AVO = aortic valve opening; AVC = aortic valve closure.
Inter-observer variability
The inter-observer variability for apical and basal rotation, peak systolic LVT, and peak early diastolic UTR was examined. Measurements were performed in a group of randomly selected subjects by 2 investigators (RBW, ALB) who were unaware of each other's measurements and of the study time point. Correlation coefficients for each measurement, derived from simple linear regression analysis, were used to quantify inter-observer variability for apical rotation (r2 = 0.979), basal rotation (r2 = 0.948), peak systolic LVT (r2 = 0.936), and peak early diastolic UTR (r2 = 0.921).
Statistical analysis
Measurements are presented as means ± standard deviations. Differences in physiologic variables during saline infusion were assessed using repeated measures ANOVA. Baseline and post-saline infusion measurements were assessed for normality and comparisons were then performed using a Student's paired t test for continuous variables. Correlation analysis was performed using the Spearman and Pearson's method as appropriate for data distribution. A p value of <0.05 was considered significant.
Results
Subject characteristics and structural echocardiographic measurements
Eight subjects (male, n=2; female, n=6) aged 25±3 years completed the full protocol. Anthropometric, vital sign, and echocardiographic measurements are shown in Table 1. All individuals had vital signs that were within normal limits and had structurally normal hearts.
Table 1. Baseline subject characteristics and echocardiographic measurements.
| Height (m) | 1.7±0.1 |
| Weight (kg) | 65.2±15.1 |
| Body surface area (m2) | 1.75±0.25 |
| Systolic blood pressure (mmHg) | 115.0±9.3 |
| Diastolic blood pressure (mmHg) | 72.0±5.1 |
| Heart rate (beats / minute) | 79.6±14.3 |
| Respiratory rate (breaths / minute) | 17.1±2.8 |
| LV ejection fraction (%) | 64.8±3.5 |
| LV length (mm) | 78.3±0.6 |
| LV end-diastolic volume (mL) | 90.0±21.6 |
| LV end-systolic volume (mL) | 31.5±8.6 |
| End-diastolic LV internal diameter (mm) | 45.9±3.7 |
| Interventricular septum thickness (mm) | 8.0±1.7 |
| Posterior wall thickness (mm) | 8.3±1.2 |
| LV mass (g) | 119.3±31.8 |
| Left atrial anterior-posterior dimension (mm) | 32.6±3.3 |
Data are presented as mean±SD.
LV indicates left ventricular.
Effects of normal saline infusion
Structural and hemodynamic parameters
Normal saline infusion (2.1±0.3 L) was successfully completed in all subjects. Systolic blood pressure, diastolic blood pressure, heart rate and respiratory rate did not change significantly during saline infusion (Figure 3). There was a significant increase in end-diastolic LV internal diameter (LVIDd, 45.9±3.7 vs. 47.6±4.2 mm, p = 0.002) before and after saline infusion. In contrast, LV length (78.3±0.6 versus 78.1±0.6 mm; p = 0.74) was unchanged. Following saline infusion both LV end-diastolic volume (90.0±21.6 versus 98.3±19.6 mL; p = 0.01) and LV end-systolic volume (31.5±8.6 versus 34.9±8.7 mL; p = 0.005) increased significantly. This translated into a highly significant increase in SV (51.3±10.9 versus 63.0±15.5 mL; p = 0.003; Figure 4A). In a similar fashion, CO increased in each subject (Figure 4B) and the group mean CO increased significantly (3.4±0.8 versus 4.4±1.5 L/min; p = 0.007). The observed increase in CO was driven by SV increase since there was no significant change in heart rate.
Figure 3.
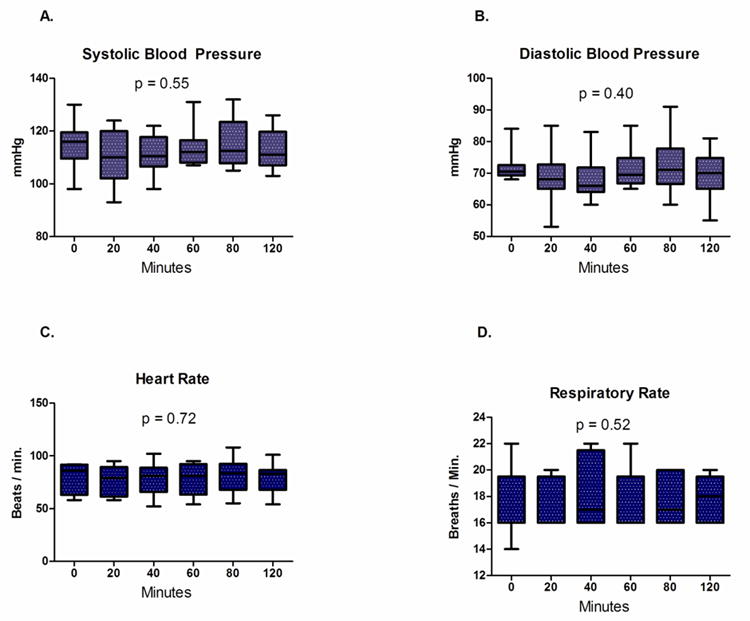
(A) Systolic blood pressure, (B) diastolic blood pressure, (C) heart rate and (D) respiratory rate remained stable during normal saline infusion.
Box = mean ± one standard deviation; whiskers = 5 and 95% confidence intervals.
Figure 4.

(A) Stroke volume before and after saline infusion. (B) Cardiac output before and after saline infusion.
Systolic function
There was no change in LV ejection fraction after saline infusion (64.8±3.5 versus 64.7±3.1 %, p = 0.96). However, there were significant increases in both longitudinal (-20.2±3.0 versus -22.6±1.8 %, p = 0.04) and circumferential (-22.5±2.3 versus -26.0±3.6 %, p = 0.008) LV strains and a trend toward an increase in radial strain (42.0±14.5 versus 50.4±15.3, p = 0.12) following saline administration.
Diastolic function
All trans-mitral Doppler-derived diastolic indices changed significantly following saline infusion. Specifically, early diastolic blood flow velocity (E-wave) increased (77±16 versus 92±13 cm/s; p = 0.01), late diastolic blood flow velocity (A-wave) increased (48±8 versus 64±9 cm/s; p = 0.004), and E-wave deceleration time decreased (198.0±28.7 versus 164.8±2.2 ms; p <0.001). There was also a significant increase in the early (Em) diastolic peak tissue velocity (9.9±1.0 versus 11.0±0.4 cm/s; p = 0.009) and late (Am) diastolic peak tissue velocity (5.2±1.0 versus 5.9±1.0; p < 0.001) as measured adjacent to the septal mitral annulus.
Left ventricular rotation, torsion, and untwisting
There was no significant change in LV length before and after saline infusion, and therefore LV length correction did not change the reported findings and LV length-indexed values are not reported. Although LVIDd was increased after saline infusion, changes in rotation, LVT, and UTR remained significant after indexing for LVIDd. Therefore, all rotation, LVT, and UTR measurements are reported as uncorrected absolute values. In all subjects, peak systolic apical rotation occurred at or near AVC and this timing was unchanged after normal saline infusion (pre-infusion = 96.4±4.9 % systolic duration vs. post-infusion = 97.5±2.9 % systolic duration, p = 0.49). There was a significant increase in peak systolic apical rotation following saline infusion (7.5±2.4 versus 10.5±2.8 degrees; p < 0.001; Figure 5A). In contrast, basal rotation was unchanged following saline infusion (-4.1±2.3 versus -4.8±3.1 degrees; p = 0.44; Figure 5B). This translated into a 33% increase in peak systolic LVT (11.2±1.3 versus 14.9±1.7 degrees; p < 0.001; Figure 6A) and an 89% increase in peak early diastolic UTR (72.3±21.4 versus 136.8±30.0 degrees/s; p < 0.001; Figure 6B) after saline infusion. There was a significant correlation between Δ LVT and Δ UTR (R = 0.68, p = 0.04). In addition, there was a highly significant correlation between Δ SV and Δ UTR (R = 0.91, p = 0.004) and there was a trend toward correlation between Δ SV and Δ LVT (R = 0.59, p = 0.12).
Figure 5.
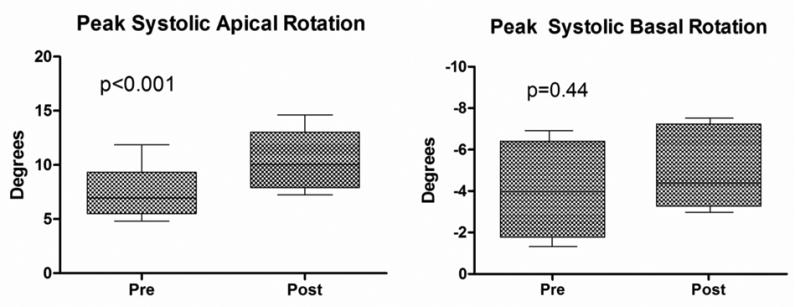
(A) Apical rotation before and after saline infusion. (B) Basal rotation before and after saline infusion.
Box = mean ± one standard deviation; whiskers = 5 and 95% confidence intervals.
Figure 6.
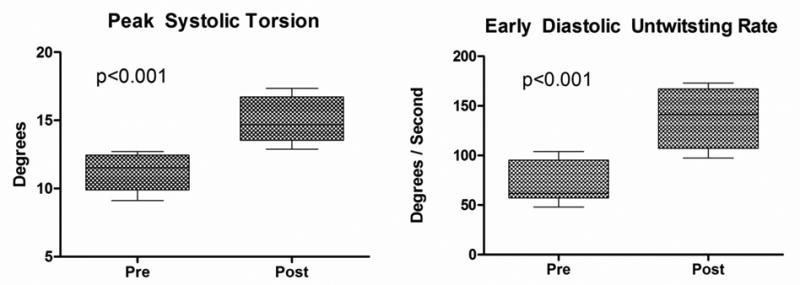
(A) Left ventricular torsion before and after saline infusion. (B) Early diastolic untwisting rate before and after saline infusion.
Box = mean ± one standard deviation; whiskers = 5 and 95% confidence intervals.
Discussion
We used intravenous normal saline infusion to examine the relationship between volume loading and LVT. Saline infusion lead to an increase in end-diastolic LV internal diameter and LV end-diastolic volume. These changes are consistent with an increase in preload, which is supported by the augmentation of SV and CO as predicted by the Frank-Starling principle. In this context, we observed significant changes in LV systolic twisting mechanics resulting in a net increase in peak systolic LVT. In addition to this increase in systolic LVT, we observed a marked increase in peak early diastolic UTR. These results indicate that peak systolic LVT and subsequent early diastolic UTR are significantly altered by cardiac volume loading.
Prior animal studies have demonstrated that manipulation of loading conditions influences the twisting motion of the heart.11,12 Specifically, increased LVT was seen in mongrel dogs after volume loading to increase preload.12 In this prior study of ten isolated, blood-perfused canine hearts, levels of preload were precisely manipulated. Magnetic resonance imaging demonstrated that an increase in preload resulted in an increase in LVT. Furthermore, the load dependence of LVT was supported by the close linear relationship between LVT and SV.12
In contrast, the available data characterizing the relationship between loading conditions and LVT in human hearts suggest that LVT may not be preload dependent. It is noteworthy that these studies included cardiac transplant recipients in whom the myocardium was tagged with radiopaque markers at the time of transplant.13,14 Our results likely differ from these previous human studies for several reasons. First, it has been established that sympathetic and parasympathetic innervation of transplanted hearts is altered,19 and this denervation may result in a non-physiologic response to changes in cardiac load.20 Second, the previously studied transplant patients had an open pericardium and the lack of an intact pericardium may have altered LVT. Indeed, patients with congenital absence of the pericardium have been shown to have markedly decreased LVT compared to normal subjects.21
To our knowledge, our study is the first to examine the effect of intravascular volume loading and presumed preload augmentation on LVT in healthy native human hearts. Data from our study demonstrates that LVT is a preload dependent phenomenon. Further, we have shown that the increase in peak systolic LVT caused by volume loading is driven by the increase in peak systolic apical rotation. This is consistent with prior studies of LVT in which the magnitude of systolic apical counterclockwise rotation was the primary determinant of overall peak systolic LVT.10
The impact of volume loading on LV twisting mechanics was not confined to ventricular systole as we observed a marked increase in the peak early diastolic UTR. Further, our data suggest an important interdependence between systolic twisting and diastolic untwisting based on the significant correlation between LVT and UTR. Although mechanisms responsible for this observation remain incompletely understood, it is known that the magnitude of LVT reflects the amount of energy stored during systolic deformation and subsequently released during early diastole.22, 23 Specifically, early diastolic elastic recoil is thought to result from vigorous contraction and compression of cardiac proteins such as titin.24 It has been proposed that the potential energy stored during systole is released during early diastole, facilitating efficient myocardial relaxation and diastolic filling.24,25 Our data support this notion. Specifically, increases in both load dependent parameters (trans-mitral Doppler velocities) and less load dependent measures (myocardial tissue Doppler velocities) of diastolic function accompanied the observed increase in peak systolic LVT and early diastolic UTR. Furthermore, there was a highly significant correlation between UTR and early (Em) diastolic peak tissue velocity (R = 0.79, p = 0.02) and a trend toward correlation between LVT and Em (R = 0.68, p = 0.06). Consequently, LVT may be a key mechanistic link between systolic and diastolic portions of the cardiac cycle.
There are several implications of our findings. First, our data suggest that peak systolic LVT and early diastolic UTR are dynamic, load dependent properties that may contribute to the well established Frank-Starling relationship. Second, the present findings suggest that preload must be considered in the interpretation of LVT and untwisting data. This is likely to be of particular relevance in populations with known preload alterations such as patients with cardiac disease 6-9 and healthy individuals participating in volitional exercise.26, 27
Limitations
We evaluated young, healthy subjects. This limits the generalizability of our findings to specific cardiac disease states and to older subjects.28 Second, we did not use invasive techniques to measure LV end-diastolic pressure (preload). However, the observed increase in LV end-diastolic volume is consistent with the notion that saline infusion was an effective method of augmenting LV preload.
Conclusions
Our results indicate that peak systolic LVT and peak early diastolic UTR are preload dependent phenomenon in the healthy human heart. Changes in preload should be considered when interpreting the results of future studies of LVT.
Acknowledgments
None
Funding Sources: Supported by Grant Number 1 UL1 RR025758-01, Harvard Clinical and Translational Science Center, from the National Center for Research Resources. The content is solely the responsibility of the authors and does not necessarily represent the official views of the National Center For Research Resources or the National Institutes of Health.
Footnotes
Disclosures: None
References
- 1.McDonald IG. The shape and movements of the human left ventricle during systole. A study by cineangiography and by cineradiography of epicardial markers. Am J Cardiol. 1970;26:221–230. doi: 10.1016/0002-9149(70)90787-3. [DOI] [PubMed] [Google Scholar]
- 2.Beyar R, Sideman S. Effect of the twisting motion on the nonuniformities of transmyocardial fiber mechanics and energy demand--a theoretical study. IEEE Trans Biomed Eng. 1985;32:764–769. doi: 10.1109/TBME.1985.325491. [DOI] [PubMed] [Google Scholar]
- 3.Notomi Y, Popovic ZB, Yamada H, Wallick DW, Martin MG, Oryszak SJ, Shiota T, Greenberg NL, Thomas JD. Ventricular untwisting: a temporal link between left ventricular relaxation and suction. Am J Physiol Heart Circ Physiol. 2008;294:H505–513. doi: 10.1152/ajpheart.00975.2007. [DOI] [PubMed] [Google Scholar]
- 4.Streeter DD, Jr, Spotnitz HM, Patel DP, Ross J, Jr, Sonnenblick EH. Fiber orientation in the canine left ventricle during diastole and systole. Circ Res. 1969;24:339–347. doi: 10.1161/01.res.24.3.339. [DOI] [PubMed] [Google Scholar]
- 5.Esch BT, Warburton DE. Left ventricular torsion and recoil: implications for exercise performance and cardiovascular disease. J Appl Physiol. 2009;106:362–369. doi: 10.1152/japplphysiol.00144.2008. [DOI] [PubMed] [Google Scholar]
- 6.Bansal M, Leano RL, Marwick TH. Clinical assessment of left ventricular systolic torsion: effects of myocardial infarction and ischemia. J Am Soc Echocardiogr. 2008;21:887–894. doi: 10.1016/j.echo.2008.01.011. [DOI] [PubMed] [Google Scholar]
- 7.Kanzaki H, Nakatani S, Yamada N, Urayama S, Miyatake K, Kitakaze M. Impaired systolic torsion in dilated cardiomyopathy: reversal of apical rotation at mid-systole characterized with magnetic resonance tagging method. Basic Res Cardiol. 2006;101:465–470. doi: 10.1007/s00395-006-0603-6. [DOI] [PubMed] [Google Scholar]
- 8.Stuber M, Scheidegger MB, Fischer SE, Nagel E, Steinemann F, Hess OM, Boesiger P. Alterations in the local myocardial motion pattern in patients suffering from pressure overload due to aortic stenosis. Circulation. 1999;100:361–368. doi: 10.1161/01.cir.100.4.361. [DOI] [PubMed] [Google Scholar]
- 9.Maier SE, Fischer SE, McKinnon GC, Hess OM, Krayenbuehl HP, Boesiger P. Evaluation of left ventricular segmental wall motion in hypertrophic cardiomyopathy with myocardial tagging. Circulation. 1992;86:1919–1928. doi: 10.1161/01.cir.86.6.1919. [DOI] [PubMed] [Google Scholar]
- 10.Gibbons Kroeker CA, Ter Keurs HE, Knudtson ML, Tyberg JV, Beyar R. An optical device to measure the dynamics of apex rotation of the left ventricle. Am J Physiol. 1993;265:H1444–1449. doi: 10.1152/ajpheart.1993.265.4.H1444. [DOI] [PubMed] [Google Scholar]
- 11.Gibbons Kroeker CA, Tyberg JV, Beyar R. Effects of load manipulations, heart rate, and contractility on left ventricular apical rotation. An experimental study in anesthetized dogs. Circulation. 1995;92:130–141. doi: 10.1161/01.cir.92.1.130. [DOI] [PubMed] [Google Scholar]
- 12.Dong SJ, Hees PS, Huang WM, Buffer SA, Jr, Weiss JL, Shapiro EP. Independent effects of preload, afterload, and contractility on left ventricular torsion. Am J Physiol. 1999;277:H1053–1060. doi: 10.1152/ajpheart.1999.277.3.H1053. [DOI] [PubMed] [Google Scholar]
- 13.Hansen DE, Daughters GT, 2nd, Alderman EL, Ingels NB, Stinson EB, Miller DC. Effect o f volume loading, pressure loading, and inotropic stimulation on left ventricular torsion in humans. Circulation. 1991;83:1315–1326. doi: 10.1161/01.cir.83.4.1315. [DOI] [PubMed] [Google Scholar]
- 14.Moon MR, Ingels NB, Jr, Daughters GT, 2nd, Stinson EB, Hansen DE, Miller DC. Alterations in left ventricular twist mechanics with inotropic stimulation and volume loading in human subjects. Circulation. 1994;89:142–150. doi: 10.1161/01.cir.89.1.142. [DOI] [PubMed] [Google Scholar]
- 15.Lang RM, Bierig M, Devereux RB, Flachskampf FA, Foster E, Pellikka PA, Picard MH, Roman MJ, Seward J, Shanewise JS, Solomon SD, Spencer KT, Sutton MS, Stewart WJ. Recommendations for chamber quantification: a report from the American Society of Echocardiography's Guidelines and Standards Committee and the Chamber Quantification Writing Group, developed in conjunction with the European Association of Echocardiography, a branch of the European Society of Cardiology. J Am Soc Echocardiogr. 2005;18:1440–1463. doi: 10.1016/j.echo.2005.10.005. [DOI] [PubMed] [Google Scholar]
- 16.Nagueh SF, Appleton CP, Gillebert TC, Marino PN, Oh JK, Smiseth OA, Waggoner AD, Flachskampf FA, Pellikka PA, Evangelista A. Recommendations for the evaluation of left ventricular diastolic function by echocardiography. J Am Soc Echocardiogr. 2009;22:107–133. doi: 10.1016/j.echo.2008.11.023. [DOI] [PubMed] [Google Scholar]
- 17.Notomi Y, Lysyansky P, Setser RM, Shiota T, Popovic ZB, Martin-Miklovic MG, Weaver JA, Oryszak SJ, Greenberg NL, White RD, Thomas JD. Measurement of ventricular torsion by two-dimensional ultrasound speckle tracking imaging. J Am Coll Cardiol. 2005;45:2034–2041. doi: 10.1016/j.jacc.2005.02.082. [DOI] [PubMed] [Google Scholar]
- 18.Chang SA, Kim HK, Kim DH, Kim JC, Kim YJ, Kim HC, Sohn DW, Oh BH, Park YB. Left ventricular twist mechanics in patients with apical hypertrophic cardiomyopathy: assessment with 2D speckle tracking echocardiography. Heart. 2010;96:49–55. doi: 10.1136/hrt.2009.166629. [DOI] [PubMed] [Google Scholar]
- 19.Givertz MM, Hartley LH, Colucci WS. Long-term sequential changes in exercise capacity and chronotropic responsiveness after cardiac transplantation. Circulation. 1997;96:232–237. doi: 10.1161/01.cir.96.1.232. [DOI] [PubMed] [Google Scholar]
- 20.Mettauer B, Zhao QM, Epailly E, Charloux A, Lampert E, Heitz-Naegelen B, Piquard F, di Prampero PE, Lonsdorfer J. VO(2) kinetics reveal a central limitation at the onset of subthreshold exercise in heart transplant recipients. J Appl Physiol. 2000;88:1228–1238. doi: 10.1152/jappl.2000.88.4.1228. [DOI] [PubMed] [Google Scholar]
- 21.Tanaka H, Oishi Y, Mizuguchi Y, Miyoshi H, Ishimoto T, Nagase N, Yamada H, Oki T. Contribution of the pericardium to left ventricular torsion and regional myocardial function in patients with total absence of the left pericardium. J Am Soc Echocardiogr. 2008;21:268–274. doi: 10.1016/j.echo.2007.05.035. [DOI] [PubMed] [Google Scholar]
- 22.Arts T, Veenstra PC, Reneman RS. Epicardial deformation and left ventricular wall mechanisms during ejection in the dog. Am J Physiol. 1982;243:H379–390. doi: 10.1152/ajpheart.1982.243.3.H379. [DOI] [PubMed] [Google Scholar]
- 23.Robinson TF, Factor SM, Sonnenblick EH. The heart as a suction pump. Sci Am. 1986;254:84–91. doi: 10.1038/scientificamerican0686-84. [DOI] [PubMed] [Google Scholar]
- 24.Fukuda N, Sasaki D, Ishiwata S, Kurihara S. Length dependence of tension generation in rat skinned cardiac muscle: role of titin in the Frank-Starling mechanism of the heart. Circulation. 2001;104:1639–1645. doi: 10.1161/hc3901.095898. [DOI] [PubMed] [Google Scholar]
- 25.Helmes M, Lim CC, Liao R, Bharti A, Cui L, Sawyer DB. Titin determines the Frank-Starling relation in early diastole. J Gen Physiol. 2003;121:97–110. doi: 10.1085/jgp.20028652. [DOI] [PMC free article] [PubMed] [Google Scholar]
- 26.Notomi Y, Martin-Miklovic MG, Oryszak SJ, Shiota T, Deserranno D, Popovic ZB, Garcia MJ, Greenberg NL, Thomas JD. Enhanced ventricular untwisting during exercise: a mechanistic manifestation of elastic recoil described by Doppler tissue imaging. Circulation. 2006;113:2524–2533. doi: 10.1161/CIRCULATIONAHA.105.596502. [DOI] [PubMed] [Google Scholar]
- 27.Neilan TG, Ton-Nu TT, Jassal DS, Popovic ZB, Douglas PS, Halpern EF, Marshall JE, Thomas JD, Picard MH, Yoerger DM, Wood MJ. Myocardial adaptation to short-term high-intensity exercise in highly trained athletes. J Am Soc Echocardiogr. 2006;19:1280–1285. doi: 10.1016/j.echo.2006.05.001. [DOI] [PubMed] [Google Scholar]
- 28.Notomi Y, Srinath G, Shiota T, Martin-Miklovic MG, Beachler L, Howell K, Oryszak SJ, Deserranno DG, Freed AD, Greenberg NL, Younoszai A, Thomas JD. Maturational and adaptive modulation of left ventricular torsional biomechanics: Doppler tissue imaging observation from infancy to adulthood. Circulation. 2006;113:2534–2541. doi: 10.1161/CIRCULATIONAHA.105.537639. [DOI] [PubMed] [Google Scholar]


