

Abstract
Mutations in the mtDNA genome have long been suspected to play an important role in cancer. Although most cancer cells harbor mtDNA mutations, the question of whether such mutations are associated with clinical prognosis of lung cancer remains unclear. We resequenced the entire mitochondrial genomes of tumor tissue from a population of 250 Korean patients with non-small cell lung cancer (NSCLC). Our analysis revealed that the haplogroup (D/D4) was associated with worse overall survival (OS) of early-stage NSCLC [adjusted hazard ratio (AHR), 1.95; 95% CI, 1.14–3.33; Ptrend = 0.03]. By comparing the mtDNA variations between NSCLC tissues and matched blood samples, we found that haplogroups M/N and/or D/D4 were hotspots for somatic mutations, suggesting a more complicated mechanism of mtDNA somatic mutations other than the commonly accepted mechanism of sequential accumulation of mtDNA mutations.
Keywords: mitochondria genome, mitochondria mutations, lung cancer survival, haplogroup, mitochondrial genome resequencing
Introduction
The mitochondrion is an essential cellular organelle with three major biological functions: producing most of the cellular energy, generating endogenous reactive oxygen species (ROS), and regulating programmed cell death (apoptosis).1 It has its own genome (mtDNA) maintained in multiple copies, which replicates and inherits independently of the nuclear genome with a maternal-inherited pattern. The mtDNA is a hotspot for mutations because of poor fidelity of mitochondria DNA polymerase, high level of endogenous ROS, and lack of effective mtDNA repair mechanisms.2 Mutations in mtDNA have been linked to mitochondrial dysfunction, deregulation of apoptosis, and many diseases, including cancers.3,4 Both germline and somatic mutations are frequently observed in various carcinomas of breast, stomach, liver, prostate, kidney, bladder, head and neck, and lung cancer.5–7 Furthermore, in vitro studies of transferring a known pathogenic mtDNA mutation into a cell line with depleted mtDNA demonstrate increased tumorigenicity.8–10
Lung cancer is the leading cause of cancer related mortality worldwide.11 Although scientific advances in cancer prevention, early detection, and treatment have been made in the past decades, the general prognosis for lung cancer remains poor, and many environmental and molecular determinants of lung cancer prognosis have not been assessed fully. Survival rates for lung cancer are generally lower than those for most cancers, with an overall five years survival rate for lung cancer of about 17%.12 In the United States, over 80% of lung cancer cases are classified as non-small cell lung cancer (NSCLC).13,14 Previous studies revealed that about 43% of lung cancers had mtDNA mutations,15 and late stages (IIIB and IV) NSCLC had a significantly higher mutation rate than that of early stages.16 By sequencing the whole mtDNA genomes of tumor tissues, non-affected adjacent tissues, and peripheral blood samples from 55 lung cancer patients, Jin et al. did not find any association between mtDNA mutations and gender, age at diagnosis, smoking history, tumor type, or tumor stage.17 To date, however, the impact of mtDNA mutations on the clinical outcomes of NSCLC has not been evaluated.
In this study, we discovered all mtDNA variations in a set of NSCLC tissues from Korean patients by whole mtDNA resequencing and assessed the association of mtDNA variations with clinical outcomes. Furthermore, we identified patterns of mtDNA variations and investigated the associations between these patterns and clinical outcome, in particular survival. Corresponding tumors and matched blood samples were also examined from a subset of patients to examine the relationship of germline and somatic mutations.
Methods
Study population
Since 1995, patients with histologically confirmed NSCLC were recruited at Samsung Medical Center (SMC), Seoul, Korea. The study was approved by the institutional review board, and was conducted in accordance with the principles of the Declaration of Helsinki. Demographic information (including age, sex, and smoking status) was collected at the time of recruitment, and informed consent was obtained to collect follow-up data. Overall survival (OS) was the end point in this analysis, which was calculated from date of diagnosis to date of death or date last known alive. Data were collected from SMC inpatient and outpatient records, database from Korea National Statistical Office, and direct patient or family contact.
Sample collection and DNA isolation
Tumor specimens were collected from patients who underwent surgical resections. After examined by pathologists to remove the necrotic region and the intervening stroma according to the World Health Organization histopathological criteria, the specimens were snap frozen and maintained in liquid nitrogen. Frozen tissues were micro-dissected under a standard dissecting microscope and lightly stained with hematoxylin to identify the portion consisting of 90% or more cancer cells. DNA samples were isolated using DNeasy kit (Qiagen) according to manufacturer suggested protocol. In addition, peripheral lymphocytes were collected from a subset of 64 patients and DNA samples were extracted using the same kit.
Mitochondrial genome resequencing
Whole mitochondrial genomes were sequenced by Affymetrix GeneChip® Human Mitochondrial Resequencing Array 2.0 array (MitoChip), according to the manufacturer suggested protocols.18 For the hypervariable regions I and II that contain the monomorphic stretches, particularly in the regions 67–380 and 16060–16380, the sequences were further validated by capillary sequencing using ABI3730 after amplified by PCR primers HV1F (5’-caccattagcacccaaagct-3’), HV1R (5’-gaggatggtggtcaagggac-3’), HV2F (5’-ctcacgggagctctccatgc-3’), and HV2R (5’-ctgttaaaagtgcataccgcca-3’).
Detection of mitochondrial mutations
We carried out mtDNA analysis as previously described.19 Briefly, the raw image data of Mitochip were initially processed into sequence data by Affymetrix Sequence Analysis Software 4.1, an ABACUS algorithm based software, according to the manufacturer suggested procedures. The sequence data were then analyzed by the Sequencing analysis 5.2 (Applied Biosystems, USA), Sequence Scanner (Applied Biosystems, USA), ChromasPro (Technelysium Pty. Ltd.), and BioEdit (version 7.0.9). The mtDNA variations were identified by comparing with the reference mtDNA sequence (rCRS: Revised Cambridge Reference Sequence of the Human Mitochondrial DNA; GenBank: NC_012920). Insertions and deletions in the hypervariable regions I and II were determined by aligning 478 redundant fragments on the MitoChip with the public database (http://code.open-bio.org) as previously described.20 As the low prevalence of heteroplasmy could not be differentiated from technical errors, only the homoplasmy data were used to determine the somatic mutations. For matched samples, somatic mtDNA mutations were evaluated by comparing mtDNA sequences of the tumor cells with those of the matched normal lymphocytes.
Statistical analysis
Demographic, clinical, and mtDNA variation data were compared using Fisher’s exact and student t-tests. The log-rank test was used as a univariate measure of association between mtDNA variation/haplogroup and the clinical outcomes of NSCLC. Cox proportional hazards models were implemented to investigate how each of these variations/haplogroups impact clinical outcomes in a setting in which other clinical and environmental factors, including age, gender, smoking status (ever vs. never), histological type, and degree of tumor differentiation, may modify the molecular impact. For each series of Cox proportional hazards models, the allele(s) of the rCRS was used as the reference. All statistical testing were conducted at the 0.05 level using SAS software Version 9.1 (SAS Institute, Cary, North Carolina, USA).
The distributions of mtDNA variations within functional locations were evaluated by a modified hypergeometric distribution test.21 The mitochondrial functional locations (including encoded genes) are defined by MITOMAP (http://www.mitomap.org), last edited on 18 August 2009. Variations reported in Human Mitochondrial Genome Database (mtDB, http://www.genpat.uu.se/mtDB/) were used as population controls.
We used dChip software (http://biosun1.harvard.edu/complab/dchip/) to conduct unsupervised hierarchical clustering to search any genetic substructure of mtDNA variations.
Results
Patient characteristics
All samples were collected from NSCLC patients treated with surgical resection at Samsung Medical Center, Seoul, South Korea. Excluding one patient under 18 years old, there were 250 NSCLC patients; 100 (40%) patients had died at the time of analysis. The median follow-up time among censored observations was 36 months (range 7–180 months). Demographic, tumor, and treatment characteristics are listed in Table 1. Majority of the patients are males, corresponding to high prevalence of male smokers in Asian population. As many late-stage (III and IV) patients were not suitable for surgery 181 of 250 samples (72.4%) were collected from the early-stage patients (I and II).
Table 1.
Patient characteristics.
| CHARACTERISTIC | NO | % |
|---|---|---|
| Gender | ||
| Male | 191 | 76.4 |
| Female | 59 | 23.6 |
|
| ||
| Age, median (range) | 62 (34–82) | |
|
| ||
| Smoking status | ||
| Non-smoking | 90 | 36.0 |
| Smoking | 160 | 64.0 |
|
| ||
| Pathological stage | ||
| I | 133 | 53.2 |
| II | 48 | 19.2 |
| III | 60 | 24.0 |
| IV | 9 | 3.6 |
|
| ||
| Histology subtype | ||
| Adenocarcinoma | 203 | 81.2 |
| Squamous carcinoma | 47 | 18.8 |
Mitochondrial genome variations of lung cancer
The Affymetrix MitoChip 2.0 array covers 16,544 bp of human mitochondrial genome from position 13 to 16,557. We obtained high quality sequencing data, defined as sequencing calls from more than 90% samples, at 16,055 (97%) nucleotide positions, and the minimum completeness rate of DNA samples was 99.2%. After the alignment of redundant probes and sequence comparison with the rCRS, we identified 902 mtDNA single nucleotide substitutions or single nucleotide insertions/deletions (indels), with seven variations being complete nucleotide substitutions and 15 variations having variant alleles over 50% of samples in the Korean population. The indels included seven single nucleotide deletions and six single nucleotide insertions in this population. Additionally, there were 228 mtDNA variations with minor variant frequency >2%, including 223 single nucleotide substitutions and five indels. Among identified variations, 798 (88%) single nucleotide variations had been previously reported in mtDB (http://www.genpat.uu.se/mtDB/, 2704 mtDNA sequences downloaded by 23 March 2010).22 The prevalence of 111 novel variations was relatively rare in NSCLC samples, and none of them had variant frequency above 2%. Although the NSCLC variations were distributed throughout mitochondrial genome, they were significantly enriched in the control region (D-loop) of mtDNA, especially in the hypervariable segment 1 and 2 regions, as compared with variations reported in mtDB (Fig. 1). Meanwhile, we identified significantly fewer variations in mitochondria genes encoding 16S ribosomal RNA (MT-RNR2), ATP synthase F0 subunit 6 (MT-ATP6), cytochrome C oxidase subunit III (MT-CO3), and NADH dehydrogenase subunit 4 (MT-ND4). Only 12 (11%) novel variations were located in the control region. Each NSCLC tissue sample had multiple mtDNA variations with a median of 30 variations (range 17–43), excluding seven complete substitutions. In this study, our analyses focused on 228 mtDNA variations with minor variant frequency >2%.
Figure 1.

Genome view of mtDNA variations in NSCLC samples.
Notes: The x-axis is the mitochondrial genome location with functional locations (including encoded genes) marked above. Functional locations are defined by MITOMAP (http://www.mitomap.org), last edited on 18 August 2009. Functional locations less than 20 bp and coding sequences for 22 tRNAs (58–74 bp), which are scattered between other encoded genes, were not shown. Left-side y-axis is the P-value of hypergeometric distribution test of the variations distributed within functional locations. Variations reported in public database mtDB (Human Mitochondrial Genome Database http://www.genpat.uu.se/mtDB/) were used as population controls for hypergeometric distribution test. Positive value of left-side y-axis indicates that there was an enrichment of mtDNA variations within a tested location; and negative value indicates that there were fewer variations identified in NSCLC samples. Dash line corresponds to P = 0.05. Right-side y-axis is the frequency of individual variation in the NSCLC sample set. Blue diamond represents the defining variation of haplogroup D/D4, and green triangle represents the defining variation of haplogroup M/N.
Association between single mtDNA variation and OS
In univariate analyses, except for pathological stage (P < 0.0001), age (P = 0.023), and tumor differentiation (P = 0.003), demographic characters, including gender, smoking status (ever vs. never), and histological subtypes, were not associated with OS of NSCLC (P > 0.247 in all univariate tests). Smoking was strongly associated with males (P < 0.0001), histological subtypes (P < 0.0001), and tumor differentiation (P < 0.001). We carried out our analyses separately in the early-stage patients (median survival time: 20.1 months) and late-stage patients (median survival time: 25.8 months). We identified seven mtDNA variations in early-stage samples significantly associated with the worse OS in crude and/or adjusted analyses (Table 2). Additionally, we also identified that 13 variations in the early-stage sample and 1 variation in the late-stage samples were marginally associated with OS (0.05 < P ≤ 0.1). All of these mtDNA variations were single nucleotide substitutions, and none of the five indel variations was associated with the OS. Furthermore, there were high degrees of associations among mtDNA variations.
Table 2.
OS analysis on single mitochondria variation.
| POSITION | MAP LOCUS/SYMBOL | DESCRIPTION | BASE CHANGE | CODON CHANGE | VARIATION (N) | COX PROPORTIONAL HAZARDS MODEL | HAPLO-GROUP§ | ||
|---|---|---|---|---|---|---|---|---|---|
| HR | AHR† | P‡ | |||||||
| Early stage (I & II, total = 181) | |||||||||
| 489 | MT-HV3 | Hypervariable segment 3 | T->C | 101 | 1.57(0.92–2.67) | 1.64(0.95–2.82) | 0.076 | M | |
| 3010 | MT-RNR2 | 16S ribosomal RNA | G->A | 47 | 1.81 (1.06–3.09) | 1.93(1.13–3.31) | 0.016 | D4 | |
| 4883 | MT-ND2 | NADH dehydrogenase subunit 2 | C->T | syn | 56 | 1.67(0.98–2.86) | 1.87(1.09–3.21) | 0.022 | D |
| 5178 | MT-ND2 | NADH dehydrogenase subunit 2 | C->A | Leu237Met | 56 | 1.67(0.98–2.86) | 1.87(1.09–3.21) | 0.022 | D |
| 8414 | MT-ATP8 | ATP synthase F0 subunit 8 | C->T | Leu17Phe | 46 | 1.84(1.06–3.19) | 1.97(1.13–3.41) | 0.016 | D4 |
| 8584 | MT-ATP6 | ATP synthase F0 subunit 6 | G->A | Ala20Thr | 12 | 0.17(0.02–1.26) | 0.15(0.02–1.1) | 0.062 | |
| 8701 | MT-ATP6 | ATP synthase F0 subunit 6 | A->G | Thr59Ala | 101 | 1.57(0.92–2.67) | 1.64(0.95–2.82) | 0.076 | N |
| 9296 | MT-C03 | Cytochrome c oxidase subunit III | C->T | syn | 9 | 2.37(1.01–5.55) | 3.53(1.43–8.72) | 0.006 | D4b2b |
| 9540 | MT-C03 | Cytochrome c oxidase subunit III | T->C | syn | 101 | 1.57(0.92–2.67) | 1.64(0.95–2.82) | 0.076 | N |
| 10400 | MT-ND3 | NADH dehydrogenase subunit 3 | C->T | Thr114Ala | 69 | 1.7(0.97–2.96) | 1.7(0.96–3.01) | 0.067 | M |
| 10873 | MT-ND4 | NADH dehydrogenase subunit 4 | T->C | syn | 99 | 1.63(0.95–2.77) | 1.72(1–2.98) | 0.051 | N |
| 12705 | MT-ND5 | NADH dehydrogenase subunit 5 | C->T | syn | 128 | 1.65(0.87–3.12) | 1.96(1.01–3.8) | 0.045 | |
| 14668 | MT-ND6 | NADH dehydrogenase subunit 6 | C->T | syn | 46 | 1.92(1.12–3.28) | 2.08(1.21–3.56) | 0.008 | D4 |
| 14783 | MT-CYB | Cytochrome b | T->C | syn | 100 | 1.58(0.93–2.7) | 1.65(0.96–2.84) | 0.071 | M |
| 15043 | MT-CYB | Cytochrome b | G->A | syn | 100 | 1.66(0.96–2.85) | 1.73(1–3.01) | 0.052 | M |
| 15301 | MT-CYB | Cytochrome b | G->A | syn | 100 | 1.58(0.93–2.7) | 1.65(0.96–2.84) | 0.071 | N |
| 16182 | MT-HV1 | Hypervariable segment 1 | A->C | noncoding | 30 | 0.41 (0.15–1.14) | 0.36(0.13–1.01) | 0.052 | |
| 16189 | MT-HV1 | Hypervariable segment 1 | T->C | noncoding | 67 | 0.62(0.35–1.11) | 0.56(0.31–1.01) | 0.052 | |
| 16223 | MT-HV1 | Hypervariable segment 1 | C->T | noncoding | 124 | 1.56(0.86–2.85) | 1.74(0.93–3.23) | 0.081 | |
| 16319 | MT-HV1 | Hypervariable segment 1 | G->A | noncoding | 26 | 0.39(0.14–1.07) | 0.4(0.15–1.12) | 0.081 | D |
| Late stage (III/IV, total=69) | |||||||||
| 16234 | MT-HV1 | Hypervariable segment 1 | C->T | noncoding | 4 | 3.07(1.07–8.76) | 3.02 (0.94–9.69) | 0.064 | |
Abbreviations: AHR, adjusted hazard ratio; HR, hazard ratio; mtDB, human mitochondrial genome database; syn, synonymous nucleotide change.
Notes: Frequencies of mtDNA variations reported in mtDB were calculated based on the last edit by 3/1/2007.
Adjusted by age, gender, smoking status, histological type, and degree of tumor differentiation.
P-values of the adjusted Cox proportional hazards model analyses.
mtDNA haplogroup manually identified with reference to mitochondrial phylogenetic tree build 9, released by 20 July 2010 (www.phylotree.org).
mtDNA variation profiles detected by unsupervised hierarchical clustering analysis
Because mtDNA genome is small and some of the identified variations were highly correlated, we did not correct multiple comparisons for individual mtDNA variation, with the expectation that none of them would reach genome-level significance. Instead, we conducted a profiling search for substructures of 228 mtDNA variations using unsupervised hierarchical clustering in the studied tumor tissues. The results, which are illustrated in Figure 2, were further manually mapped to the mtDNA haplogroups in the phylogenetic tree of global human mitochondrial DNA variation (http://www.phylotree.org/, mtDNA tree build 9, released on 20 June 2010).23 We identified two major overlapping substructures. One was the largest substructure found in 141 samples with nine variations, which corresponded to all defining variations for haplogroup M (T489C, C10400T, T14783C, and G15043A) and all defining variations for haplogroup N (A8701G, T9540C, A10398G, T10873C, and G15301A). The other substructure of mtDNA variations was smaller and found in 68 samples; it had six variations corresponding to all defining variations for haplogroup D (C4883T, C5178A, and T16362C) and defining variations for haplogroup D4 (G3010A, C8414T, and C14668T). The mtDNA substructure D/D4 was fully embedded within the substructure M/N. The combination of two substructures (D/D4/M/N) divided the NSCLC samples into three groups, including 68 subjects with both substructures (D/D4), 73 samples with only substructure M/N but no D/D4 (M/N-only), and 109 samples without variations in either substructures. There were no significant differences in the distributions of substructure D/D4, substructure M/N-only, and neither D/D4 nor M/N-only between the early-stage and the late-stage patients (P = 0.84). Moreover, the majority of variations significantly associated with the worse OS in early-stage samples (Table 2) were defining variations of the mtDNA substructures. Furthermore, all of the remaining smaller substructures of lung cancer tissues identified by unsupervised hierarchical clustering could also be mapped to certain mtDNA haplogroups.
Figure 2.

Population structure of mtDNA variations identified by unsupervised hierarchical clustering.
Notes: The analysis was carried out by dChip software on 228 mtDNA variations with minor variant frequency >2%, with row corresponding to individual variation and column representing individual NSCLC sample. Blue color circles are the mtDNA haplogroups manually identified with reference to mitochondrial phylogenetic tree build 9, released by 20 July 2010 (www.phylotree.org).
We then tested the association between mtDNA substructures and OS. In univariate test, the mtDNA substructure D/D4 was significantly associated with OS of lung cancer in early-stage samples, whereas the combination of two substructures (D/D4/M/N) had only marginal association (Fig. 3). The substructure M/N-only was not associated with OS of lung cancer in early-stage samples (log-rank test: P = 0.75). There were similar results in the adjusted modeling with D/D4 (adjusted hazard ratio, AHR = 1.95; 95% confidence interval, 95% CI: 1.14–3.33; P = 0.033), combination of two substructures (AHR = 1.44; 95% CI: 1.06–1.96; P = 0.034), and M/N-only (AHR = 1.67; 95% CI: 0.97–2.87; P = 0.07). When cross-examined with the results of single variation analyses, we found that all of the defining mutations of the two mtDNA substructures had already been included in Table 2.
Figure 3.
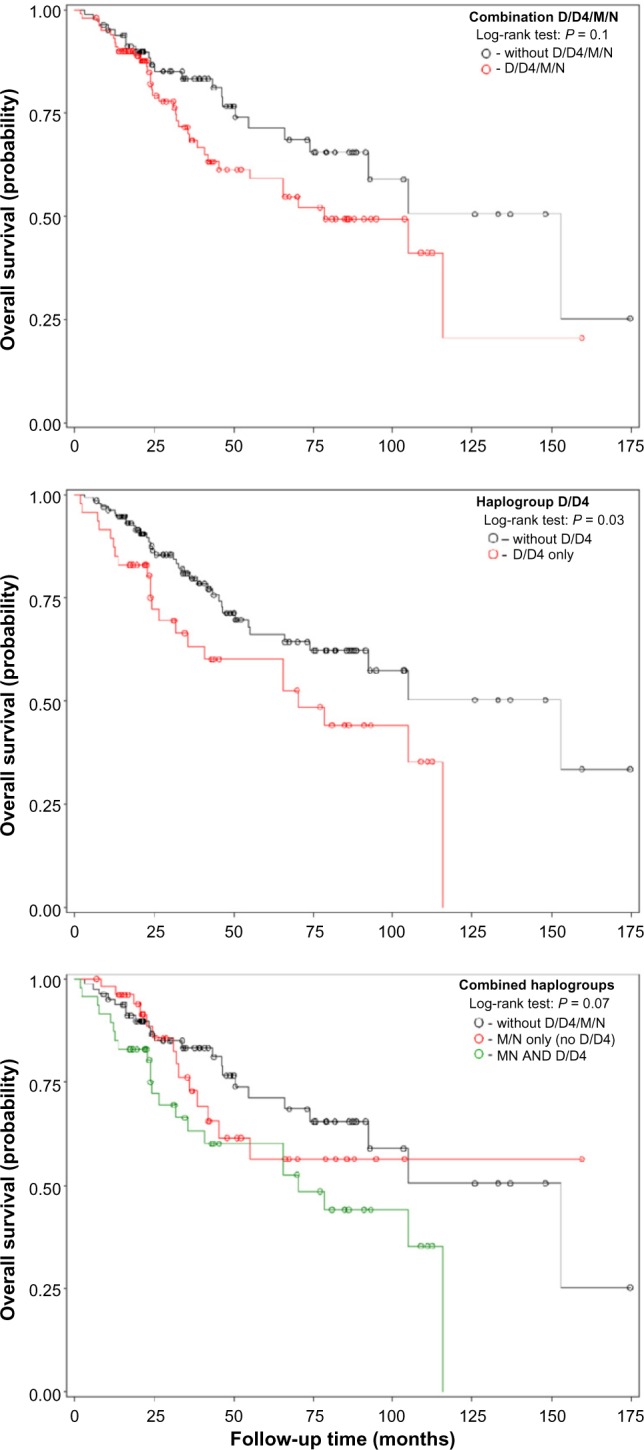
Kaplan–Meier survival estimates of OS among NSCLC according to mtDNA haplogroups.
Variation profiles between tumor tissue and matched blood samples
We further compared the mtDNA variations between NSCLC samples and matched blood samples by genotyping 103 variations (including 87 variations used in the single variation analysis) on a subset of 64 NSCLC patients with matched blood samples. Compared to rCRS, we identified a total of 1,651 variations in NSCLC samples and matched blood samples. Only 263 (16%) variations are somatic mutations in NSCLC samples, which were different from the matched blood samples. As illustrated in Figure 4, majority of somatic mutations (93%) were clustered in 12 patients (19%). Moreover, two major substructures (haplogroups M/N and D/D4), identified by unsupervised hierarchical clustering, were hotspots for somatic mutation, accounting for approximately 39% of the total somatic mutations. Although the defining mutations of these haplogroups scattered around the entire mitochondrial genome, the somatic mutations occurred as turnover together at all or majority of these sites. Only one patient had a single somatic mutation in haplogroup M/N. Furthermore, somatic turnover occurred in both directions with similar prevalence: from the reference alleles of rCRS in the blood samples to variant alleles in the tumor samples or from variant alleles in the blood samples to the reference alleles in the tumor samples.
Figure 4.
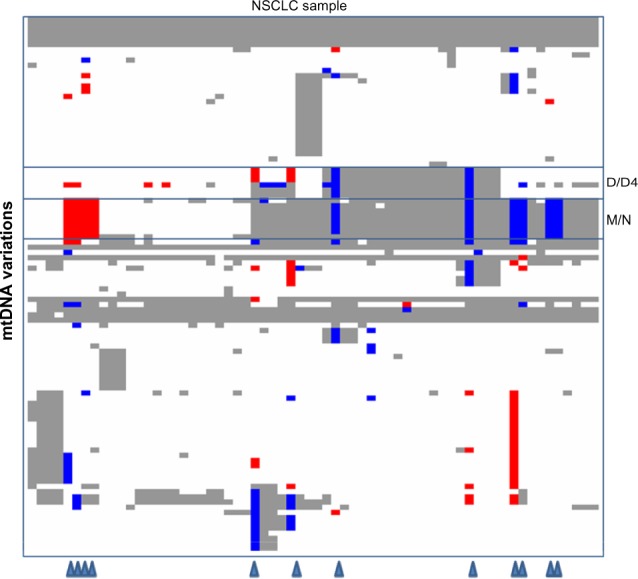
Distribution of germline vs. somatic mutations in a subset of NSCLC patients.
Notes: The diagram was generated by dChip software on 103 mtDNA variations from 64 patients who had provided the matched blood samples, with row corresponding to individual variation and column representing individual NSCLC sample. For each pair of sample, genotypes at each tested site were compared between tumor sample and matched blood sample. Gray/white color represents that NSCLC sample and blood sample had the same genotypes, suggesting that NSCLC sample had a germline allele at this site. White color represents that the paired samples had the same allele as the reference mtDNA sequence (rCRS: Revised Cambridge Reference Sequence of the Human Mitochondrial DNA; GenBank: NC_012920); and gray color represents the variant allele. Blue/red color represents that NSCLC sample and blood sample had different genotypes, suggesting that NSCLC sample had a somatic mutation at this site. Blue color represent that the blood sample had the variant allele and the NSCLC sample had the reference allele. Red color represent that the blood sample had the reference allele and the NSCLC sample had the variant allele. Triangles at the bottom indicate the patients having the majority of somatic mutations.
Coexistence of defining variations in mutually exclusive haplogroups M and N
Based on the phylogenetic tree, the defining variations of haplogroups M and N are mutually exclusive. On the contrary, we found the coexistence of defining variations of both haplogroups in the studied population. We further conducted database queries of 7,843 entire human mtDNA sequences at PhyloTree.org (updated 14 August 2010). We selected several studies including Asian samples and examined the haplogroups generated by SEN-SNiP (http://www.bioinfo.de/isb/2009/09/0026/). By checking the reported variations of individual mtDNA sample, we could easily identify coexistence of all defining variations of both haplogroups M and N in individuals from China (eg, mtDNA genome FJ198217.1 and FJ198218.1),24 India (eg, mtDNA genome AY922253.1 and AY922254.1),25 and Japan (eg, mtDNA genome AP008249.1, AP008250.1, and AP008255.1),26 even though these studies failed to identify the coexistence and treated as to completely separated lineages.
Discussion
In this study, we applied mitochondrial whole-genome resequencing to investigate comprehensively the relationship of mitochondrial variations in tumor tissues and OS of NSCLC. Initially, we identified several mtDNA variations associated with the OS of NSCLC. Using unsupervised profiling, we identified two major substructures of mtDNA variations with the smaller substructure imbedded completely within the larger one. Follow-up manual curation revealed that these substructures represented two combinations of mtDNA haplogroups, including D/D4 and M/N, respectively, which are common in Asian populations, including Koreans.27,28 Smaller mtDNA substructure D/D4 and its imbedded substructure (D/D4/M/N) were significantly associated with worse OS of early-stage NSCLC. Thus, in the Korean population, specific mtDNA haplogroups but not individual mtDNA variations were associated with the worse OS of early-stage NSCLC. The association with haplogroup M/N seems to be driven by the imbedded haplogroup D/D4. This conclusion was further supported by the observation that the variation C9296T, a defining mutation of haplogroup D4b2b, which was a subclade of haplogroup D4 on phylogenetic tree,23 had the strongest association in individual variation analysis.
The observed haplogroup association might be driven, as least partially, by germline mutations in the studied population. This finding is plausible because somatic mutations in cancer are random events and a haplogroup is a combination of variations at different locations of mtDNA genome that are transmitted together. As the associated haplogroup D/D4 is a common haplogroup in a normal Korean population27,28 and also a popular substructure in the tested NSCLC samples, it is not likely that somatic mutations establish simultaneously all of the defining variations in a large proportion of tumor tissues. Our analysis of somatic mutations by genotyping a subset of NSCLC patients supports this hypothesis. Actually, most of the tumor samples (66%), including those having haplogroup D/D4 and/or its parental haplogroup M/N, did not harbor any somatic mutations.
Moreover, all of 12 samples, having the majority of somatic mutations, had multiple somatic mutations in haplogroup M/N (8 samples), D/D4 (2 samples), or both (2 samples); and 10 of 12 defining variations of haplogroups M/N and D/D4 were the most frequent sites for somatic mutations (≥4 per sample), comparing with median 1 somatic mutation per sample (range 0–11) for the entire genotyping dataset.19 Furthermore, the somatic mutations occurred on the haplogroups M/N and D/D4 were characterized by complete or major turnover of the defining mutations in both directions. These findings not only suggest that haplogroups M/N and/or D/D4 were the hotspots for somatic mutations, but also suggest a more complicated mechanism of mtDNA somatic mutations other than the commonly accepted mechanism of sequential accumulation of mtDNA mutation.4
One of the major findings was the coexistence of all defining variations of mtDNA haplogroups M and N in majority of samples (56%), presuming common germline mutations in Koreans. According to the mitochondrial phylogenetic tree that uses haplogroups representing the major branch points, haplogroup M and N are two sibling super-haplogroups that define out of Africa migration, as it is generally accepted that all mtDNA haplogroups found outside of Africa are descendants of either haplogroup N or its sibling haplogroup M.27,29 The defining variations of two haplogroups should be mutually exclusive, which contradicts our sequencing results. In this study, of 211 samples having compete sequencing data on all defining mtDNA positions for haplogroup M and N, we found that 184 samples (87%) had identical sequences of either all or none of the defining variations, with rest of the samples having only one (12%) or two (1%) discrepancies. All samples had a complete variation profile of haplogroup H2a2a (Fig. 2) and its parent haplogroups (H2a2, H2a, H2, H, HV, and R0), which were subclades of haplogroup N; whereas the NSCLC outcome associated haplogroups D/D4 were the subclades of haplogroup M. In contrast to our findings, there has been no report on the coexistence of defining variations of haplogroup M and N, even though we could identify the coexistence from the published sequence data. It seems that there were some defects in the phylogenetic program with a built-in algorithm that treated super-haplogroups as separated lineages. Therefore, a new phylogenetic program should be developed and mtDNA sequences should reassessed.
Except for variation T16362C, which was not associated with NSCLC outcome, all of the rest five defining variations of haplogroup D/D4 were located in the coding regions of mtDNA genome. Among them, variation C5178A and C8414T were non-synonymous variations (Table 2), resulting in amino acid substitutions in gene NADH dehydrogenase subunit 2 (Leu237Met) and ATP synthase F0 subunit 8 (Leu17Phe), respectively. Variation G3010A was located in gene encoding region of 16S ribosomal RNA. Several molecular epidemiological studies in Japanese population demonstrated that these variations were associated with longevity.30,31 Variation C5178A was associated with significantly higher serum levels of high-density lipoprotein cholesterol and lower blood triglyceride, which was prone to resist adult-onset diseases by suppressing obesity and atherosclerosis in Japanese.32–34 However, other studies did not replicate the association of this variation with longevity in Chinese,35 but found the association with decreased longevity in the population of Costa Rica.36 A recent study replicated the association with longevity in Japanese, but pinpointed to a subclade haplogroup D4a.37 As the defining variations of haplogroup D4a had high associations with the previous reported variations, the previous reported longevity-association with C5178A and other variations might entirely due to population structure, which could not be replicated in other populations. It was possible that the observed association of haplogroup D/D4 with the worse OS in early-stage NSCLC patients was caused by genetic structures in the studied population, which were highly associated with unidentified causal mutations. On the other hand, the existence of highly associated mtDNA variations in different populations, which were characterized by differential distributions of specific haplogroups, created additional complexities for adjusting multiple comparisons and identifying causal mutations in association studies. Additional population-based studies in a larger set of samples are needed to replicate our findings or further pinpoint to any subclade of mtDNA haplogroups. Moreover, follow up in vitro and in vivo functional experiments are also required to validate the results from populations.
A limitation of our study was the small sample size which prevented us to further assess the associations in the smaller haplogroups. We also did not find any association between mtDNA variations/haplogroups and the cancer recurrence, which could be explained by an even smaller sample set because we could not collect recurrence data from 43 (17%) NSCLC patients. Instead of investigating the whole-genome sequence, in this study, we could only examine somatic mutations at limited variations sites on a subset of patients who had provided the matched blood samples. We observed that only a small proportion of tumor samples had harbored extensive somatic mutations in certain hotspots with simultaneous turnover at defining sits of mtDNA haplogroups. However, we should pay special attentions to interpret and apply these results, even though there were no significant difference in demographic characters between this subset and the entire set of samples. In addition, the information on the cause of death was not available in this study.
Mitochondrial defects have long been suspected to play an important role in the development of cancer, and the human mtDNA genome has been completely sequenced to identify and characterize all encoded genes over a decade. To our knowledge, this is the first study of using mitochondrial whole-genome resequencing to investigate the associations of mitochondrial variations in tumor tissues with the clinical outcomes of NSCLC. Despite of its smaller size, the unique characters of mitochondrial genome, including maternally inherited pattern without recombination, multiple copies, and prone to mutations, require different genomic approaches to dissect the relationships between mtDNA variations and diseases. Specifically, future research should address the interactions between mtDNA variation and polymorphism on nuclear genome.
Acknowledgments
The authors would like to thank the individuals who participated in the study and whose contribution made this work possible. We thank our valued colleagues who contributed to the data collection, sample handling, genotyping, and data analysis.
Footnotes
Author Contributions
Conceived and designed the experiments: SC, JK, DCC. Analyzed the data: ZW, YTH, FC, YZ, XL, DN. Wrote the first draft of the manuscript: ZW, SC. Contributed to the writing of the manuscript: YTH, JK, DN, DCC. Agree with manuscript results and conclusions: ZW, SC, JL, YTH, FC, YZ, XL, DN, JK, DCC. Jointly developed the structure and arguments for the paper: ZW, SC. Made critical revisions and approved final version: DN, JK, DCC. All authors reviewed and approved of the final manuscript.
ACADEMIC EDITOR: JT Efird, Editor in Chief
FUNDING: This work was supported by Samsung Advanced Institute of Technology, Samsung Electronics Co. Ltdl., Samsung Biomedical Research Institute grant, # SBRI C-A6–411, C-A7–802, and the National Research Foundation of Korea (NRF) grant funded by the Korean government (MEST) (No. R01–2006–000–11114–0 and NTX 2091113). This work was also supported by NIH grants CA 074386, CA 090578, and CA 092824. The authors confirm that the funder had no influence over the study design, content of the article, or selection of this journal.
COMPETING INTERESTS: Authors disclose no potential conflicts of interest.
This paper was subject to independent, expert peer review by a minimum of two blind peer reviewers. All editorial decisions were made by the independent academic editor. All authors have provided signed confirmation of their compliance with ethical and legal obligations including (but not limited to) use of any copyrighted material, compliance with ICMJE authorship and competing interests disclosure guidelines and, where applicable, compliance with legal and ethical guidelines on human and animal research participants. Provenance: the authors were invited to submit this paper.
REFERENCES
- 1.Wallace DC. A mitochondrial paradigm of metabolic and degenerative diseases, aging, and cancer: a dawn for evolutionary medicine. Annu Rev Genet. 2005;39:359–407. doi: 10.1146/annurev.genet.39.110304.095751. [DOI] [PMC free article] [PubMed] [Google Scholar]
- 2.Maximo V, Lima J, Soares P, Sobrinho-Simoes M. Mitochondria and cancer. Virchows Arch. 2009;454(5):481–95. doi: 10.1007/s00428-009-0766-2. [DOI] [PubMed] [Google Scholar]
- 3.Enns GM. The contribution of mitochondria to common disorders. Mol Genet Metab. 2003;80(1–2):11–26. doi: 10.1016/j.ymgme.2003.08.009. [DOI] [PubMed] [Google Scholar]
- 4.Brandon M, Baldi P, Wallace DC. Mitochondrial mutations in cancer. Oncogene. 2006;25(34):4647–62. doi: 10.1038/sj.onc.1209607. [DOI] [PubMed] [Google Scholar]
- 5.Chatterjee A, Mambo E, Sidransky D. Mitochondrial DNA mutations in human cancer. Oncogene. 2006;25(34):4663–74. doi: 10.1038/sj.onc.1209604. [DOI] [PubMed] [Google Scholar]
- 6.Suzuki M, Toyooka S, Miyajima K, et al. Alterations in the mitochondrial displacement loop in lung cancers. Clin Cancer Res. 2003;9(15):5636–41. [PubMed] [Google Scholar]
- 7.Czarnecka AM, Golik P, Bartnik E. Mitochondrial DNA mutations in human neoplasia. J Appl Genet. 2006;47(1):67–78. doi: 10.1007/BF03194602. [DOI] [PubMed] [Google Scholar]
- 8.Petros JA, Baumann AK. Ruiz-Pesini E, et al. mtDNA mutations increase tumorigenicity in prostate cancer. Proc Natl Acad Sci U S A. 2005;102(3):719–24. doi: 10.1073/pnas.0408894102. [DOI] [PMC free article] [PubMed] [Google Scholar]
- 9.Ohta S. Contribution of somatic mutations in the mitochondrial genome to the development of cancer and tolerance against anticancer drugs. Oncogene. 2006;25(34):4768–76. doi: 10.1038/sj.onc.1209602. [DOI] [PubMed] [Google Scholar]
- 10.Shidara Y, Yamagata K, Kanamori T, et al. Positive contribution of pathogenic mutations in the mitochondrial genome to the promotion of cancer by prevention from apoptosis. Cancer Res. 2005;65(5):1655–63. doi: 10.1158/0008-5472.CAN-04-2012. [DOI] [PubMed] [Google Scholar]
- 11.ACS X. Estimated New Cancer Cases and Deaths by Sex for All Sites U. 2007. Cancer Facts & Figures 2007. [Google Scholar]
- 12.Parkin DM, Bray F, Ferlay J, Pisani P. Global cancer statistics, 2002. CA Cancer J Clin. 2005;55(2):74–108. doi: 10.3322/canjclin.55.2.74. [DOI] [PubMed] [Google Scholar]
- 13.Mountain CF, Lukeman JM, Hammar SP, et al. Lung cancer classification: the relationship of disease extent and cell type to survival in a clinical trials population. J Surg Oncol. 1987;35(3):147–56. doi: 10.1002/jso.2930350302. [DOI] [PubMed] [Google Scholar]
- 14.Ginsberg R, Vokes E, Raben A. Non-small cell lung cancer: diagnosis and staging. In: Devita VJ, Hellman S, Rosenberg S, editors. Cancer: Principles and Practice of Oncology. 5th ed. Philadelphia: Lippincott-Raven; 1997. pp. 868–76. [Google Scholar]
- 15.Fliss MS, Usadel H, Caballero OL, et al. Facile detection of mitochondrial DNA mutations in tumors and bodily fluids. Science. 2000;287(5460):2017–9. doi: 10.1126/science.287.5460.2017. [DOI] [PubMed] [Google Scholar]
- 16.Matsuyama W, Nakagawa M, Wakimoto J, Hirotsu Y, Kawabata M, Osame M. Mitochondrial DNA mutation correlates with stage progression and prognosis in non-small cell lung cancer. Hum Mutat. 2003;21(4):441–3. doi: 10.1002/humu.10196. [DOI] [PubMed] [Google Scholar]
- 17.Jin X, Zhang J, Gao Y, et al. Relationship between mitochondrial DNA mutations and clinical characteristics in human lung cancer. Mitochondrion. 2007;7(5):347–53. doi: 10.1016/j.mito.2007.06.003. [DOI] [PubMed] [Google Scholar]
- 18.Lévêque M, Marlin S, Jonard L, et al. Whole mitochondrial genome screening in maternally inherited non-syndromic hearing impairment using a microarray resequencing mitochondrial DNA chip. Eur J Hum Genet. 2007;15(11):1145–55. doi: 10.1038/sj.ejhg.5201891. [DOI] [PubMed] [Google Scholar]
- 19.Choi SJ, Kim SH, Kang HY, et al. Mutational hotspots in the mitochondrial genome of lung cancer. Biochem Biophys Res Commun. 2011;407(1):23–7. doi: 10.1016/j.bbrc.2011.02.078. [DOI] [PubMed] [Google Scholar]
- 20.Hartmann A, Thieme M, Nanduri LK, et al. Validation of microarray-based resequencing of 93 worldwide mitochondrial genomes. Hum Mutat. 2009;30(1):115–22. doi: 10.1002/humu.20816. [DOI] [PubMed] [Google Scholar]
- 21.Wang Z, Neuburg D, Li C, et al. Global gene expression profiling in whole-blood samples from individuals exposed to metal fumes. Environ Health Perspect. 2005;113(2):233–41. doi: 10.1289/txg.7273. [DOI] [PMC free article] [PubMed] [Google Scholar]
- 22.Ingman M, Gyllensten U. mtDB: Human Mitochondrial Genome Database, a resource for population genetics and medical sciences. Nucleic Acids Res. 2006;34(Database issue):D749–51. doi: 10.1093/nar/gkj010. [DOI] [PMC free article] [PubMed] [Google Scholar]
- 23.van Oven M, Kayser M. Updated comprehensive phylogenetic tree of global human mitochondrial DNA variation. Hum Mutat. 2009;30(2):E386–94. doi: 10.1002/humu.20921. [DOI] [PubMed] [Google Scholar]
- 24.Ji Y, Zhang AM, Jia X, et al. Mitochondrial DNA haplogroups M7b1’2 and M8a affect clinical expression of Leber hereditary optic neuropathy in Chinese families with the m.11778G→a mutation. Am J Hum Genet. 2008;83(6):760–8. doi: 10.1016/j.ajhg.2008.11.002. [DOI] [PMC free article] [PubMed] [Google Scholar]
- 25.Sun C, Kong QP, Palanichamy MG, et al. The dazzling array of basal branches in the mtDNA macrohaplogroup M from India as inferred from complete genomes. Mol Biol Evol. 2006;23(3):683–90. doi: 10.1093/molbev/msj078. [DOI] [PubMed] [Google Scholar]
- 26.Tanaka M, Cabrera VM, González AM, et al. Mitochondrial genome variation in eastern Asia and the peopling of Japan. Genome Res. 2004;14(10 A):1832–50. doi: 10.1101/gr.2286304. [DOI] [PMC free article] [PubMed] [Google Scholar]
- 27.Macaulay V, Hill C, Achilli A, et al. Single, rapid coastal settlement of Asia revealed by analysis of complete mitochondrial genomes. Science. 2005;308(5724):1034–6. doi: 10.1126/science.1109792. [DOI] [PubMed] [Google Scholar]
- 28.Lee HY, Yoo JE, Park MJ, Chung U, Kim CY, Shin KJ. East Asian mtDNA haplogroup determination in Koreans: haplogroup-level coding region SNP analysis and subhaplogroup-level control region sequence analysis. Electrophoresis. 2006;27(22):4408–18. doi: 10.1002/elps.200600151. [DOI] [PubMed] [Google Scholar]
- 29.Metspalu M, Kivisild T, Metspalu E, et al. Most of the extant mtDNA boundaries in south and southwest Asia were likely shaped during the initial settlement of Eurasia by anatomically modern humans. BMC Genet. 2004;5:26. doi: 10.1186/1471-2156-5-26. [DOI] [PMC free article] [PubMed] [Google Scholar]
- 30.Tanaka M, Gong JS, Zhang J, Yoneda M, Yagi K. Mitochondrial genotype associated with longevity. Lancet. 1998;351(9097):185–6. doi: 10.1016/S0140-6736(05)78211-8. [DOI] [PubMed] [Google Scholar]
- 31.Alexe G, Fuku N, Bilal E, et al. Enrichment of longevity phenotype in mtDNA haplogroups D4b2b, D4a, and D5 in the Japanese population. Hum Genet. 2007;121(3–4):347–56. doi: 10.1007/s00439-007-0330-6. [DOI] [PubMed] [Google Scholar]
- 32.Kokaze A, Ishikawa M, Matsunaga N, et al. Association of the mitochondrial DNA 5178 A/C polymorphism with serum lipid levels in the Japanese population. Hum Genet. 2001;109(5):521–5. doi: 10.1007/s004390100602. [DOI] [PubMed] [Google Scholar]
- 33.Tanaka M, Gong J, Zhang J, Yamada Y, Borgeld HJ, Yagi K. Mitochondrial genotype associated with longevity and its inhibitory effect on mutagenesis. Mech Ageing Dev. 2000;116(2–3):65–76. doi: 10.1016/s0047-6374(00)00149-4. [DOI] [PubMed] [Google Scholar]
- 34.Takagi K, Yamada Y, Gong JS, Sone T, Yokota M, Tanaka M. Association of a 5178C→A (Leu237Met) polymorphism in the mitochondrial DNA with a low prevalence of myocardial infarction in Japanese individuals. Atherosclerosis. 2004;175(2):281–6. doi: 10.1016/j.atherosclerosis.2004.03.008. [DOI] [PubMed] [Google Scholar]
- 35.Yao YG, Kong QP, Zhang YP. Mitochondrial DNA 5178A polymorphism and longevity. Hum Genet. 2002;111(4–5):462–3. doi: 10.1007/s00439-002-0826-z. [DOI] [PubMed] [Google Scholar]
- 36.Castri L, Melendez-Obando M, Villegas-Palma R, et al. Mitochondrial polymorphisms are associated both with increased and decreased longevity. Hum Hered. 2009;67(3):147–53. doi: 10.1159/000181152. [DOI] [PMC free article] [PubMed] [Google Scholar]
- 37.Bilal E, Rabadan R, Alexe G, et al. Mitochondrial DNA haplogroup D4a is a marker for extreme longevity in Japan. PLoS One. 2008;3(6):e2421. doi: 10.1371/journal.pone.0002421. [DOI] [PMC free article] [PubMed] [Google Scholar]