

Abstract
Hyperglycemia results in increased oxygen consumption and decreased oxygen tension in the kidney. We tested the hypothesis that activation of hypoxia-inducible factors (HIFs) protects against diabetes-induced alterations in oxygen metabolism and kidney function. Experimental groups consisted of control and streptozotocin-induced diabetic rats treated with or without chronic cobalt chloride to activate HIFs. We elucidated the involvement of oxidative stress by studying the effects of acute administration of the superoxide dismutase mimetic tempol. Compared with controls, diabetic rats displayed tissue hypoxia throughout the kidney, glomerular hyperfiltration, increased oxygen consumption, increased total mitochondrial leak respiration, and decreased tubular sodium transport efficiency. Diabetic kidneys showed proteinuria and tubulointerstitial damage. Cobalt chloride activated HIFs, prevented the diabetes-induced alterations in oxygen metabolism, mitochondrial leak respiration, and kidney function, and reduced proteinuria and tubulointerstitial damage. The beneficial effects of tempol were less pronounced after activation of HIFs, indicating improved oxidative stress status. In conclusion, activation of HIFs prevents diabetes-induced alteration in kidney oxygen metabolism by normalizing glomerular filtration, which reduces tubular electrolyte load, preventing mitochondrial leak respiration and improving tubular transport efficiency. These improvements could be related to reduced oxidative stress and account for the reduced proteinuria and tubulointerstitial damage. Thus, pharmacologic activation of the HIF system may prevent development of diabetic nephropathy.
Keywords: diabetic nephropathy, hypoxia, proteinuria
Diabetic nephropathy is the most common cause of ESRD in developed countries. A possible mechanism for the onset and progression of diabetic nephropathy is an ischemic insult to the diabetic kidney, resulting in tubulointerstitial fibrosis and reduced renal function. Hypoxia has been suggested as a possible final common pathway in end stage kidney injury,1,2 and several studies have reported that sustained hyperglycemia will result in decreased intrarenal oxygenation.3,4 Importantly, we have recently reported that tissue hypoxia, attributed to increased oxygen consumption (QO2) secondary to increased mitochondria uncoupling, induced nephropathy independently of oxidative stress and hyperglycemia.5
In normal physiology, reduced oxygen tension (pO2) promotes alterations in gene expression to counteract hypoxia and promote cell survival and adaptation. An adequate gene response is elementary to maintain sufficient tissue pO2, and it is mainly accomplished by hypoxia-inducible transcription factors (HIFs).6,7 HIFs consist of two subunits: an α-subunit that is continuously produced but rapidly degraded by prolyl hydroxylases in the presence of oxygen and a constitutively expressed β-subunit. In hypoxia, the α-subunit will accumulate because of the lack of oxygen and form transcriptionally active heterodimers with the β-subunit. These heterodimers bind to hypoxia-responsive elements in the DNA to induce transcription of hypoxia-responsive genes involved in angiogenesis, anaerobic metabolism, iron metabolism, oxidative phosphorylation, and antioxidant defense.8,9 However, the HIF system has been shown to be inadequately activated in the hypoxic diabetic kidney.10–12 Furthermore, the numerous reports of normal or close to normal hematocrit in experimental diabetes indirectly imply absent HIF activation.3,4 Importantly, it has been reported that antioxidant treatment with the superoxide dismutase mimetic tempol reduced intrarenal hypoxia but paradoxically, increased HIF-1α staining, further highlighting the complexity of this issue.11
In this study, we tested the hypothesis that chronic HIF activation protects the diabetic kidney from altered oxygen metabolism, kidney function, and histologic damage. The potential involvement of oxidative stress was investigated by studying the effects of acute administration of tempol.
Results
Baseline Characteristics and Effects of HIF Activation
All diabetic animals were hyperglycemic, gained less weight compared with controls (Table 1), and displayed normal blood gas and electrolyte status (Supplemental Table 1). Both hyperglycemia and weight gain were reduced in diabetic animals treated with CoCl2. Diabetic kidneys were hypertrophic in the untreated group and displayed increased kidney-to-body weight ratio, whereas CoCl2 to diabetic kidneys resulted in decreased kidney weight but did not decrease kidney-to-body weight ratio (Table 1).
Table 1.
Body weight, blood glucose, hematocrit, kidney weight, and kidney weight-to-body weight ratio in control and diabetic rats with and without chronic CoCl2 treatment throughout the course of diabetes
| Group | N | Body wt (g) | BG (mmol/L) | Hct (%) | KW (g) | KW/Body wt (×1000) | ||
|---|---|---|---|---|---|---|---|---|
| Left | Right | Left | Right | |||||
| Control | 9 | 393±7 | 6.0±0.2 | 41±1 | 1.48±0.04 | 1.47±0.04 | 3.8±0.1 | 3.7±0.1 |
| Control+CoCl2 | 9 | 393±10a | 4.8±0.2a | 47±1a,b | 1.38±0.12a | 1.25±0.05a | 3.5±0.3a | 3.2±0.1a |
| Diabetes | 12 | 353±11b | 26.8±1.7b | 44±1b | 2.23±0.09b | 2.31±0.10b | 6.3±0.2b | 6.5±0.2b |
| Diabetes + CoCl2 | 10 | 270±8a,b | 20.4±0.8a,b | 59±1a,b | 1.70±0.04a,b | 1.70±0.04a,b | 6.3±0.1b | 6.3±0.2b |
| Two-way ANOVA | ||||||||
| Type | P<0.001 | P<0.001 | P<0.001 | P<0.001 | P<0.001 | P<0.001 | P<0.001 | |
| Treatment | P<0.001 | P=0.002 | P<0.001 | P<0.001 | P<0.001 | P=0.52 | P=0.05 | |
| Interaction | P<0.001 | P=0.03 | P<0.001 | P=0.01 | P=0.01 | P=0.60 | P=0.39 | |
All values are ±SEM. Type denotes control versus diabetes, and treatment denotes untreated versus CoCl2. Body wt, body weight; BG, blood glucose; Hct, hematocrit; KW, kidney weight.
P<0.05 compared with the untreated diabetes group.
P<0.05 compared with the untreated control group.
Urinary flow was increased in the both diabetic groups compared with control animals, whereas mean arterial pressure (MAP) was higher in the untreated control group compared with all groups (Table 2).
Table 2.
Urinary flow and MAP in control and diabetic rats with and without chronic CoCl2 treatment during baseline and after acute administration of tempol
| Group | N | Urinary Flow (µl/min per kidney) | MAP (mmHg) | ||
|---|---|---|---|---|---|
| Baseline | Tempol | Baseline | Tempol | ||
| Control | 9 | 2.6±0.5 | 3.0±0.5 | 116±3 | 105±2a |
| Control+CoCl2 | 9 | 2.2±0.3 | 1.9±0.6 | 106±3b | 92±2a,b |
| Diabetes | 12 | 30.2±7.6b | 21.6±4.2b | 105±2b | 97±1a |
| Diabetes+CoCl2 | 10 | 21.7±6.2b | 15.7±4.8a,b | 102±2b | 93±4a,b |
| Two-way ANOVA | |||||
| Type | P<0.001 | P<0.001 | P=0.01 | P=0.17 | |
| Treatment | P=0.44 | P=0.32 | P=0.03 | P<0.01 | |
| Interaction | P=0.48 | P=0.50 | P=0.15 | P=0.08 | |
All values are ±SEM. Type denotes control versus diabetes, and treatment denotes untreated versus CoCl2.
P<0.05 compared with baseline within the same group.
P<0.05 compared with the untreated control group.
Both cortical and medullary pO2 (Figure 1) were reduced in diabetic animals compared with controls, confirming the development of diabetes-induced intrarenal tissue hypoxia. Mitochondria from diabetic kidneys displayed increased leak respiration, the regulated fraction equally mediated by uncoupling protein-2 (UCP-2) and adenine nucleotide translocase (ANT) (Table 3). Measurements of mitochondrial membrane potential corroborated a functional role of the observed uncoupling through both UCP-2 and ANT (Table 4).
Figure 1.

Diabetes-induced regional tissue hypoxia corrected by HIF activation. (A) Cortical and (B) medullary oxygen tension in control and diabetic rats with and without chronic CoCl2 treatment during baseline and after acute administration of tempol (n=9–12/group). *P<0.05 compared with the corresponding period in the untreated control group. †P<0.05 compared with the corresponding period in the untreated diabetes group.
Table 3.
Mitochondrial respiration (picomoles O2 per second per milligram protein) during state 3 (active) and state 4 (rest), respiratory control ratio, and total leak respiration in the presence of ATP-synthase inhibitor oligomycin
| Group | N | State 3 | State 4 | Respiratory Control Ratio | Total Leak Respiration | Leak Respiration through UCP-2 | Leak Respiration through ANT | Total Regulated Leak Respiration |
|---|---|---|---|---|---|---|---|---|
| Control | 10 | 121±19 | 23±3 | 5.1±0.3 | 28±2 | 0.2±0.3 | 1.6±0.3 | 1.8±0.4 |
| Control+CoCl2 | 7–9 | 114±17a | 19±3a | 5.9±0.4a | 23±2a | 0.3±0.3a | 1.5±0.3a | 1.8±0.5a |
| Diabetes | 9 | 265±29b | 34±3b | 7.8±0.6b | 43±5b | 5.4±0.6b | 5.6±1.1b | 11.3±1.6b |
| Diabetes+COCl2 | 9 | 167±11a | 22±2a | 7.4±0.3b | 24±2a | 0.2±0.2a | 1.6±0.1a | 1.8±0.2a |
| Two-way ANOVA | ||||||||
| Type | P<0.001 | P=0.01 | P<0.001 | P=0.02 | P<0.001 | P=0.001 | P<0.001 | |
| Treatment | P=0.02 | P=0.01 | P=0.66 | P<0.001 | P<0.001 | P<0.001 | P<0.001 | |
| Interaction | P=0.04 | P=0.19 | P=0.18 | P=0.03 | P<0.001 | P=0.001 | P<0.001 |
Involvements of UCP and ANT were determined by the magnitude of inhibition by the specific inhibitors guanosine diphosphate and carboxyatractylate, respectively. All values are ±SEM. Type denotes control versus diabetes, and treatment denotes untreated versus CoCl2.
P<0.05 compared with the untreated diabetes group.
P<0.05 compared with the untreated control group.
Table 4.
Mitochondrial membrane potential (fluorescence unit uptake per milligram protein) during state 4 respiration (glutamate), leak respiration (oligomycin), and inhibition of uncoupling proteins (guanosine diphosphate) and the adenine nucleotide translocase (carboxyatractylate) or both
| Group | N | State 4 | Leak Respiration | UCP Inhibition | ANT Inhibition | Complete Leak Inhibition |
|---|---|---|---|---|---|---|
| Glutamate | + | + | + | + | + | |
| Oligomycin | + | + | + | + | ||
| Guanosine diphosphate | + | + | ||||
| Carboxyatractylate | + | + | ||||
| Control | 9 | 5610±268 | 5731±481 | 5366±329 | 5910±331 | 5549±524 |
| Control+CoCl2 | 8 | 5860±324 | 5596±264 | 5938±407 | 5625±250a | 5359±372a |
| Diabetes | 9 | 5848±417 | 5801±350 | 7325±337b | 7734±466b | 8737±374b |
| Diabetes+COCl2 | 9 | 5924±249 | 6029±391 | 5922±397 | 5901±343a | 5593±395a |
| Two-way ANOVA | ||||||
| Type | P=0.64 | P=0.52 | P=0.01 | P<0.01 | P<0.001 | |
| Treatment | P=0.62 | P=0.91 | P=0.27 | P<0.01 | P<0.001 | |
| Interaction | P=0.79 | P=0.64 | P=0.01 | P=0.04 | P=0.001 |
All values are ±SEM. Type denotes control versus diabetes, and treatment denotes untreated versus CoCl2. +, substrate present.
P<0.05 compared with the untreated diabetes group.
P<0.05 compared with the untreated control group.
Chronic HIF activation prevented intrarenal hypoxia in rats with diabetes, which was accomplished by conserving normal kidney QO2 (Figure 2A) through prevention of mitochondrial leak respiration (Table 3) and normalizing decreased tubular sodium transport (TNa)/QO2 (Figure 2B) and GFR (Figure 3A). HIF activation to controls did not alter any of these parameters.
Figure 2.

Derranged kidney oxygen consumption and electrolyte transport efficiency corrected by HIF activation in diabetes. (A) Kidney oxygen consumption and (B) TNa/QO2 in control and diabetic rats with and without chronic CoCl2 treatment during baseline and after acute administration of tempol (n=9–12/group). *P<0.05 compared with the untreated control group. †P<0.05 compared with the untreated diabetes group.
Figure 3.
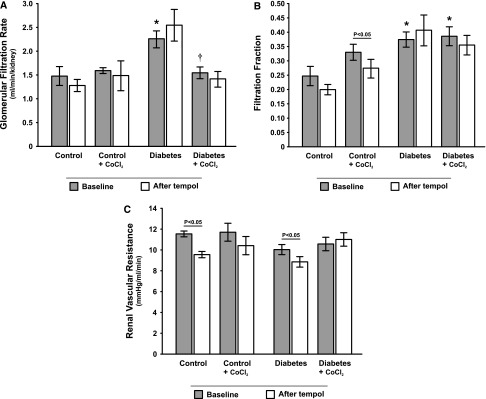
Normalization of GFR and renal vascular resistance in response to tempol by HIF activation in diabetes. (A) GFR, (B) filtration fraction, and (C) renal vascular resistance in control and diabetic rats with and without chronic CoCl2 treatment during baseline and after acute administration of tempol (n=9–12/group). *P<0.05 compared with the corresponding period in the untreated control group. †P<0.05 compared with the corresponding period in the untreated diabetes group.
Filtration fraction was higher in both diabetic groups compared with controls (Figure 3B), whereas renal vascular resistance (RVR) (Figure 3C) and total renal blood flow (RBF) (Figure 4A) were similar in all groups. Cortical RBF, but not medullary RBF, was lower in both diabetic groups compared with controls (Figure 4, B and C).
Figure 4.
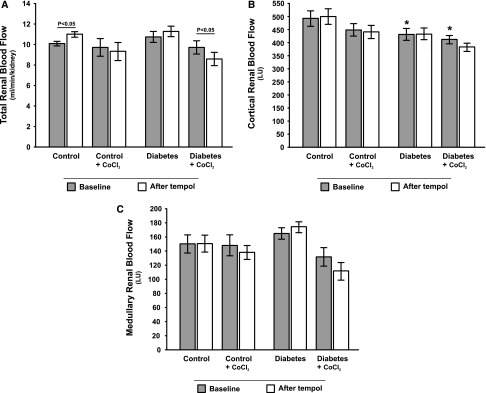
No major effects of diabetes or HIF activation on total and regional renal blood flow. (A) Total, (B) cortical, and (C) medullary blood flow in control and diabetic rats with and without chronic CoCl2 treatment during baseline and after acute administration of tempol (n=9–12/group). *P<0.05 compared with the corresponding period in the untreated control group.
Diabetic kidneys presented with increased urinary protein excretion (Figure 5) and tubulointerstitial injury, the latter evident as increased periodic acid–Schiff (PAS) and pathologic tubulointerstitial vimentin staining (Figure 6). Chronic HIF activation resulted in reduced urinary protein excretion (Figure 5), tubulointerstitial injury (Figure 6), and increased tubular expression of copper- and zinc-containing superoxide dismutase (Cu/Zn-SOD) (Figure 7).
Figure 5.

Correction of diabetes-induced proteinuria by HIF activation. Urinary protein excretion in control and diabetic rats with and without chronic CoCl2 treatment (n=9–12/group). *P<0.05 compared with the untreated control group. †P<0.05 compared with the untreated diabetes group.
Figure 6.

HIF activation prevents histological damage in diabetes. (A) PAS and vimentin staining revealing more tubulointerstitial injury in untreated diabetic rats compared with diabetic rats chronically treated with CoCl2. (B) Semiquantitative results of tubulointerstitial injury in control and diabetic rats with and without chronic CoCl2 treatment. Quantification of vimentin-positive tubules in control and diabetic rats with and without chronic CoCl2 treatment. No tubulointerstitial injury was observed in any of the control groups.
Figure 7.

HIF activation increases tubular staining of Cn/Zn-SOD. (A) Immunostaining and quantification of Cu/Zn-SOD expression in control and diabetic rats with and without chronic CoCl2 treatment (n=5/group). (B) High magnification revealing preferential tubular staining for Cu/Zn-SOD.
Successful HIF activation was confirmed by increased gene transcripts of erythropoietin (EPO), vascular endothelial grown factor (VEGF), and hemeoxygenase-1 (HO-1) (Figure 8), resulting in increased hematocrit (Table 1).
Figure 8.

Substantial upregulation of HIF-regulated genes by CoCl2. Gene expressions of the HIF-regulated genes EPO, VEGF, and HO-1 in control and diabetic rats with and without chronic CoCl2 treatment (n=4–5/group). The results are shown as fold increases compared with expression levels of diabetic rats without CoCl2 treatment.
Effects of Acute Tempol Administration
Tempol reduced urine flow in both diabetic groups to the same extent, although it only reached statistical significance in the CoCl2-treated group (Table 2). Tempol decreased MAP in all groups (Table 2). Importantly, tempol corrected the diabetes-induced intrarenal tissue hypoxia in untreated rats with diabetes, whereas it had no effect in any of the other groups (Figure 1). Tempol reduced RVR in both untreated groups (Figure 3C) but did not cause any other study-relevant systematic changes.
Discussion
In this study, we show that chronic pharmacologic HIF activation mitigates diabetes-induced alterations in renal oxygen metabolism and mitochondria function and that prevention of these alterations is accompanied by normalized renal function, reduced proteinuria, and improved tubulointerstitial injury. Normal QO2 in the diabetic kidney after HIF activation is maintained by preventing the commonly occurring diabetes-induced glomerular hyperfiltration and mitochondrial leak respiration as well as reducing TNa/QO2, that otherwise would increase the oxygen demand required for active tubular electrolyte transport. Mitochondrial uncoupling through UCP-2 is activated by oxidative stress,13,14 and we have previously reported markedly increased UCP-2 activity in the diabetic kidney, resulting in increased mitochondrial QO2.15,16 Preventing increased uncoupled QO2, therefore, seems feasible to minimize oxygen wasting in the diabetic kidney.
HIF is an important protective physiologic mechanism activated in conjunction with renal injury to counteract hypoxia and prevent damage.8,9 However, we could not detect any compensatory HIF activation, which is indicated by the lack of increased HIF target genes, in the hypoxic diabetic kidney. It has been reported that hyperglycemia-induced covalent modification of p300 decreases the HIF-1α/p300 association required for normal HIF signaling.10 Interestingly, Rosenberger et al.11 reported that antioxidant treatment increased medullary HIF expression in diabetic kidneys, although pO2 also improved. Thus, it seems possible that oxidative stress may affect HIF-1α/p300 association and therefore, normal HIF signaling.
Cobalt is commonly referred to as a hypoxia mimetic because of its ability to inhibit the degradation of the HIF α-subunit by prolyl hydroxylases, resulting in accumulation and subsequent HIF activation.17 In this study, diabetes-induced glomerular hyperfiltration was normalized by HIF activation. In addition, HIF activation prevented the intrarenal tissue hypoxia by preventing excessive kidney QO2 and reduced TNa/QO2.
It has been shown that hypoxia can induce activation of post-translational collagen-modifying enzymes, leading to an extracellular matrix composition resistant to degradation.18 Diabetic animals displayed pronounced tubulointerstitial injury as indicated by increased pathologic tubulointerstitial vimentin and PAS scores. Although it has previously been shown that hypoxia-induced HIF activation can induce fibrosis,19 that study used mouse molecular genetics to activate HIF, resulting in supraphysiologic activation of HIF for a long time. In that study, however, pharmacologic HIF activation by CoCl2 reduced fibrosis and tubular injury in the diabetic animals. The reason for this apparent discrepancy is largely beyond the scope of this study but may be because of differences in HIF downstream regulation by the extent and duration of HIF activation.20 Downstream effectors investigated in this study were EPO, VEGF, HO-1, and Cu/Zn-SOD, which all were induced by CoCl2. EPO is known to exert renoprotective, antiapoptotic effects, protecting peritubular capillaries and preventing glomerulosclerosis,21,22 and VEGF may ameliorate kidney injury.23 In addition, EPO induces HO-1 activation, offering an additional protection against oxidative stress.24 Overexpression of the potent antioxidant Cu/Zn-SOD attenuated renal injury in the db/db mouse model of type 2 diabetes.25
The finding that chronic HIF activation reduced proteinuria is in line with previous studies. Song et al.26 recently showed that HIF activation halted progression of proteinuria in a remnant kidney rat model. Similarly, Ohtomo et al.27 reported that HIF activation by cobalt reduced renal expressions of TGF-β, connective tissue growth factor, and NADPH oxidase as well as reduced proteinuria, tubulointerstitial damage, and peritubular capillary loss in experimental type 2 diabetes. Indeed, tubulointerstitial fibrosis is a reliable marker for progression of kidney disease, and it is, therefore, interesting that HIF activation ameliorated fibrosis development in the diabetic kidney. There are reports of a correlation between tubulointerstitial fibrosis and disease progression since the late 1960s.28,29 Because tubulointerstitial damage is currently considered the most reliable marker of disease progression,30 these results further strengthen the possibility that pharmacologic activation of the HIF system could offer protection against development of diabetic nephropathy.
The reduced plasma glucose levels in animals treated with CoCl2 are likely caused by increased glucose uptake as previously shown.31–33
Importantly, tempol corrected the diabetes-induced intrarenal tissue hypoxia in untreated rats with diabetes, possibly by O2− inactivation conserving kidney QO2. Unfortunately, no confirming QO2 measurements were possible after administration of tempol, because the tempol was found to interfere with the blood gas analysis. This limitation does not, however, weaken the main conclusion.
Acute tempol administration to diabetic rats improved both cortical and medullary pO2, normalized kidney QO2 and TNa/QO2, and decreased RVR, whereas it had no or minor effects on either of the control groups or on the CoCl2-treated rats with diabetes. These results imply that kidney function in the untreated diabetic rats is heavily influenced by increased oxidative stress and that chronic HIF activation prevents it. Acute administration of tempol decreased MAP, which is consistent with previous reports and likely caused by tempol-induced O2− inactivation increasing NO availability.34–36 The finding that tempol reduces RVR is also consistent with previous findings,34,35 which can be attributed to the direct BP-lowering effect as previously reported.37 However, we did not detect any effect of tempol on RVR in CoCl2-treated rats, despite similar MAP reduction, which may indicate altered vascular regulation after chronic HIF activation. However, tempol has previously been shown to reduce urine flow in diabetic animals.38
The reduced cortical RBF in diabetic kidneys, despite unaltered total RBF, may relate to a technical issue when using the laser Doppler technique on kidneys with different stages of hypertrophy. It is also unlikely that augmented oxygen delivery, secondary to increased hematocrit caused by the HIF activation, is a major contributor to the mitigated intrarenal hypoxia, because intrarenal pO2 in the diabetic kidney mainly is determined by QO2.39
In conclusion, this study shows that diabetes-induced alterations in renal oxygen metabolism are prevented by HIF activation by three different mechanisms. By normalizing GFR, which reduces tubular electrolyte load, preventing mitochondrial leak respiration, and maintaining effective TNa/QO2, total kidney QO2 and thus, tissue pO2 can be maintained within the normal range in the diabetic kidney. Early pharmacologic activation of the HIF system to reduce hypoxia-induced kidney damage may prevent the onset or progression of diabetic nephropathy.
Concise Methods
All chemicals were from Sigma-Aldrich (St. Louis, MO) and of the highest grade available if not otherwise stated.
Animals, Induction of Diabetes, and Chronic Treatment
Age-matched male Sprague–Dawley rats weighing about 200–250 g (about 8 weeks of age) were purchased from B&K (Sollentuna, Sweden). Animals had free access to water and standard rat chow (0.3% Na, 0.8% K, 21% protein; R3; Ewos, Södertälje, Sweden) throughout the study. All experiments were performed in accordance with the National Institutes of Health guidelines for use and care of laboratory animals and approved by the Animal Care and Use Committee for Uppsala University. Diabetes was induced by an injection of streptozotocin (STZ; 55 mg/kg body wt) in the tail vein. Animals were considered diabetic if blood glucose concentrations increased to above 18 mmol/L within 24 hours after STZ injection and remained elevated. Blood glucose concentrations were determined with test reagent strips (FreeStyle; Abbott Laboratories, Alameda, CA) from blood samples obtained from the cut tip of the tail in all animals.
The control and STZ-injected animals were randomly divided into receiving either vehicle or CoCl2 (20 mg·kg body wt−1 per 24 hours−1) in the drinking water for the entire duration of diabetes.27 A detailed schematic drawing of the experimental design is depicted in Figure 9.
Figure 9.
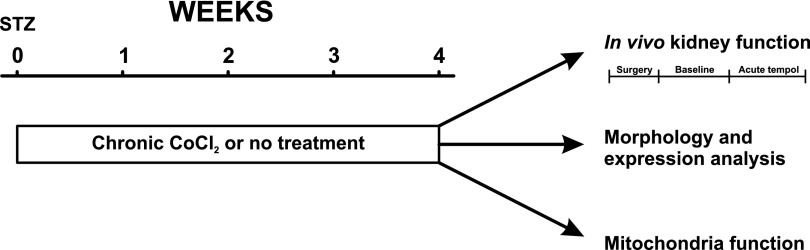
Experimental design. Diabetes was induced 4 weeks before acute experiments and animals randomly divided to receive either chronic CoCl2, or no treatment. Results were compared to corresponding age-match control groups.
Surgical Preparation for In Vivo Kidney Function
Four weeks after allocation to the study, the animals were anesthetized with an intraperitoneal injection of thiobutabarbital (Inactin; 120 mg/kg body wt for normoglycemic controls and 80 mg/kg for diabetic animals), placed on a thermo-controlled operating table at 37°C, and tracheotomized. Polyethylene catheters were placed in the right femoral vein for infusion of Ringer solution (5 ml·kg body wt−1 per hour−1 for normoglycemic controls and 10 ml·kg body wt−1 per hour−1 for diabetic animals), the right femoral artery for BP measurements (Statham P23dB; Statham Laboratories, Los Angeles, CA), and the left renal vein and carotid artery for blood samplings. The left ureter was catheterized to collect urine for subsequent analysis, and the urinary bladder was catheterized to allow urinary drainage. The left kidney was exposed by a left subcostal flank incision, immobilized in a plastic cup, and embedded in pieces of saline-soaked cotton wool, and the surface was covered with paraffin oil (Apoteksbolaget, Gothenburg, Sweden).
Simultaneous Measurements of GFR, RBF, Total Kidney QO2, and Tissue pO2
Animals were allowed a 30-minute recovery period after surgery followed by 40 minutes of baseline measurements of GFR, RBF, and QO2. Thereafter, tempol (174-µmol/kg bolus+174-µmol·kg−1 per min−1 continuous infusion)40 was acutely administered, and GFR and RBF were measured for an additional 40 minutes to determine the role of increased oxidative stress. Because tempol causes interference with the blood gas analysis, the effect of tempol on QO2 and thus, tubular transport efficiency (TNa/QO2) could not be studied.
GFR was estimated by clearance of 3H-inulin (185-kilobecquerel bolus+185 kilobecquerel·kg−1 body wt per h−1; American Radiolabeled Company, St. Louis, MO). The 3H activities in urine and plasma were measured using a standard liquid scintillation technique, and GFR was calculated according to GFR=U·V/P, where U and P denote the activity of 3H-inulin in the urine and plasma, respectively, and V denotes the urine flow in milliliters per minute.
Total RBF was measured using an ultrasound probe placed around the left renal artery (Transonic Systems, Ithaca, NY), and cortical and medullary RBFs were measured with laser Doppler flowmetry (PF 4001–2; Perimed, Stockholm, Sweden). Intrarenal pO2 was measured in kidney cortex and medulla by oxygen microsensors (Oxy-10; Unisense A/S, Aarhus, Denmark) at the end of each experimental period. All measured parameters were recorded with a Power Lab instrument (AD Instruments, Hastings, UK). Blood gas parameters were analyzed (iSTAT; Abbott Laboratories, Princeton, NJ) on samples drawn from the left renal vein and carotid artery only at the end of the baseline period. Tempol was found to interfere with the analysis in a separate set of pilot experiments, and no attempt was, therefore, made to measure QO2 after the acute tempol administration. Kidney weights were determined at the end of the experiments. Urine volumes were measured gravimetrically, urinary Na+ concentrations were measured by flame spectrophotometry (IL543; Instrumentation Lab, Milan, Italy), and urinary protein concentration was measured by DC Protein Assay (Bio-Rad, Hercules, CA).
Calculations of In Vivo Parameters
The filtration fraction was estimated as GFR/RBF·(1−hematocrit). RVR was calculated as MAP divided by total RBF. In vivo renal QO2 (micromoles per minute−1 per kidney−1) was estimated from the arteriovenous difference in O2 content (O2ct) using a standard equation (O2ct = [Hb·O2 saturation·1.34+pO2·0.003) multiplied by total RBF. TNa/QO2 was calculated using TNa equals plasma Na+ concentration multiplied by GFR.
Tissue Collection and Analysis of Histologic Alterations and Gene Expressions
A second set of control and diabetic animals with and without chronic CoCl2 administration (n=4–5/group) was used for tissue collection and subsequent analysis of histologic alterations and gene expressions. In brief, the animals were anesthetized with Inactin, and a catheter was placed in the carotid artery. Twenty milliliters ice-cold PBS was infused intra-arterially, and the renal vein was cut open to wash the kidneys before they were removed. The kidneys were dissected and either placed in methyl Carnoy’s fixative (methanol:chloroform:acetic acid at 6:3:1) or snap frozen using liquid nitrogen.
Estimation of Histologic Damage of the Kidney
Three-micrometer sections of the fixed paraffin-embedded kidney tissues were stained with the PAS reagent and counterstained with hematoxylin. Semiquantification of tubulointerstitial injury was performed in a blinded manner using 20 randomly selected fields of cortex per cross-section (×200). Tubulointerstitial injury was graded (0–4+) on the basis of the percentage of tubular cellularity, basement membrane thickening, accumulation of PAS-positive droplets, sloughing, or interstitial widening as follows: 0, no change; 1, <25% tubulointerstitial injury; 2, 25%–49% tubulointerstitial injury; 3, 50%–74% tubulointerstitial injury; and 4, 75%–100% tubulointerstitial injury.41
Quantification of Vimentin- and Cu/Zn-SOD–Positive Tubules
Indirect immunoperoxidase methods were used to identify vimentin with mouse mAb V9 (Dako, Carpinteria, CA) and Cu/Zn-SOD (representative target of HIF activation) with goat polyclonal Ab (Santa Cruz Biotechnology).41,42 The numbers of vimentin- or Cu/Zn-SOD–positive tubules were expressed as the mean±SD of the number per low-power field (×100). This value was calculated from counts obtained for 25 randomly selected cortical areas for each rat kidney in midcoronal sections in a blinded manner.
RNA Isolation and Analysis of Gene Expressions
Total RNA was extracted from kidney homogenates with Isogen (Nippon Gene, Tokyo, Japan). To synthesize cDNA from total RNA, SuperScript II Reverse Transcription was used (Life Technologies, Rockville, MD). Renal mRNA levels were assessed by real-time quantitative PCR using SYBR Green PCR Reagent (Qiagen, Hilden, Germany) and the iCycler PCR System (Bio-Rad) according to the manufacturer’s instructions. Briefly, amplification reactions consisted of 1 µl cDNA, 12.5 µl Universal 2× PCR MasterMix (Qiagen), and 5 µL each specific primers. Primer concentrations in the final volume of 25 µL were 500 nmol/L. In control experiments with triplicates, no false positives were detected, and the variance between each of the replicates was within 5%. All PCR reactions were performed in triplicate. Threshold cycle (Ct) was used for relative quantification of the input target number. The amount of Ct for control samples was considered one (i.e., 2°). The numbers of Cts for other samples were subtracted by cycles of control samples and recorded as Ct. The relative amount of amplified genes is given by 2−ΔCt. The mRNA levels of target genes were normalized to levels of β-actin. PCR primers for EPO, VEGF, and HO-1 have been described previously.43
Mitochondria Isolation and Functional Analysis
A third set of animals (n=8–10/group) was used to assess mitochondrial function. Mitochondria was isolated from kidney cortex, and mitochondrial oxygen consumption was recorded using high-resolution respirometry using an Oroboros O2K (Oroboros Instruments, Innsbruck, Austria) and corrected for protein concentration.15 Mitochondria function was determined as state 4 respiration in the presence of glutamate (10 mmol/L), state 3 respiration after the addition of 400 µmol/L ADP, and respiratory control ration calculated as state 3 over state 4 respiration. Mitochondrial uncoupling was determined as leak respiration (i.e., respiration in the presence of ATP-synthase inhibitor oligomycin [12 µg/mg protein]), and responsible mechanisms were evaluated as the sensitivity of leak respiration to guanosine diphosphate (GDP; 500 µmol/L; inhibitor of UCP) and carboxyatractylate (CAT; 0.5 µmol/L; inhibitor of ANT). The combination of GDP and CAT was used to estimate total regulated leak respiration.
Mitochondrial membrane potential was evaluated with tetramethyl rhodamine methylester in the presence of glutamate alone or combined with oligomycin, GDP, and CAT as previously described.44
Statistical Analyses
Two-way ANOVA was used to compare baseline data between the two groups (control and rats with diabetes) receiving two different treatments (with and without CoCl2 treatment), and when appropriate, it was followed by Bonferroni post hoc test. t Test for paired comparison was used when comparing data before and after acute administration in each group. Histologic score data were analyzed using nonparametric tests, whereas all other datasets were considered normally distributed and therefore, analyzed using parametric statistics. Statistical analysis was performed using GraphPad Prism for Windows (GraphPad Software Inc., San Diego, CA). For all comparisons, P<0.05 was considered statistically significant. All values are expressed as mean±SEM if not otherwise stated.
Disclosures
None.
Supplementary Material
Acknowledgments
This study was supported by the Swedish Medical Research Council, the Swedish Society for Medical Research, the Swedish Heart-Lung Foundation, the Swedish Diabetes Foundation, and Japanese Society for Promotion of Science Grant-in-Aid for Scientific Research 24390213 (to M.N.).
Footnotes
Published online ahead of print. Publication date available at www.jasn.org.
See related editorial, “A Breath of Fresh Air for Diabetic Nephropathy,” on pages 239–241.
This article contains supplemental material online at http://jasn.asnjournals.org/lookup/suppl/doi:10.1681/ASN.2013090990/-/DCSupplemental.
References
- 1.Nangaku M: Chronic hypoxia and tubulointerstitial injury: A final common pathway to end-stage renal failure. J Am Soc Nephrol 17: 17–25, 2006 [DOI] [PubMed] [Google Scholar]
- 2.Hansell P, Welch WJ, Blantz RC, Palm F: Determinants of kidney oxygen consumption and their relationship to tissue oxygen tension in diabetes and hypertension. Clin Exp Pharmacol Physiol 40: 123–137, 2013 [DOI] [PMC free article] [PubMed] [Google Scholar]
- 3.Palm F, Hansell P, Ronquist G, Waldenström A, Liss P, Carlsson PO: Polyol-pathway-dependent disturbances in renal medullary metabolism in experimental insulin-deficient diabetes mellitus in rats. Diabetologia 47: 1223–1231, 2004 [DOI] [PubMed] [Google Scholar]
- 4.Palm F, Cederberg J, Hansell P, Liss P, Carlsson PO: Reactive oxygen species cause diabetes-induced decrease in renal oxygen tension. Diabetologia 46: 1153–1160, 2003 [DOI] [PubMed] [Google Scholar]
- 5.Friederich-Persson M, Thörn E, Hansell P, Nangaku M, Levin M, Palm F: Kidney hypoxia, attributable to increased oxygen consumption, induces nephropathy independently of hyperglycemia and oxidative stress. Hypertension 62: 914–919, 2013 [DOI] [PMC free article] [PubMed] [Google Scholar]
- 6.Semenza GL, Wang GL: A nuclear factor induced by hypoxia via de novo protein synthesis binds to the human erythropoietin gene enhancer at a site required for transcriptional activation. Mol Cell Biol 12: 5447–5454, 1992 [DOI] [PMC free article] [PubMed] [Google Scholar]
- 7.Leonard MO, Cottell DC, Godson C, Brady HR, Taylor CT: The role of HIF-1 alpha in transcriptional regulation of the proximal tubular epithelial cell response to hypoxia. J Biol Chem 278: 40296–40304, 2003 [DOI] [PubMed] [Google Scholar]
- 8.Haase VH: Hypoxia-inducible factors in the kidney. Am J Physiol Renal Physiol 291: F271–F281, 2006 [DOI] [PMC free article] [PubMed] [Google Scholar]
- 9.Maxwell P: HIF-1: An oxygen response system with special relevance to the kidney. J Am Soc Nephrol 14: 2712–2722, 2003 [DOI] [PubMed] [Google Scholar]
- 10.Thangarajah H, Yao D, Chang EI, Shi Y, Jazayeri L, Vial IN, Galiano RD, Du XL, Grogan R, Galvez MG, Januszyk M, Brownlee M, Gurtner GC: The molecular basis for impaired hypoxia-induced VEGF expression in diabetic tissues. Proc Natl Acad Sci U S A 106: 13505–13510, 2009 [DOI] [PMC free article] [PubMed] [Google Scholar]
- 11.Rosenberger C, Khamaisi M, Abassi Z, Shilo V, Weksler-Zangen S, Goldfarb M, Shina A, Zibertrest F, Eckardt KU, Rosen S, Heyman SN: Adaptation to hypoxia in the diabetic rat kidney. Kidney Int 73: 34–42, 2008 [DOI] [PubMed] [Google Scholar]
- 12.Yang ZZ, Zhang AY, Yi FX, Li PL, Zou AP: Redox regulation of HIF-1alpha levels and HO-1 expression in renal medullary interstitial cells. Am J Physiol Renal Physiol 284: F1207–F1215, 2003 [DOI] [PubMed] [Google Scholar]
- 13.Echtay KS, Roussel D, St-Pierre J, Jekabsons MB, Cadenas S, Stuart JA, Harper JA, Roebuck SJ, Morrison A, Pickering S, Clapham JC, Brand MD: Superoxide activates mitochondrial uncoupling proteins. Nature 415: 96–99, 2002 [DOI] [PubMed] [Google Scholar]
- 14.Echtay KS, Murphy MP, Smith RA, Talbot DA, Brand MD: Superoxide activates mitochondrial uncoupling protein 2 from the matrix side. Studies using targeted antioxidants. J Biol Chem 277: 47129–47135, 2002 [DOI] [PubMed] [Google Scholar]
- 15.Persson MF, Franzén S, Catrina SB, Dallner G, Hansell P, Brismar K, Palm F: Coenzyme Q10 prevents GDP-sensitive mitochondrial uncoupling, glomerular hyperfiltration and proteinuria in kidneys from db/db mice as a model of type 2 diabetes. Diabetologia 55: 1535–1543, 2012 [DOI] [PubMed] [Google Scholar]
- 16.Friederich M, Fasching A, Hansell P, Nordquist L, Palm F: Diabetes-induced up-regulation of uncoupling protein-2 results in increased mitochondrial uncoupling in kidney proximal tubular cells. Biochim Biophys Acta 1777: 935–940, 2008 [DOI] [PubMed] [Google Scholar]
- 17.Semenza GL: Transcriptional regulation of gene expression: Mechanisms and pathophysiology. Hum Mutat 3: 180–199, 1994 [DOI] [PubMed] [Google Scholar]
- 18.Norman JT, Fine LG: Intrarenal oxygenation in chronic renal failure. Clin Exp Pharmacol Physiol 33: 989–996, 2006 [DOI] [PubMed] [Google Scholar]
- 19.Kimura K, Iwano M, Higgins DF, Yamaguchi Y, Nakatani K, Harada K, Kubo A, Akai Y, Rankin EB, Neilson EG, Haase VH, Saito Y: Stable expression of HIF-1alpha in tubular epithelial cells promotes interstitial fibrosis. Am J Physiol Renal Physiol 295: F1023–F1029, 2008 [DOI] [PMC free article] [PubMed] [Google Scholar]
- 20.Rudnicki M, Perco P, Enrich J, Eder S, Heininger D, Bernthaler A, Wiesinger M, Sarkozi R, Noppert SJ, Schramek H, Mayer B, Oberbauer R, Mayer G: Hypoxia response and VEGF-A expression in human proximal tubular epithelial cells in stable and progressive renal disease. Lab Invest 89: 337–346, 2009 [DOI] [PubMed] [Google Scholar]
- 21.Bahlmann FH, Song R, Boehm SM, Mengel M, von Wasielewski R, Lindschau C, Kirsch T, de Groot K, Laudeley R, Niemczyk E, Güler F, Menne J, Haller H, Fliser D: Low-dose therapy with the long-acting erythropoietin analogue darbepoetin alpha persistently activates endothelial Akt and attenuates progressive organ failure. Circulation 110: 1006–1012, 2004 [DOI] [PubMed] [Google Scholar]
- 22.Eto N, Wada T, Inagi R, Takano H, Shimizu A, Kato H, Kurihara H, Kawachi H, Shankland SJ, Fujita T, Nangaku M: Podocyte protection by darbepoetin: Preservation of the cytoskeleton and nephrin expression. Kidney Int 72: 455–463, 2007 [DOI] [PubMed] [Google Scholar]
- 23.Masuda Y, Shimizu A, Mori T, Ishiwata T, Kitamura H, Ohashi R, Ishizaki M, Asano G, Sugisaki Y, Yamanaka N: Vascular endothelial growth factor enhances glomerular capillary repair and accelerates resolution of experimentally induced glomerulonephritis. Am J Pathol 159: 599–608, 2001 [DOI] [PMC free article] [PubMed] [Google Scholar]
- 24.Katavetin P, Inagi R, Miyata T, Shao J, Sassa R, Adler S, Eto N, Kato H, Fujita T, Nangaku M: Erythropoietin induces heme oxygenase-1 expression and attenuates oxidative stress. Biochem Biophys Res Commun 359: 928–934, 2007 [DOI] [PubMed] [Google Scholar]
- 25.DeRubertis FR, Craven PA, Melhem MF, Salah EM: Attenuation of renal injury in db/db mice overexpressing superoxide dismutase: Evidence for reduced superoxide-nitric oxide interaction. Diabetes 53: 762–768, 2004 [DOI] [PubMed] [Google Scholar]
- 26.Song YR, You SJ, Lee YM, Chin HJ, Chae DW, Oh YK, Joo KW, Han JS, Na KY: Activation of hypoxia-inducible factor attenuates renal injury in rat remnant kidney. Nephrol Dial Transplant 25: 77–85, 2010 [DOI] [PubMed] [Google Scholar]
- 27.Ohtomo S, Nangaku M, Izuhara Y, Takizawa S, Strihou C, Miyata T: Cobalt ameliorates renal injury in an obese, hypertensive type 2 diabetes rat model. Nephrol Dial Transplant 23: 1166–1172, 2008 [DOI] [PubMed] [Google Scholar]
- 28.Rodríguez-Iturbe B, Johnson RJ, Herrera-Acosta J: Tubulointerstitial damage and progression of renal failure. Kidney Int Suppl 99: S82–S86, 2005 [DOI] [PubMed] [Google Scholar]
- 29.Risdon RA, Sloper JC, De Wardener HE: Relationship between renal function and histological changes found in renal-biopsy specimens from patients with persistent glomerular nephritis. Lancet 2: 363–366, 1968 [DOI] [PubMed] [Google Scholar]
- 30.Gilbert RE, Cooper ME: The tubulointerstitium in progressive diabetic kidney disease: More than an aftermath of glomerular injury? Kidney Int 56: 1627–1637, 1999 [DOI] [PubMed] [Google Scholar]
- 31.Mobasheri A, Platt N, Thorpe C, Shakibaei M: Regulation of 2-deoxy-D-glucose transport, lactate metabolism, and MMP-2 secretion by the hypoxia mimetic cobalt chloride in articular chondrocytes. Ann N Y Acad Sci 1091: 83–93, 2006 [DOI] [PubMed] [Google Scholar]
- 32.Telib M, Schmidt FH: Effect of cobaltous chloride in laboratory animals. II. Effect on blood sugar, plasma insulin and plasma lipids in rabbits. Endokrinologie 61: 395–402, 1973 [PubMed] [Google Scholar]
- 33.Vasudevan H, McNeill JH: Chronic cobalt treatment decreases hyperglycemia in streptozotocin-diabetic rats. Biometals 20: 129–134, 2007 [DOI] [PubMed] [Google Scholar]
- 34.Moreno JM, Rodríguez Gómez I, Wangensteen R, Alvarez-Guerra M, de Dios Luna J, García-Estañ J, Vargas F: Tempol improves renal hemodynamics and pressure natriuresis in hyperthyroid rats. Am J Physiol Regul Integr Comp Physiol 294: R867–R873, 2008 [DOI] [PubMed] [Google Scholar]
- 35.Schnackenberg CG, Welch WJ, Wilcox CS: Normalization of blood pressure and renal vascular resistance in SHR with a membrane-permeable superoxide dismutase mimetic: Role of nitric oxide. Hypertension 32: 59–64, 1998 [DOI] [PubMed] [Google Scholar]
- 36.Yanes L, Romero D, Iliescu R, Cucchiarelli VE, Fortepiani LA, Santacruz F, Bell W, Zhang H, Reckelhoff JF: Systemic arterial pressure response to two weeks of Tempol therapy in SHR: Involvement of NO, the RAS, and oxidative stress. Am J Physiol Regul Integr Comp Physiol 288: R903–R908, 2005 [DOI] [PubMed] [Google Scholar]
- 37.Guron GS, Grimberg ES, Basu S, Herlitz H: Acute effects of the superoxide dismutase mimetic tempol on split kidney function in two-kidney one-clip hypertensive rats. J Hypertens 24: 387–394, 2006 [DOI] [PubMed] [Google Scholar]
- 38.Luan J, Li W, Han J, Zhang W, Gong H, Ma R: Renal protection of in vivo administration of tempol in streptozotocin-induced diabetic rats. J Pharmacol Sci 119: 167–176, 2012 [DOI] [PMC free article] [PubMed] [Google Scholar]
- 39.Palm F, Nordquist L: Renal oxidative stress, oxygenation, and hypertension. Am J Physiol Regul Integr Comp Physiol 301: R1229–R1241, 2011 [DOI] [PMC free article] [PubMed] [Google Scholar]
- 40.Chen X, Patel K, Connors SG, Mendonca M, Welch WJ, Wilcox CS: Acute antihypertensive action of Tempol in the spontaneously hypertensive rat. Am J Physiol Heart Circ Physiol 293: H3246–H3253, 2007 [DOI] [PubMed] [Google Scholar]
- 41.Tanaka T, Matsumoto M, Inagi R, Miyata T, Kojima I, Ohse T, Fujita T, Nangaku M: Induction of protective genes by cobalt ameliorates tubulointerstitial injury in the progressive Thy1 nephritis. Kidney Int 68: 2714–2725, 2005 [DOI] [PubMed] [Google Scholar]
- 42.Son D, Kojima I, Inagi R, Matsumoto M, Fujita T, Nangaku M: Chronic hypoxia aggravates renal injury via suppression of Cu/Zn-SOD: A proteomic analysis. Am J Physiol Renal Physiol 294: F62–F72, 2008 [DOI] [PubMed] [Google Scholar]
- 43.Matsumoto M, Makino Y, Tanaka T, Tanaka H, Ishizaka N, Noiri E, Fujita T, Nangaku M: Induction of renoprotective gene expression by cobalt ameliorates ischemic injury of the kidney in rats. J Am Soc Nephrol 14: 1825–1832, 2003 [DOI] [PubMed] [Google Scholar]
- 44.Friederich-Persson M, Aslam S, Nordquist L, Welch WJ, Wilcox CS, Palm F: Acute knockdown of uncoupling protein-2 increases uncoupling via the adenine nucleotide transporter and decreases oxidative stress in diabetic kidneys. PLoS ONE 7: e39635, 2012 [DOI] [PMC free article] [PubMed] [Google Scholar]
Associated Data
This section collects any data citations, data availability statements, or supplementary materials included in this article.