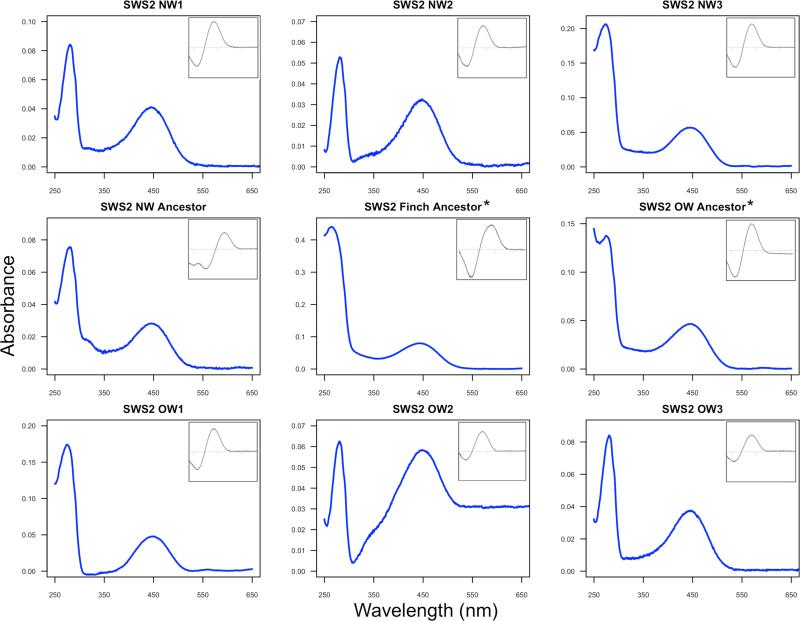
Figure 5.
Absorbance spectra of the regenerated warbler SWS2 pigments expressed in vitro. Main graphs show dark spectra and insets correspond to dark-light difference spectra. The x-axis for insets has the same range as main graph in all cases. Variant name correspondence: NW1 (Smag, Spet, λmax 447.3nm), NW2 (Saur, λmax 448nm), NW3 (Gtri, Gphi, Oruf, λmax 446.1nm), OW1 (Phum, Pmac, Pchl, λmax 445.5nm), OW2 (Pocc, Preg, Swhi, λmax 446.3nm) and OW3 (Ppul, λmax 445nm). See Table 1 for further details. *Ancestors recreated by site-directed mutagenesis. New World warbler ancestor λmax 446.8nm, Old World warbler ancestor λmax 446.1nm, and finch ancestor λmax 445.7nm. Note that the results are not normalized so the y-axes of different graphs have different scales due to absolute differences in expression.

