

Abstract
Speech deficits, notably those involved in psychomotor retardation, blunted affect, alogia and poverty of content of speech, are pronounced in a wide range of serious mental illnesses (e.g., schizophrenia, unipolar depression, bipolar disorders). The present project evaluated the degree to which these deficits manifest as a function of cognitive resource limitations. We examined natural speech from 52 patients meeting criteria for serious mental illnesses (i.e., severe functional deficits with a concomitant diagnosis of schizophrenia, unipolar and/or bipolar affective disorders) and 30 non-psychiatric controls using a range of objective, computer-based measures tapping speech production (“alogia”), variability (“blunted vocal affect”) and content (“poverty of content of speech”). Subjects produced natural speech during a baseline condition and while engaging in an experimentally-manipulated cognitively-effortful task. For correlational analysis, cognitive ability was measured using a standardized battery. Generally speaking, speech deficits did not differ as a function of SMI diagnosis. However, every speech production and content measure was significantly abnormal in SMI versus control groups. Speech variability measures generally did not differ between groups. For both patients and controls as a group, speech during the cognitively-effortful task was sparser and less rich in content. Relative to controls, patients were abnormal under cognitive load with respect only to average pause length. Correlations between the speech variables and cognitive ability were only significant for this same variable: average pause length. Results suggest that certain speech deficits, notably involving pause length, may manifest as a function of cognitive resource limitations. Implications for treatment, research and assessment are discussed.
Keywords: schizophrenia, speech, vocal, alogia, blunted affect, depression, bipolar, negative symptoms
1. Introduction
Serious mental illness (SMI) – defined in terms of serious functional impairments due to a diagnosable mental illness (e.g., schizophrenia, major depression, bipolar disorders), carries a profound burden of illness and disability. Mounting evidence suggests that there are often commonalities in individuals with SMI with respect to symptom presentation (e.g., Insel et al., 2010), functional impairments (e.g., Pini et al., 2001, Simonsen et al., 2011), neurobiology (e.g., Ng et al., 2008) and treatment response (e.g., Roth et al., 2004) related variables in ways that transcend traditional diagnostic boundaries (NIMH, 2013). In response, there have been repeated calls to understand the mechanisms underlying symptoms in mental illness beyond those involved with traditionally-defined diagnostic groups. In the present paper, we evaluate whether cognitive liabilities underlie speech deficits in individuals with SMI using highly sensitive objective measures and both experimental and correlational methods.
Deficits in speech communication, defined in terms of reduced production (e.g., alogia), variability (e.g., blunted affect) and content (e.g., poverty of content – speech that lacks meaning, irrespective of quantity of speech) are a staple of SMI (e.g., depression, schizophrenia, bipolar disorder; American Psychiatric Association [APA], 2013, Cohen et al., 2012, Tremeau et al., 2005). These deficits are often chronic in course, medication resistant and related to poor prognosis (Kirkpatrick et al., 2001). Despite these symptoms reflecting important Research Domain Criteria (RDoC) as “Production of Non-Facial Communication”, and hence, being potentially instrumental for understanding pathophysiological processes and improving diagnosis (Cohen et al., 2012; Insel et al., 2010; NIMH, 2013), our understanding of their nature is poor. An unfortunate obstacle in understanding and measuring speech deficits is a reliance on interviewer-based rating scales (Horan et al., 2011; Kirkpatrick et al., 2011). Data from these scales are relatively insensitive to change given the limited range of response options and ambiguous operational definitions, produce ordinal data that are inappropriate for parametric statistics, often cover wide temporal swaths, and are imprecise for isolating specific behaviors from other negative traits/symptoms (Alpert et al., 2002, Cohen et al., 2008, Cohen and Elvavag, 2014). Moreover, these scales have limited resolution for understanding how expressive deficits modulate within individuals, how they differ across individuals, and how they are uniquely related to cognitive, functional, pathophysiological, genetic and other variables. Thus, it is little surprise that our mechanistic understanding of speech deficits is poor. Emerging computerized technologies have allowed for assessment of speech deficits with near perfect inter-rater reliability and greater sensitivity and specificity than clinical rating scales (Alpert et al., 2002; Cohen et al., 2008, Cohen and Hong, 2011, Cohen et al., 2012).
There is reason to think that speech deficits may reflect a broader cognitive resource issue in patients with serious mental illness. A substantial amount of research from a range of disciplines suggests that humans have a limited amount of cognitive resources at any given time, and allocating resources towards one task (e.g., remembering a phone number or name, operating a motor vehicle) limits the resources available for speech (e.g., Plass, Moreno, and Branken, 2010). To date, at least six studies have found evidence that depletion of cognitive resources, conducted using experimental methods, results in reduction of speech quantity (Barch and Berenbaum, 1994, Barch and Berenbaum 1996, Cohen et al., 2012a, Cohen et al., 2014a, Tuček et al., 2012; Yin et al., 2007). Some of these studies have also documented changes in speech variability (Cohen et al., 2012a, Cohen et al., 2014a, Tuček et al., 2012; Yin et al., 2007) and speech content (Barch and Berenbaum, 1994; Barch and Berenbaum 1996) as well.
There is good reason to suspect that cognitive resource limitations may reflect a mechanism by which speech deficits manifest. First, patients with SMI show a broad range of cognitive deficits and these deficits are, in at least some studies, similar across diagnostic categories (Cohen et al., 2012; Simonsen et al., 2011). Second, poorer cognitive ability has been associated with negative symptoms in schizophrenia (e.g, Cohen et al., 2007), severity of melancholia in depression (e.g., Austin, et al., 1999), and with social functioning in bipolar disorder (Burdick et al., 2010) using interview-based rating scales. Third, correlational studies have demonstrated a link between cognitive deficits (e.g., processing speed) and abnormal speech production and speech variability in patients with SMI (e.g., Cohen et al., 2013; Gur et al., 2006). Finally, several experimental studies have demonstrated that increased cognitive load in patients with schizophrenia was associated with decreased speech production and poverty of content (Barch and Berenbaum, 1996, Melinder and Barch, 2003).
There are critical limitations in our understanding of the link between neurocognition and speech deficits in SMI. Of note, experimental studies examining patients (i.e., Barch and Berenbaum, 1996, Melinder and Barch, 2003) failed to include control groups, so it is unclear whether speech is actually abnormal in any regard relative to the population. Moreover, prior studies employing objective or computerized analysis of speech tended to focus solely on speech production at the expense of speech variability and speech content. Furthermore, prior studies have employed limited indices of speech production (e.g., word counts) and variability (e.g., mean volume, variability of F0). This is a critical point highlighted in a recent meta-analysis of objective measures of speech deficits in schizophrenia (Cohen et al., 2014b) – that there has been little consistency in which speech variables are reported across studies (e.g., eight different variables of speech production reported across 13 studies), and considerable disparity in magnitude of deficit across these variables (range of d’s = −.20 – −2.56). In the present study, we addressed these limitations and conducted the most sophisticated study to date clarifying the cognitive underpinnings of speech deficits in SMI. We employed both correlational and experimental approaches, and a broad set of sophisticated and diverse computer-based measures of natural speech indicated in a recent psychometric investigation from our group (Cohen et al., 2014c).
2. Methods
2.1. Participants
Participants were recruited from outpatient community mental health clinics and group homes based on meeting federal criteria for having an SMI defined in terms of adults (i.e., age 18 or older) who currently, or in the past year, meet criteria for a diagnosable mental, behavioral, or emotional disorder that results in functional impairment which substantially interferes with one or more major life activities (i.e., per the ADAMHA Reorganization Act). Participants included 52 patients with Diagnostic and Statistical Manual of Mental Disorders - Fourth Edition (DSM-IV; APA, 1994) diagnosed schizophrenia (n = 35) or unipolar major depressive or bipolar disorders (n = 17). Note that there was substantial blurring between these diagnostic categories in that a significant portion of individuals diagnosed with schizophrenia also had a history of depression and mania (19% and 22%, respectively), and that a significant portion of patients diagnosed with affective disorders had a history of psychosis (33%). Hence, the primary focus of this study involved collapsing patients into an SMI group – though traditional diagnosis was retained as a variable of interest for some analyses. Diagnoses were made based on information obtained from the patients’ medical records and from a structured clinical interview (SCID-IV; First et al., 1996). Exclusion criteria included: a) Global Assessment of Functioning (GAF; APA, 1994) rating below 30, b) documented evidence of mental retardation from the medical records, c) current or historical DSM-IV diagnosis of drug dependence with symptoms of severe physiological symptoms (e.g., delirium tremens, “blacking out”), and d) history of significant head trauma (requiring overnight hospitalization). All patients were clinically stable at the time of testing and were receiving pharmacotherapy. Controls (n = 30) were recruited from the community using the above exclusion criteria with the exception that they be free of current and past psychotic and affective disorders (per a SCID interview). Participants received $40 for their participation. This study was approved by the appropriate Human Subject Review Boards and all participants offered informed consent prior to participating in the study. Demographic and clinical information is included in Table 1.
Table 1.
Descriptive statistics for demographic and clinical variables for the control and serious mental illness (SMI) groups.
| Variable | Controls (n = 30) % | SMI (n = 52) % | Statistic X2 | ||
|---|---|---|---|---|---|
| Female | 55% | 37% | 2.63 | ||
| Ethnicity | |||||
| Caucasian | 55% | 56% | 3.76 | ||
| African-American | 38% | 44% | |||
| Psychiatric Diagnosis (by history) | |||||
| Major Depressive Episode | 0% | 43% | - | ||
| Manic Episode | 0% | 21% | - | ||
| Psychotic Episode | 0% | 79% | - | ||
| M | SD | M | SD | t | |
| Age (Years) | 40.38 | 12.65 | 42.35 | 11.99 | .69 |
| Education (Years) | 14.14 | 2.36 | 11.48 | 1.82 | 5.66* |
| GAF | 82.24 | 9.04 | 48.04 | 9.82 | 14.50* |
| Number of Hospitalizations | - | 7.02 | 10.31 | - | |
| Performance on Dual-Load Task | |||||
| High-load Accuracy % | .69 | .20 | .57 | .21 | 2.67* |
| High-load Reaction Time | 641.03 | 616.77 | 972.92 | 435.19 | 3.61* |
| Cognitive Performance | |||||
| Working Memory | 21.08 | 4.07 | 14.69 | 5.45 | 7.99* |
| Psychomotor | 69.88 | 14.81 | 47.06 | 19.05 | 5.23* |
| Executive | 15.73 | 5.58 | 11.40 | 5.69 | 2.25* |
| Verbal Memory | 45.38 | 10.79 | 28.29 | 11.09 | 6.12* |
| Attention | 58.35 | 15.49 | 31.73 | 15.60 | 3.15* |
| Psychiatric Symptoms | |||||
| Manic-Excitement | - | 9.61 | 4.36 | - | |
| Positive | - | 10.36 | 4.84 | - | |
| Depression/Anxiety | - | 8.21 | 4.27 | - | |
| Negative Symptoms | |||||
| Flat Affect | - | - | 1.26 | 1.51 | - |
| Alogia | - | - | 1.57 | 1.59 | - |
| Avolition | - | - | 1.59 | 1.33 | - |
| Anhedonia | - | - | 0.62 | 1.16 | - |
p < 0.05.
2.2. Diagnostic and Symptom Ratings
Psychiatric symptoms were measured using the Expanded Brief Psychiatric Rating Scale (BPRS; Lukoff et al., 1986). BPRS ratings were made using information obtained from medical records, the patients’ treatment teams and self-report and behavioral observations made during the research interview. Factor subscale scores reflecting positive, depression/anxiety and mania/excitement symptoms were computed (Ventura et al., 2000). Negative symptoms were measured using the Scale for the Assessment of Negative Symptom (SANS; Andreasen, 1984) global scores. Preliminary diagnoses and ratings were made by one of four doctoral-level students who were trained to criterion (Intra-class Correlation Coefficient values > .70).
2.3. Speech Tasks
Subjects were seated in front of a computer monitor and asked to perform two separate 90-second speaking tasks involving topics without demonstrative positive or negative emotional valence (i.e., hobbies, foods, daily routines) during which participants were encouraged to speak as much as possible (see Cohen et al., 2012a; Cohen et al., 2013a). During a “baseline” narrative task condition, participants provided speech while passively watching symbols appear on the monitor. Six different visual symbols were presented at 1,500, 2,000 and 2,500 millisecond inter-stimulus intervals. During a “high-load” narrative task, participants spoke while performing a one-back test. This task involved forced-choice responding (i.e., “match”, “non-match”) to stimuli when consecutively appearing visual symbols on a computer screen were identical. The visual stimuli and their presentation were identical across the two conditions. Four patients were excluded from the present study for not responding to the cognitive task (accuracy < 10%). Order of task and speech topic was randomized.
2.4. Speech Production and Speech Variability
The Computerized Assessment from Natural Speech protocol (CANS; Cohen et al., 2010; Cohen et al., 2009) was employed. The CANS system organizes sound files into “frames” for analysis, which for the present study was set at a rate of 100 frames per second. During each frame, frequency and volume are quantified, and information about pauses, utterances, intonation and emphasis are extracted. Our selection of these variables was based on a recent psychometric analysis of 1350 young adults using this procedure (Cohen et al., 2014b). We examined the following variables in this study: pause number – total count of all pauses (>150 ms) in the speech sample, pause length – average length of pauses (in milliseconds), utterance length – average length of utterances (in milliseconds), intonation – average standard deviation of fundamental frequency values computed separately for each utterance, intensity – average intensity values (i.e., volume) computed within each utterance, emphasis – average standard deviation of intensity values, computed separately for each utterance. Based on recent evidence that formant values are important for understanding schizophrenia (Covington et al., 2012), the standard deviation of the Formant 1 (indicating tongue height) and Formant 2 (indicating tongue position from front to back) values were also computed. All fundamental frequency values were log-transformed to control for their nonlinear distribution. Additionally, speech production was measured using word count (described below).
Speech content was measured in terms of filler words and semantic and vocabulary density. Word count (as a measure of speech production) and use of word filler/nonfluencies was measured using computerized lexical analysis of the transcribed speech samples via the Linguistic Inquiry and Word Count (LIWC) program (Pennebaker, 2001). We examined nonfluency (e.g., “er”, “um”, “hm”) and filler (e.g., “I mean”, “you know”, “blah”, multiple word repetitions [“I, I, I went the store]) categories, which were combined together. Semantic complexity (i.e., idea density) was measured using CPIDR 5.1 (Computerized Propositional Idea Density Rater, program version 5.1.4637.21009; Covington, 2012). CPIDR is a free, validated, computerized part-of-speech tagger that counts the number of propositions or assertions (verbs, adjectives, adverbs, prepositions, and subordinating conjunctions with some adjustment rules) and divides those by the total number of words in the text (Brown et al., 2008). A parameter known as “speech mode” was used to eliminate hesitation words (e.g., um, uh) and repetitions from the total word count, thereby reducing the impact of hesitant speech and avoiding a redundant measure of such words. Vocabulary (i.e., lexical) diversity was measured using a moving-average type-token ratio, i.e., the average of the vocabulary length in a moving text sequence of 20 consecutive words (Covington and McFall, 2010). Higher scores of the latter two variables indicate more semantically complex and vocabulary-rich text that expresses a greater variety of meaning per volume.
2.5. Cognition Ability
Basic cognitive ability was measured using the Brief Assessment of Cognition in Schizophrenia (BACS; Keefe, 1999), a battery assessing executive functions, psychomotor speed, attention, verbal memory and working memory. Due to potential circularity in examining speech production as a function of verbal fluency, the verbal fluency score was excluded.
2.6. Analyses
The analyses were conducted in four steps. First, we computed zero-order correlations between our 12 speech measures of interest to determine whether any of the variables were redundant with each other, defined as an r value > .85 (i.e., sharing 72% of variance). Second, we examined potential demographic and cognitive differences between the SMI and control groups that might inform subsequent analyses. We also compared patients with schizophrenia and those without on all dependent, clinical and descriptive measures. Additionally, the effects of speech topic (i.e., randomized across conditions), depression and demographic variables on the consequent results were considered. Third, we compared the SMI and control groups on speech characteristics for the baseline and high-load tasks using repeated-measures ANOVAs. We predicted significant group, condition, and interaction effects such that a) all subjects would show a declination in speech characteristics as a function of increasing cognitive load, b) patients overall would show less speech production, variability and content, and c) the speech of patients would show a more dramatic declination in speech characteristics under load compared to controls. Fourth, we computed correlations between speech characteristics (from the baseline condition) and general psychiatric symptom ratings, negative symptom ratings and cognitive performance variables. Although these correlations were largely exploratory, we expected that speech characteristics would be associated with cognitive ability (i.e., BACS) negative and depressive symptoms but not other psychiatric symptoms. All analyses in this study were two-tailed and all variables were normally distributed (skew < 1.5). Extreme scores (> 3.5 SD) were trimmed (i.e., replaced with values 3.5 SD).
3. Results
3.1. Zero-Order Correlations
Zero-order correlations (see Table 2) suggested that the variables were relatively independent of each other. The only variables approaching redundancy (i.e., r > .85) were between the word count and Pause Length variables for controls (r = −.83) and the Pause Number and Pause Mean variables for the patients (r = −.80).
Table 2.
Zero-order correlation matrix of speech variables for controls (italicized) and patients.
| 1. | 2. | 3. | 4. | 5. | 6. | 7. | 8. | 9. | 10. | 11. | 12. | |
|---|---|---|---|---|---|---|---|---|---|---|---|---|
| SPEECH PRODUCTION | ||||||||||||
| 1. Word Count | −0.83 | 0.57 | −0.04 | 0.14 | 0.09 | −0.27 | −0.55 | −0.04 | 0.44 | 0.20 | −0.47 | |
| 2. Pause Length | −0.46 | −0.71 | 0.01 | −0.06 | 0.11 | 0.22 | 0.49 | 0.19 | −0.66 | −0.21 | 0.65 | |
| 3. Pause Number | 0.50 | −0.80 | −0.51 | −0.12 | −0.41 | −0.59 | −0.58 | −0.25 | 0.32 | 0.09 | −0.33 | |
| 4. Utterance Length | −0.15 | −0.09 | −0.31 | 0.38 | 0.18 | 0.52 | 0.31 | 0.29 | 0.13 | −0.01 | −0.20 | |
| SPEECH VARIABILITY | ||||||||||||
| 5. Intonation | −0.27 | 0.17 | −0.22 | 0.11 | 0.26 | 0.26 | −0.03 | 0.32 | −0.09 | 0.14 | 0.04 | |
| 6. Formant 1 SD | −0.12 | 0.24 | −0.32 | 0.16 | −0.07 | 0.53 | 0.21 | 0.32 | −0.08 | −0.10 | 0.03 | |
| 7. Formant 2 SD | −0.13 | 0.11 | −0.17 | 0.11 | 0.09 | 0.14 | 0.47 | 0.25 | −0.01 | −0.22 | 0.11 | |
| 8. Intensity | −0.41 | 0.20 | −0.43 | 0.39 | 0.19 | 0.08 | 0.14 | 0.48 | −0.15 | −0.19 | 0.39 | |
| 9. Emphasis | −0.30 | −0.11 | −0.15 | 0.58 | 0.18 | 0.24 | 0.02 | 0.60 | −0.21 | −0.24 | 0.17 | |
| SPEECH CONTENT | ||||||||||||
| 10. Idea Density | 0.47 | −0.40 | 0.36 | −0.07 | −0.25 | −0.15 | −0.02 | −0.20 | −0.02 | 0.39 | −0.62 | |
| 11. Vocabulary Density | 0.28 | −0.11 | 0.10 | −0.08 | −0.19 | −0.05 | 0.08 | −0.34 | −0.20 | 0.50 | −0.14 | |
| 12. Filler | −0.34 | 0.26 | −0.23 | −0.10 | 0.30 | 0.07 | 0.00 | 0.11 | −0.03 | −0.56 | −0.43 | |
3.2 Demographic and Descriptive Variables
Education and GAF scores were significantly different between the patient and control groups (p’s < .05), but there were no other significant differences (see Table 1). Patients meeting criteria for schizophrenia versus those that did not were not statistically dissimilar in age, education level, current GAF, any of the cognitive ability scores, performance on the n-back portion of the high-load task or severity of any of manic/excitement, depression/anxiety or negative symptoms ratings. Patients with schizophrenia versus those without were more likely to be male (75% versus 45%; X2 5.41, p = .02) and had more severe positive symptoms (t[56] = 2.71, p = .01). The patient groups only significantly differed in four of 24 speech variables (i.e., 12 variables for baseline and high-load conditions). Schizophrenia patients showed lower intonation during both baseline and high-load conditions (t’s[50] = 2.89 and 3.03, p’s = .006 and .004 respectively), lower baseline intensity (t[50] = 2.29, p = .03) and greater baseline word counts (t[50] = 2.05, p = .045). Each of these results was nonsignificant when sex was controlled for. With one exception (i.e., baseline word count; F[2, 78] = 3.98, p = .02), speech variables did not differ as a function of speech topic. The results in sections 3.2 and 3.3 did not appreciably change when speech condition, demographic variables or severity of depressive symptoms were controlled for.
3.3. Group Comparisons on Speech Characteristics
Significant condition effects were observed for each of the four speech production and three content variables such that increased cognitive demands were associated with lower word counts, fewer pauses with longer lengths (i.e., lower N, longer Length), shorter utterance lengths, less semantically and lexically rich speech and increased word fillers (Table 3). With the exception of increasing intensity, none of the speech variability measures changed between conditions. Group effects were observed for some of the speech production (i.e., three of four), content (i.e., three of seven) and variability (i.e., two of five) measures. Overall, patients showed significantly fewer words, fewer pauses with longer lengths, greater F1 variability, louder speech, and less semantically and lexically rich speech. A significant interaction was observed for pause length. Post-hoc analyses of the interactions, using t-tests, revealed that pauses and utterances became disproportionately longer for patients versus controls as the cognitive demands of the task increased (see Figure 1).
Table 3.
Means and standard deviations of speech variables for baseline and high-load conditions for control (Con) and serious mental illness (SMI) groups with F values from mixed-design analyses of variance.
| Baseline Condition | High-Load Condition | Cond | Group | Interaction | |||
|---|---|---|---|---|---|---|---|
| Con | SMI | Con | SMI | ||||
| SPEECH PRODUCTION | |||||||
| Word Count | 228.10 (64.85) | 175.69 (67.64) | 173.31 (55.49) | 123.04 (62.05) | 72.98* | 14.99* | 0.03 |
| Pause Length | 938.17 (473.73) | 1287.59 (928.67) | 1210.34 (642.32) | 2014.19 (1360.02) | 20.67* | 8.11* | 4.28* |
| Pause Number | 57.14 (17.35) | 49.98 (17.67) | 51.47 (18.35) | 39.52 (17.25) | 26.37* | 6.44* | 2.32 |
| Utterance Length | 673.30 (212.32) | 730.85 (296.42) | 560.82 (219.70) | 655.88 (182.36) | 14.05* | 2.46 | 0.56 |
| SPEECH VARIABILITY | |||||||
| Intonation | 2.09 (0.85) | 1.87 (0.75) | 2.08 (0.77) | 1.90 (0.77) | 0.02 | 1.38 | 0.20 |
| Formant 1 SD | 5.69 (1.25) | 6.56 (2.10) | 5.58 (1.28) | 6.76 (2.22) | 0.07 | 6.35* | 0.86 |
| Formant 2 SD | 4.03 (0.86) | 3.79 (1.00) | 3.96 (0.94) | 3.69 (1.02) | 1.47 | 1.42 | 0.04 |
| Intensity | 12.87 (5.55) | 17.19 (5.89) | 14.46 (5.98) | 19.58 (6.66) | 23.69* | 12.10* | 0.97 |
| Emphasis | 3.38 (0.61) | 3.63 (1.05) | 3.22 (0.74) | 3.53 (0.86) | 3.50+ | 2.22 | 0.20 |
| SPEECH CONTENT | |||||||
| Idea Density | 0.50 (0.05) | 0.47 (0.06) | 0.46 (0.08) | 0.43 (0.09) | 18.08* | 4.36* | 0.12 |
| Vocabulary Density | 0.86 (0.04) | 0.83 (0.04) | 0.84 (0.05) | 0.80 (0.08) | 9.59* | 12.25* | 2.06 |
| Filler | 5.36 (3.24) | 5.17 (3.14) | 6.96 (4.43) | 7.52 (5.45) | 20.94* | 0.04 | 0.74 |
p < 0.05.,
p < .10
Figure 1.

Comparison of mean pause times for baseline and high-load conditions for control (Grey Bar) and serious mental illness (Black Bar) groups.
3.4. Speech Characteristics, Symptoms and Cognitive Ability
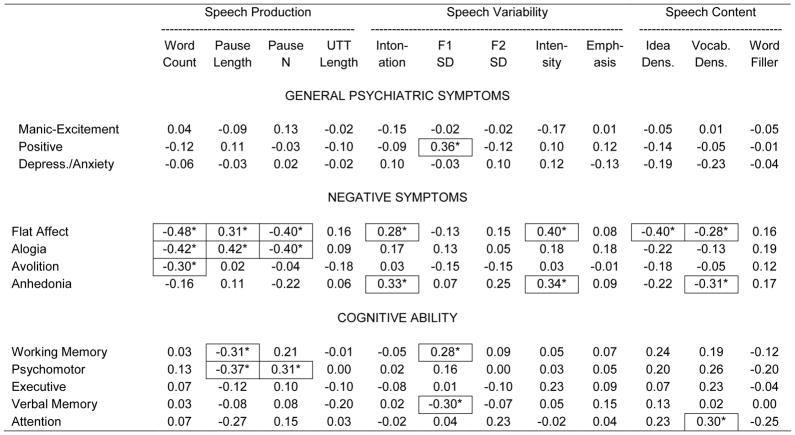
Generally speaking, there were few significant correlations between general psychiatric symptoms and speech characteristics (Table 4), though positive symptoms were associated with greater F1 variability. On the other hand, negative symptoms, notably flat affect and alogia, showed a range of speech correlates. More severe ratings of flat affect and alogia were both significantly associated with lower word counts, greater pause lengths and fewer pauses. Flat affect was also associated with greater intonation, louder speech and less semantically and lexically rich speech. Generally speaking, few of the correlations between speech and cognitive ability were statistically significant. As hypothesized, greater pause mean values were significantly associated with poorer working memory and psychomotor performance, and fewer pause numbers were associated with poorer psychomotor performance, but few other statistically correlations were observed.
Table 4.
Correlations between speech variables and positive/disorganization and negative symptom ratings and cognition scores.
|
p < .05 (significant r values outlined to aid interpretation)
Given the heterogeneity of symptoms included in the BPRS factor scores, correlations were separately computed between speech characteristics and individual BPRS symptom ratings. Generally, speaking, speech characteristics were not significantly related to BPRS items reflecting the prior month (e.g., depression, anxiety, hostility); only six of possible 168 correlations were statistically significant. In contrast, more significant correlations were observed in BPRS items based solely on interview behavior; 17 of 120. Nearly all of these correlations (16 of 19) were related to Blunted affect, emotional withdrawal and motor retardation. In general, these symptoms showed the same pattern of correlates as the SANS Flat affect and Alogia scores noted above, involving word count, pause length, pause N, intonation, intensity and idea and vocabulary density.
4. Discussion
There are five notable findings from this study. First, patients with SMI were deficient in nearly every aspect of speech production and content measured in this study. Second, consistent with prior studies (Barch and Berenbaum, 1994, Barch and Berenbaum 1996, Cohen et al., 2012a, Cohen et al., 2014a, Tuček et al., 2012; Yin et al., 2007) depletion of cognitive resources resulted in people (both with and without SMI) producing less speech, and speech that was less semantically and lexically rich. Third, consistent with prior research (e.g., Cohen et al., 2012), patients with schizophrenia and those with affective disorders did not differ much in speech characteristics. Fourth, depletion of cognitive resources adversely affected the speech of SMI patients more so than controls in only one domain – involving average pause length. This was not simply a matter of controls producing more words or fewer pauses, as the groups were not abnormal in reduction in these variables under cognitive load. Finally, correlational analyses provided evidence of a link between cognitive deficits and average pause lengths.
Lack of significant interaction effects aside, cognitive resources were experimentally linked to poor speech production and content for patients (as in Barch and Berenbaum, 1994, Barch and Berenbaum 1996), so clearly cognition plays an important role in these abilities. Thus, the present results suggest that relatively isolated facets of speech, namely involving production and content, are tied to cognitive resources in SMI patients in ways that other speech deficits (e.g., speech variability) may not be. From a clinical perspective, this suggests that alogia and blunted vocal affect, two cardinal negative symptoms in schizophrenia, may be mechanistically distinct. The relationship between cognition and speech production/content is not surprising in some ways, as many known cognitive domains are critical to these functions (e.g., language functions, verbal fluency, verbal memory). Moreover, it stands to reason that speech production and content, insofar as they are motivated and deliberate behaviors, require the sort of “on-line” attentional/working memory resources tapped in this study. What is not clear is if or why pause lengths are dependent on cognitive resources in ways other aspects of speech production aren’t. It could be that speech production is itself a mechanistically heterogeneous ability such that pause production has meaningfully different underpinnings than other aspects of speech production. Alternatively, it could be that pause length is simply a more sensitive measure for understanding cognitive resources than other aspects of speech production, which is why it showed significant group by condition interactions whereas other measures didn’t. Understanding how cognition is tied to speech production and content, and how they are mechanistically similar and different to other types of speech deficits (and other behavioral deficits) seems an important line for future research.
There are some important novel implications of a “cognitive-resource” theory of speech deficits in SMI. First, it seems reasonable to speculate that speech production deficits, at least in terms of abnormal pause lengths, may be ameliorated by improving cognitive resources in some manner. That is, by relieving cognitive resources limitations, for example, by employing cognitive compensation strategies (e.g., limiting activities requiring multi-tasking) or by bolstering capacity or efficiency more generally (e.g., cognitive remediation), it may be possible to relieve deficits in speech production and content. Relatedly, multi-tasking in potentially high risk situations (e.g., talking on the phone while driving) may be particularly dangerous for patients with SMI. Second, from an assessment perspective, the present data highlight the importance of context when assessing speech deficits. Speech is a dynamic phenomenon and varies considerably as a function of a range of variables. In this manner, it is important to consider cognitive demands when assessing speech. For example, the cognitive load, and consequent speech, involved in responding to relatively straightforward concrete questions (i.e., what did you have for lunch yesterday?) may be quite different than that associated with more abstract questions (i.e., what were you like as a child?). Ideally, deficits in speech production could be measured under controlled conditions where cognitive load can be directly controlled or manipulated – an important consideration as new measures of negative symptoms are being implemented (Horan, et al., 2011; Kirkpatrick et al., 2011).
Several additional findings warrant discussion. The present study failed to replicate a prior finding that abnormal formant variability was associated with negative symptoms in patients with schizophrenia (Covington et al., 2012). Differences in speaking task across this prior study (i.e., involving one minute of speech extracted from a clinical interview), and the present study may be responsible. The present study also failed to replicate relationships between cognitive ability and measures of speech variability see in Cohen et al., (2012). The present study used more sophisticated and precise measures of speech, and it is possible that the measures employed in the prior study were not independent of pause mean. Finally, in the present study, computer-based measures of speech were significantly correlated with clinical symptom ratings involving behavioral assessment but not to those involving month-long assessment epochs. These findings highlight that computer-based measures likely tap “state” symptoms as opposed to those reflecting longer time periods. This is an important consideration for adapting computer-based technology to clinical use.
The present study conceptualized cognition as a general construct reflecting “mental effort”, and it is presently unclear the degree to which specific cognitive abilities contribute to speech deficits. Clarifying this would be important for future research. Moreover, the present study did not employ a true “baseline” measure of speech, as even the baseline condition was cognitively taxing to some degree. This this may explain why patients were abnormal in many speech characteristics during this putatively “low” load task. Finally, the sample size in this study, while typical for a laboratory-based study of this kind, was modest. Limited power may explain some of the null findings. Despite these potential limitations, the present study found important links between cognition and speech deficits in SMI patients, and highlight the emerging utility of computerized analysis of speech for providing a mechanistic understanding of symptoms in this population.
Acknowledgments
Funding: Funding for this study was provided by a Louisiana Board of Regents and National Institute of Mental Health (R03 MH092622) grant to the primary author. The funding agencies had no further role in study design; in the collection, analysis and interpretation of data; in the writing of the report; and in the decision to submit the paper for publication.
The authors wish to acknowledge the subjects for their participation, lab members for their help processing and collecting data and MMO Behavioral Health Systems for their assistance in subject outreach.
Footnotes
Contributors. Alex S Cohen was the primary investigator for this project and designed the study and wrote the bulk of the manuscript. Jessica McGovern, Thomas Dinzeo and Michael Covington helped manage the literature searches, the analyses and provided conceptual material to the planning and presentation of this project. All authors contributed to and have approved the final manuscript.
Conflicts of Interest: There are no conflicts of interest to report.
Publisher's Disclaimer: This is a PDF file of an unedited manuscript that has been accepted for publication. As a service to our customers we are providing this early version of the manuscript. The manuscript will undergo copyediting, typesetting, and review of the resulting proof before it is published in its final citable form. Please note that during the production process errors may be discovered which could affect the content, and all legal disclaimers that apply to the journal pertain.
References
- Alpert M, Shaw RJ, Pouget ER, Lim KO. A comparison of clinical ratings with vocal acoustic measures of flat affect and alogia. J of Psychiatr Res. 2002;36:347–353. doi: 10.1016/s0022-3956(02)00016-x. [DOI] [PubMed] [Google Scholar]
- American Psychiatric Association. Diagnostic and statistical manual of mental disorders. 4. Washington, DC: Author; 1994. [Google Scholar]
- Andreasen NC. The Scale for the Assessment of Negative Symptoms SANS. The University of Iowa; Iowa City, IA: 1984. [Google Scholar]
- Austin MP, Mitchell P, Wilhelm K, Parker G, Hickie I, Brodaty H, Hadzi-Pavlovic D. Cognitive function in depression: a distinct pattern of frontal impairment in melancholia? Psych Med. 1999;29:73–85. doi: 10.1017/s0033291798007788. [DOI] [PubMed] [Google Scholar]
- Barch DM, Berenbaum H. Language production and thought disorder in schizophrenia. J of Abnorm Psychol. 1996;105:81–88. doi: 10.1037//0021-843x.105.1.81. [DOI] [PubMed] [Google Scholar]
- Barch D, Berenbaum H. The relationship between information processing and language production. J Abnorm Psychol. 1994;103(2):241–251. doi: 10.1037//0021-843x.103.2.241. [DOI] [PubMed] [Google Scholar]
- Brown CA, Snodgrass T, Kemper SJ, Herman R, Covington MA. Automatic measurement of .propositional idea density from part-of-speech tagging. Beh Res Meth. 2008;40:540–545. doi: 10.3758/brm.40.2.540. [DOI] [PMC free article] [PubMed] [Google Scholar]
- Burdick KE, Goldberg JF, Harrow M. Cognitive dysfunction and psychosocial outcome in patients with bipolar I disorder at 15-year follow-up. Acta Psychiatrica Scandinavica. 2010;122:499–506. doi: 10.1111/j.1600-0447.2010.01590.x. [DOI] [PMC free article] [PubMed] [Google Scholar]
- Cohen AS, Alpert M, Nienow TM, Dinzeo TJ, Docherty NM. Computerized measurement of negative symptoms in schizophrenia. J Psychatr Res. 2008;42:827–836. doi: 10.1016/j.jpsychires.2007.08.008. [DOI] [PMC free article] [PubMed] [Google Scholar]
- Cohen Alex S, Saperstein Alice M, Gold Jim, Kirkpatrick Brian, Carpenter William T, Jr, Buchanan Robert W. Neuropsychology of the Deficit Syndrome of Schizophrenia: New Data and Meta-analysis of Findings to Date. Schizophr Bull. 2007;33:1201–1212. doi: 10.1093/schbul/sbl066. [DOI] [PMC free article] [PubMed] [Google Scholar]
- Cohen AS, Hong SL. Understanding constricted affect in schizotypy through computerized prosodic analysis. J Pers Dis. 2011;25:478–491. doi: 10.1521/pedi.2011.25.4.478. [DOI] [PubMed] [Google Scholar]
- Cohen AS, Hong SL, Guevara A. Understanding emotional expression using prosodic analysis of natural speech: refining the methodology. J Beh Ther Exp Psychiatr. 2010;41:150–157. doi: 10.1016/j.jbtep.2009.11.008. [DOI] [PubMed] [Google Scholar]
- Cohen AS, Minor KS, Najolia GM, Lee Hong S. A laboratory-based procedure for measuring emotional expression from natural speech. Beh Res Meth. 2009;41:204–212. doi: 10.3758/BRM.41.1.204. [DOI] [PubMed] [Google Scholar]
- Cohen AS, Najolia GM, Kim Y, Dinzeo TJ. On the boundaries of blunt affect/alogia across serious mental illness: Implications for Research Domain Criteria. Schizophr Res. 2012;140:41–45. doi: 10.1016/j.schres.2012.07.001. [DOI] [PubMed] [Google Scholar]
- Cohen AS, Morrison SC, Brown LA, Minor KS. Towards a cognitive resource limitations model of diminished expression in schizotypy. J Abnorm Psychol. 2012a;121:109–118. doi: 10.1037/a0023599. [DOI] [PubMed] [Google Scholar]
- Cohen AS, Kim Y, Najolia GM. Psychiatric Symptom versus Cognitive Correlates of Diminished Expressivity in Schizophrenia and Mood Disorders. Schizophr Res. 2013;146:249–253. doi: 10.1016/j.schres.2013.02.002. [DOI] [PMC free article] [PubMed] [Google Scholar]
- Cohen AS, Dinzeo TJ, Donovan NJ, Morrison SC. Thinking makes you flat: the link between cognitive load and prosodic expression. 2013a. Manuscript submitted for publication. [Google Scholar]
- Cohen AS, Elvevaag B. Automated computerized analysis of speech in psychiatric disorders. Current Opinion in Psychiatry. 2014 doi: 10.1097/YCO.0000000000000056. [DOI] [PMC free article] [PubMed] [Google Scholar]
- Cohen AS, Auster TL, McGovern JE, MacAulay RK. The normalities and abnormalities associated with speech in psychometrically defined schizotypy. Schizophr Res. 2014a doi: 10.1016/j.schres.2014.09.044. [DOI] [PMC free article] [PubMed] [Google Scholar]
- Cohen Alex S, Mitchell Kyle, Elvavag Brita. What do we really know about blunted vocal affect and alogia? A meta-analysis of objective assessments. Schizophr Res. 2014b doi: 10.1016/j.schres.2014.09.013. [DOI] [PMC free article] [PubMed] [Google Scholar]
- Cohen AS, Renshaw T, Mitchell K, Chun Y. A psychometric investigation of natural speech measures for clinical and psychological science. 2014c. [DOI] [PMC free article] [PubMed] [Google Scholar]
- Covington MA. CASPR, Artificial Intelligence Center. Athens, GA: University of Georgia; 2012. CPIDR 5.1 User Manual. Retrieved from http://www.ai.uga.edu/caspr. [Google Scholar]
- Covington MA, McFall JD. Cutting the Gordian knot: The moving-average type-token ratio MATTR. J Quant Ling. 2010;17:94–100. [Google Scholar]
- Covington Michael A, Lunden SL Anya, Cristofaro Sarah, Johnson Stephanie, Ramsay Claire, Broussard Beth, Zhang Shayi, Bailey C Thomas, Fogarty Robert, Compton Michael T. Phonetic measurement of reduced facial movement among young adults with first-episode schizophrenia-spectrum disorders. Schizophr Res. 2012;142:93–95. doi: 10.1016/j.schres.2012.10.005. [DOI] [PMC free article] [PubMed] [Google Scholar]
- First MB, Spitzer RL, Gibbon M, Williams JB. User’s guide for the structured clinical interview for DSM-IV axis I disorders - Research version. New York, NY: Biometrics Research, New York State Psychiatric Institute; 1996. [Google Scholar]
- Gur RE, Kohler CG, Ragland JD, Siegel SJ, Lesko K, Bilker WB, Gur RC. Flat affect in schizophrenia: Relation to emotion processing and cognitive measures. Schizophr Bull. 2006;32:279–287. doi: 10.1093/schbul/sbj041. [DOI] [PMC free article] [PubMed] [Google Scholar]
- Horan WP, Kring AM, Gur RE, Reise SP, Blanchard JJ. Development and psychometric validation of the clinical assessment interview for negative symptoms CAINS. Schizophr Res. 2011;132:140–145. doi: 10.1016/j.schres.2011.06.030. [DOI] [PMC free article] [PubMed] [Google Scholar]
- Insel T, Cuthbert B, Garvey M, Heinssen R, Pine DS, Quinn K, Wang P. Research domain criteria RDoC: Toward a new classification framework for research on mental disorders. Am J Psychiatr. 2010;167:748–751. doi: 10.1176/appi.ajp.2010.09091379. [DOI] [PubMed] [Google Scholar]
- Keefe RSE. Brief assessment of cognition in schizophrenia BACS manual - A: Version 2.1. Durham, NC: Duke University Medical Center; 1999. [Google Scholar]
- Kirkpatrick B, Buchanan RW, Ross DE, Carpenter WT., Jr A separate disease within the syndrome of schizophrenia. Archives of General Psychiatry. 2001;58:165–171. doi: 10.1001/archpsyc.58.2.165. [DOI] [PubMed] [Google Scholar]
- Kirkpatrick B, Strauss GP, Nguyen L, Fischer BA, Daniel DG, Cienfuegos A, Marder SR. The brief negative symptom scale: Psychometric properties. Schizophr Bull. 2011;37:300–305. doi: 10.1093/schbul/sbq059. [DOI] [PMC free article] [PubMed] [Google Scholar]
- Lukoff D, Nuechterlein KH, Ventura J. Symptom monitoring in the rehabilitation of schizophrenic patients. Schizophr Bull. 1986;12:594–602. doi: 10.1093/schbul/12.4.578. [DOI] [PubMed] [Google Scholar]
- Melinder MR, Barch DM. The influence of a working memory load manipulation on language production in schizophrenia. Schizophr Bull. 2003;29:473–485. doi: 10.1093/oxfordjournals.schbul.a007020. [DOI] [PubMed] [Google Scholar]
- National Institute of Mental Health. Research Domain Criteria. 2013 Retrieved from http://www.nimh.nih.gov/research-priorities/rdoc/index.shtml.
- Ng F, Berk M, Dean O, Bush AI. Oxidative stress in psychiatric disorders: evidence base and therapeutic implications. Intern J Neuropsychopharmacology. 2008;11:851–876. doi: 10.1017/S1461145707008401. [DOI] [PubMed] [Google Scholar]
- Pennebaker JW. Linguistic Inquery and Word Count. Lawrence Erlbaum Associates; 2001. [Google Scholar]
- Plass JL, Moreno R, Branken R. Cognitive load theory. New York, NY: Cambridge University Press; 2010. [Google Scholar]
- Pini S, Cassano GB, Dell’Osso L, Amador XF. Insight into illness in schizophrenia, schizoaffective disorder, and mood disorders with psychotic features. Am J Psychiatr. 2001;158:122–125. doi: 10.1176/appi.ajp.158.1.122. [DOI] [PubMed] [Google Scholar]
- Roth BL, Sheffler DJ, Kroeze WK. Magic shotguns versus magic bullets: selectively non-selective drugs for mood disorders and schizophrenia. Nature Reviews Drug Discovery. 2004;3:353–359. doi: 10.1038/nrd1346. [DOI] [PubMed] [Google Scholar]
- Simonsen C, Sundet K, Vaskinn A, Birkenaes AB, Engh JA, Faerden A, Andreassen OA. Cognitive dysfunction in bipolar and schizophrenia spectrum disorders depends on history of psychosis rather than diagnostic group. Schizophr Bull. 2011;37:73–83. doi: 10.1093/schbul/sbp034. [DOI] [PMC free article] [PubMed] [Google Scholar]
- Tremeau F, Malaspina D, Duval F, Correa H, Hager-Budny M, Coin-Bariou L, Gorman JM. Facial expressiveness in patients with schizophrenia compared to depressed patients and nonpatient comparison subjects. Am J Psychiatr. 2005;162:92–101. doi: 10.1176/appi.ajp.162.1.92. [DOI] [PubMed] [Google Scholar]
- Tuček DC, Mount WM, Abbass HA. Neural and Speech Indicators of Cognitive Load for Sudoku Game Interfaces. Lecture Notes in Computer Science. 2012;7663:210–217. [Google Scholar]
- Ventura J, Nuechterlein KH, Subotnik KL, Gutkind D, Gilbert EA. Symptom dimensions in recent-onset schizophrenia and mania: A principal components analysis of the 24-item Brief Psychiatric Rating Scale. Psychiatr Res. 2000;97:129–135. doi: 10.1016/s0165-1781(00)00228-6. [DOI] [PubMed] [Google Scholar]
- Yin B, Ruiz N, Chen F, Kwawaja MA. Entertaining User Interfaces. 2007. Automatic cognitive load detection from speech features, Proceedings of the 19th Australasian conference on Computer-Human Interaction. [Google Scholar]