

Abstract
Background
Although a number of risk assessment models are available for estimating 10-year risk of cardiovascular (CV) events in patients requiring primary prevention of CV disease, the predictive accuracy of the contemporary risk models has not been adequately evaluated in Indians.
Methods
149 patients [mean age 59.4 ± 10.6 years; 123 (82.6%) males] without prior CV disease and presenting with acute myocardial infarction (MI) were included. The four clinically most relevant risk assessment models [Framingham Risk score (RiskFRS), World Health Organization risk prediction charts (RiskWHO), American College of Cardiology/American Heart Association pooled cohort equations (RiskACC/AHA) and the 3rd Joint British Societies' risk calculator (RiskJBS)] were applied to estimate what would have been their predicted 10-year risk of CV events if they had presented just prior to suffering the acute MI.
Results
RiskWHO provided the lowest risk estimates with 86.6% patients estimated to be having <20% 10-year risk. In comparison, RiskFRS and RiskACC/AHA returned higher risk estimates (61.7% and 69.8% with risk <20%, respectively; p values <0.001 for comparison with RiskWHO). However, the RiskJBS identified the highest proportion of the patients as being at high-risk (only 44.1% at <20% risk, p values 0 < 0.01 for comparison with all the other 3 risk scores).
Conclusions
This is the first study to show that in Indian patients presenting with acute MI, RiskJBS is likely to identify the largest proportion of the patients as at ‘high-risk’ as compared to RiskWHO, RiskFRS and RiskACC/AHA. However, large-scale prospective studies are needed to confirm these findings.
Keywords: Atherosclerotic cardiovascular disease, Primary prevention, Risk stratification
1. Introduction
Estimation of the risk of future cardiovascular (CV) events is an essential first step in the management of patients requiring primary prevention of CV disease (CVD). Such an estimate not only provides prognostically relevant information but more importantly, also provides the framework for selecting the nature and the intensity of the appropriate preventive therapies.
Traditionally, assessment of the CV risk is performed by determining the presence and severity of the major CV risk factors and subsequently using risk algorithms and prediction charts to determine the overall CV risk in any given individual. A number of risk assessment tools are available for this purpose such as Framingham risk score (RiskFRS),1,2 Prospective Cardiovascular Munster Score (PROCAM),3 Systemic Coronary Risk Evaluation (SCORE),4 QRISK,5–7 and the more recently developed World Health Organization/International Society of Hypertension CVD risk prediction charts (RiskWHO),8 American College of Cardiology/American Heart Association (ACC/AHA) pooled cohort equations (RiskACC/AHA)9 and the 3rd Joint British Societies' risk calculator (RiskJBS).10
A major prerequisite for the appropriate use of these risk prediction models is their contemporariness and their validity in the particular ethnic group. Unfortunately, none of the currently available risk prediction models is based on the data derived from resident Indians who have consistently been shown to have significantly higher risk of CVD than the western populations.11–17 Because of the lack of a specific risk scoring system available for Indians, the physicians in India are left with little choice but to adopt the same risk scores as applicable to the western populations. In this context, it becomes important to determine which one of the currently available risk assessment models comes closest to estimating the actual risk in Indian subjects. With the recent introduction of newer risk scores, namely RiskWHO, RiskACC/AHA and RiskJBS, this question becomes even more pertinent than ever. Therefore, in the present study we sought to determine the accuracy of 4 clinically most relevant risk assessment models (RiskFRS, RiskWHO, RiskACC/AHA and RiskJBS) in Indian patients presenting with first acute myocardial infarction (MI). Our goal was to determine how accurately these different risk scores would have identified these patients to be at ‘high-risk’ had they presented just prior to suffering the acute MI.
2. Methods
The study included 149 subjects without any prior history of CVD who had presented with acute MI. The diagnosis of MI was based on the third universal definition of MI.18 As per this definition, a diagnosis of MI required a rise and/or fall of cardiac biomarker values (preferably cardiac troponin) with at least one value above the 99th percentile upper reference limit, along with either the symptoms of ischemia and/or new or presumed new significant ST-T changes or new left bundle branch block. The MI was labeled as ST-segment elevation MI (STEMI) if the ECG revealed new ST elevation at the J point in two contiguous leads (≥0.1 mV in all leads other than leads V2–V3 and in case of leads V2–V3 ≥0.2 mV in men ≥40 years, ≥0.25 mV in men <40 years or ≥0.15 mV in women) or new onset left bundle branch block. If none of these ECG changes were present, then it was labeled as non-STEMI.
All patients were admitted to the cardiac intensive care unit and were managed according to the existing recommendations for the management of patients presenting with acute MI.19,20 Clinical evaluation was performed as part of their management and included detailed history and physical examination. History was obtained regarding prior cardiac illness, presence or absence of major CV risk factors, and the presenting symptoms. The physical examination included recording of vital parameters, cardiovascular examination and other systemic examination. The height and weight were also recorded, either at the time of presentation or within first 24 h in patients who could be ambulated.
In all patients, routine biochemical investigations were performed including complete blood count, renal function tests, cardiac enzymes, fasting and random blood glucose, hemoglobin A1C and fasting lipid profile. Fasting lipid profile was performed on the first morning after the initial presentation.
2.1. Estimation of CV risk
Based on the information collected, 10-year risk of having a major CV event (CV death, MI or stroke) was calculated for each patient using the four different risk scores- RiskFRS, RiskJBS, RiskACC/AHA, and RiskWHO. The RiskFRS and the RiskACC/AHA calculators are available for download from the websites https://www.framinghamheartstudy.org/risk-functions/cardiovascular-disease/10-year-risk.php# and http://my.americanheart.org/professional/StatementsGuidelines/Prevention-Guidelines_UCM_457698_SubHomePage.jsp respectively. The RiskJBS is available as an online calculator (or as a downloadable Smartphone app) from www.jbs3risk.com. The WHO risk prediction charts are included as part of the ‘Guideline for assessment and management of cardiovascular risk’ available at the WHO website (http://www.who.int/cardiovascular_diseases/publications/Prevention_of_Cardiovascular_Disease/en/). The chart applicable for South-East Asian region D (which includes Bangladesh, Bhutan, Democratic People's Republic of Korea, India, Maldives, Myanmar and Nepal) was used in the present study.
The parameters included in each of these risk scores and the applicable ranges are presented in Table 1. As the RiskACC/AHA accepts 130 mg/dl as the minimum value of total cholesterol (TC), the same was used for estimating CV risk in individuals who had TC <130 mg/dl (n = 37, 24.8%). Similarly, in 2 patients (1.3%) higher values of age (35 years) and in 32 patients (21.5%) higher values of systolic blood pressure (SBP, 110 mmHg) were used for estimating CV risk according to RiskWHO because the actual values were below the lower limits acceptable for the WHO risk prediction charts. No other adjustments were required in the input variables for estimation of CV risk by any of the studied risk scores.
Table 1.
Clinical and biochemical parameters (along with applicable ranges) included in various cardiovascular risk assessment models.
| Variable | FRS | JBS risk score | ACC/AHA risk score | WHO risk prediction charts |
|---|---|---|---|---|
| Age | Yes (30–74 years) | Yes (30–84 years) | Yes (20–79 years) | Yes (≈35–75 years) |
| Gender | Yes | Yes | Yes | Yes |
| Ethnicity | X | Yes | Yes | X |
| History of diabetes | Yes | Yes | Yes | Yes |
| Smoking history | Yes | Yes | Yes | Yes |
| Family history of premature CVD | X | Yes | X | X |
| History of atrial fibrillation | X | Yes | X | X |
| History of chronic kidney disease | X | Yes | X | X |
| History of rheumatoid arthritis | X | Yes | X | X |
| History of blood pressure treatment | Yes | Yes | Yes | X |
| Systolic blood pressure | Yes (90–200 mmHg) | Yes (70–210 mmHg) | Yes (90–200 mmHg) | Yes (≈110–190 mmHg) |
| Body-mass index | X | Yes (20–50 kg/m2) | X | X |
| Total cholesterol | Yes (100–405 mg/dl) | Yesa | Yes (130–320 mg/dl) | Yes (≈3.5–8.5 mmol/L) |
| HDL-cholesterol | Yes (10–100 mg/dl) | Yesa | Yes (20–100 mg/dl) | X |
ACC, American College of Cardiology; AHA, American Heart Association; CVD, cardiovascular disease; FRS, Framingham risk score; HDL, high-density lipoprotein; JBS, Joint British Society; WHO, World Health Organization.
The risk calculator accepts all usually found values of total and HDL-cholesterol but when total cholesterol exceeds 7.5 mmol/L, it highlights the possibility of familial hypercholesterolemia.
It is noteworthy that unlike all other risk scoring methods, RiskWHO uses approximates ranges of input variables and provides 10-year risk estimates as risk categories rather than absolute values. Therefore, to allow comparison, the estimated 10-year risks by all the different risk assessment models were divided in to the following risk categories- <10%, 10–19.9%, 20–29.9%, 30–39.9% and ≥40%. However, in case of RiskFRS, the two highest risk categories were combined as this risk score does not provide absolute risk value once the estimated 10-year risk exceeds 30%. In addition, for the purpose of analysis, the estimated 10-year risks were also categorized as <20% and ≥20%, the traditional cut-off values used to define high CV risk.
3. Statsitical analysis
The data were managed on Microsoft excel spreadsheet (version 2007, Microsoft Corp, Seattle, Washington) and analyzed using SPSS for Windows (release 15.0, SPSS Inc, Chicago, IL, USA). All values were expressed as mean (±standard deviation) or as percentages. Standard descriptive analysis was performed to analyze the baseline characteristics of the study population. The categorized risk estimates derived from the different risk scores were compared either using Wilcoxon's signed rank test (for multiple risk categories) or using McNemar test (when the risk scores were dichotomized as <20% or ≥20%). Pearsons' correlation coefficient (r) was estimated to assess the relationship between RiskJBS and RiskACC/AHA. A p value <0.05 was considered statistically significant.
4. Results
The baseline characteristics of the study population are presented in Table 2. The mean age of the study subjects was 59.4 ± 10.6 years and 123 (82.6%) were males. The conventional, major CV risk factors were common in the study subjects with nearly half having hypertension or diabetes (57.7% and 46.3% respectively), 27.5% being current smokers and 23.5% having family history of premature CVD.
Table 2.
Clinical and biochemical characteristics of the study population.
| Parameter | Valuesa (n = 149) |
|---|---|
| Age (years) | 59.4 ± 10.6 |
| Male gender, n (%) | 123 (82.6) |
| Hypertension, n (%) | 86 (57.7) |
| Diabetes mellitus, n (%) | 69 (46.3) |
| Current smokers, n (%) | 41 (27.5) |
| Family history of premature CVD, n (%) | 35 (23.5) |
| Body-mass index (kg/m2) | 24.9 ± 4.3 |
| Heart rate (beats/min) | 89 ± 17 |
| Systolic blood pressure (mmHg) | 117.2 ± 20.7 |
| Diastolic blood pressure (mmHg) | 69.7 ± 13.7 |
| Type of myocardial infarction | |
| STEMI | 123 (82.6) |
| Non-STEMI | 26 (17.4) |
| Location of myocardial infarction (STEMI only) | |
| Anterior wall myocardial infarction | 80 (65.0) |
| Others | 43 (35.0) |
| Thrombolysis | 37 (24.8) |
| Drugs | |
| Antiplatelet agents | 139 (93.3) |
| Anticoagulants | 88 (59.1) |
| Statins | 141 (94.6) |
| ACEI or ARB | 63 (42.3) |
| Beta-blockers | 72 (48.3) |
| Percutaneous or surgical coronary revascularization | 129 (86.6) |
| Fasting blood glucose (mg/dL) | 140.9 ± 44.7 |
| Total cholesterol (mg/dL) | 145.2 ± 44.0 |
| Serum triglycerides (mg/dL) | 139.3 ± 79.5 |
| HDL-cholesterol (mg/dL) | 35.1 ± 11.3 |
| LDL-cholesterol (mg/dL) | 88.6 ± 35.9 |
ACEI, angiotensin converting enzyme inhibitor; ARB, angiotensin receptor blocker; CVD, cardiovascular disease; HDL, high-density lipoprotein; LDL, low-density lipoprotein; STEMI, ST segment elevation myocardial infarction.
All values are mean ± standard deviation or actual number with percentages in parentheses.
4.1. Clinical and treatment details pertaining to MI (Table 2)
Of the 149 patients, 123 (82.6%) had presented with STEMI and the remaining had presented with non-STEMI. Among those with STEMI, nearly two-thirds (65.0%) had anterior wall MI and the remaining 35% had MI involving other regions. The median time interval from the onset of symptoms to the presentation at our center was 2.0 h (interquartile range 1.5–4.5 h). The heart rate at presentation was 89 ± 17 beats/min and the SBP and diastolic BP were 117.2 ± 20.7 mmHg and 69.7 ± 13.7 mmHg, respectively. The creatine phosphokinase MB fraction was 74.7 ± 104.9 u/L and troponin I was 28.3 ± 66.7 ng/mL. Of the 123 patients with STEMI, 37 (30.1%) received thrombolysis. Overall, 129 (86.6%) patients underwent revascularization (92 percutaneous, 35 surgical and 2 both) during the hospital stay. Antiplatelet agents were prescribed to 93.3% and statins to 94.6% patients. Two patients died during the hospital stay whereas the remaining 147 were discharged in a stable condition after a median hospital stay of 6 days (interquartile range 4–11 days).
4.2. Estimated 10-yr CV risk according to the different risk scores (Table 3, Figs. 1–3)
Table 3.
Estimated cardiovascular risk according to different risk assessment models in the study population.
| 10-year CV risk category | FRS (n = 149) | JBS risk score (n = 93) | ACC/AHA risk score (n = 149) | WHO risk prediction charts (n = 149) |
|---|---|---|---|---|
| <10% | 34 (22.8) | 18 (19.4) | 57 (38.3) | 92 (61.7) |
| 10–19.9% | 58 (38.9) | 23 (24.7) | 47 (31.5) | 37 (24.8) |
| 20–29.9% | 20 (13.4) | 19 (20.4) | 23 (15.4) | 10 (6.7) |
| 30–39.9% | 37 (24.8) | 16 (17.2) | 8 (5.4) | 7 (4.7) |
| ≥40% | 17 (18.3) | 14 (9.4) | 3 (2.0) |
p value <0.01 for all comparisons between any two combinations of risk models. However, when the risk categories were dichotomized (<20% and ≥20%), the difference between FRS and ACC/AHA risk score was no longer significant (p value 0.10).
ACC, American College of Cardiology; AHA, American Heart Association; CV, cardiovascular; FRS, Framingham risk score; JBS, Joint British Society; WHO, World Health Organization.
Fig. 1.
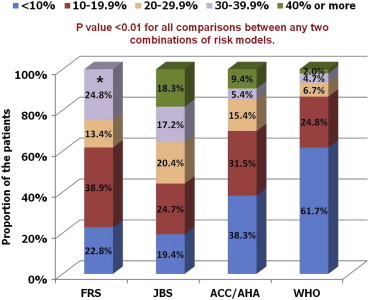
The estimated 10-year cardiovascular risk according to the four risk assessment models. *The two highest risk categories were combined for RiskFRS which does not provide absolute risk value once the estimated 10-year risk exceeds 30%. ACC, American College of Cardiology; AHA, American Heart Association; FRS, Framingham risk score; JBS, Joint British Society; WHO, World Health Organization.
Fig. 2.
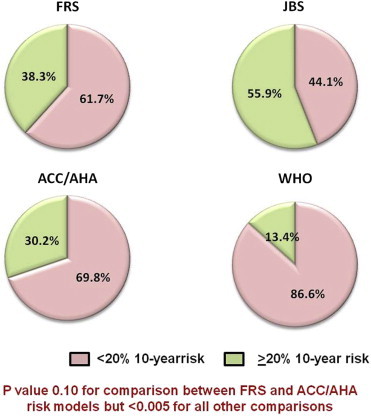
The estimated 10-year cardiovascular risk divided into two risk categories as <20% and ≥20%. ACC, American College of Cardiology; AHA, American Heart Association; FRS, Framingham risk score; JBS, Joint British Society; WHO, World Health Organization.
Fig. 3.
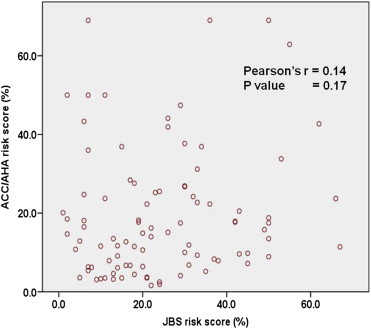
The correlation between the 10-year risk estimates derived using the JBS risk score and the ACC/AHA risk score. ACC, American College of Cardiology; AHA, American Heart Association; JBS, Joint British Society.
The 10-year risk of major CV events (CVD death, MI or stroke) was calculated in all patients using RiskFRS, RiskACC/AHA and RiskWHO. However, RiskJBS could be applied only in 93 (62.4%) patients as the body-mass index was not available in the remaining patients (the patients could not be weighed because of their clinical condition).
As shown in Table 3 and Figs. 1 and 2, RiskWHO provided the lowest risk estimates with 61.7% patients estimated to be having <10% risk and another 24.8% having 10–19.9% risk. In comparison, RiskFRS and RiskACC/AHA returned higher risk estimates (61.7% and 69.8% identified to be having <20% risk, respectively). However, RiskJBS identified the largest proportion of the patients as being at ‘high-risk’ (55.9% with ≥20% risk). All the p values were <0.01 for comparisons between any two combinations of risk models but when the risk categories were dichotomized (<20% and >20%), the difference between RiskFRS and RiskACC/AHA was no longer significant (p value 0.10). No significant correlation was found between RiskJBS and RiskACC/AHA (Pearson's r 0.14, p value 0.17), the two most recently developed risk scoring models.
5. Discussion
To the best of our knowledge, this is the first study to have compared the 4 clinically most relevant and contemporary CV risk assessment models in Indian subjects. We found that in patients presenting with first MI, RiskJBS was the most likely and RiskWHO the least likely to recognize them as being at ‘high-risk’ of having CV events. The other two risk assessment models (RiskFRS and RiskACC/AHA) had intermediate but comparable accuracy for this purpose.
5.1. The concept of CV risk assessment and the available risk assessment models
Estimation of the risk of future CV events is a fundamental concept in preventive cardiology. The ability to predict the likelihood of future development of CV disease in a given individual allows matching the intensity of the risk-reduction therapy with the anticipate risk and thereby facilitates judicious and effective implementation of the preventive strategy. The use of aspirin and/or statins for primary prevention of atherosclerotic CVD represents the best example of a risk-based therapeutic approach. In addition, the knowledge of the anticipated future risk of adverse events also helps improve patient compliance towards the preventive measures.
Traditionally, the assessment of the CV risk is performed by determining the presence and severity of the major CV risk factors and subsequently using risk algorithms and prediction charts to determine the overall CV risk in any given individual. A number of risk assessment tools are available for this purpose, of which FRS1,2 remains the most widely used one. The FRS is based on the data derived from the Framingham Heart Study which was initiated in 1948 in the town of Framingham in Massachusetts, USA. The initial FRS, which was developed in 1998, predicted only coronary heart disease risk but subsequently, a new general risk prediction tool was developed in 2008 to predict the overall CVD risk.1,2
While FRS has been validated in a number of populations and has been the cornerstone of CV risk assessment over the years, it has several limitations.21 First, it was developed at a time when the CVD incidence was at its peak in the US. As a result, FRS tends to overestimate CV risk in populations in which the CVD incidence is much lower, such as in the Europeans. Second, FRS does not take in to account many of the non-conventional risk factors such as obesity, physical inactivity, family history of premature CVD, etc which are being increasingly recognized as important contributors to the development of atherosclerotic CVD. Finally, FRS relies heavily on age as a determinant of the CV risk. Consequently, in a young individual, the estimated 10-year CV risk according to FRS is invariably low, despite the presence of multiple CV risk factors. This has important implications for Indians in whom CVD tends to occur at a younger age than the western populations. As a result, FRS is likely to underestimate CV risk in Indians, as has been demonstrated in previous studies.15,22,23
To overcome some of these challenges, numerous other risk assessment models have been developed for use in different ethnic groups. In 2007, the WHO, in collaboration with the International Society for Hypertension, published a series of risk prediction charts, each dedicated to a different ethnic-geographic region.8 These risk assessment charts were derived with the help of statistical models using extrapolated data about the prevalence of various CV risk factors in different geographical regions. Although these risk prediction charts have not been systematically validated in prospective studies, they seem to be the only option available for the populations for which prospective studies are not available.
More recently, two new risk scoring systems have become available. The ACC/AHA task force on practice guidelines in 2013 developed a new risk assessment approach (RiskACC/AHA) using pooled data from multiple cohorts, including the Framingham original and off-springs cohorts.9 The primary objective for developing RiskACC/AHA was to guide cholesterol management among adults and the task force recommends that this new risk score be used instead of RiskFRS for all decision-making regarding the use of statins in adults.24 However, the accuracy of RiskACC/AHA, even in American populations, has become a matter of considerable debate.25,26 In the mean almost at the same time, the 3rd iteration of the JBS also came out with its own risk assessment model (RiskJBS).10 This risk score is applicable to the populations in the UK but unlike most other risk scores, also provides risk estimates for non-resident Indians.
5.2. CV risk assessment in Indians
It is well established now that South Asians, including Indians, have increased risk of CVD as compared to other populations.11–17 Both the genetic make-up and early onset of conventional CV risk factors are believed to contribute to this excess risk.12,13,17 Consistent with this, numerous studies have shown that the risk assessment models developed for western populations systematically underestimate risk in individuals of South Asian origin.11,14,15
The assessment of CV risk among resident Indians is even more challenging. No prospective data is available for Indians to facilitate risk assessment in them and as a result the Indian physicians have to follow the same risk assessment models that are being used for western populations. Unfortunately, very little information is available to demonstrate how well these various risk scoring systems perform among resident Indians. In a previous study involving executives with metabolic syndrome, we found that RiskFRS could identify only 23.3% as having intermediate to high-risk.22 Similar findings were reported by Kanjilal et al also.23 They compared 3 different risk scoring systems – RiskFRS, SCORE and an older version of JBS risk score in the family members of the patients with CVD. It was found that despite significantly elevated levels of lipids, pro-inflammatory, pro-thrombotic, and serological markers, all 3 risk scores identified <5% population as being at ‘high-risk’.
Various alternate approaches have been proposed to facilitate CV risk assessment among Indians. Some investigators have suggested recalibrating the FRS by multiplying the calculated FRS by an appropriate correction factor.27 Alternately, RiskWHO offers a specific chart for resident Indians that could potentially be more accurate for our population. Yet another option is to use RiskJBS that includes data on ethnic Indians, albeit non-resident. In this context, the findings of our study assume significance. We found that in patients presenting with acute MI, RiskJBS provided the highest risk estimates among all the risk assessment models compared. The difference was even more marked given the fact that in some individuals we had to use higher than actual values of SBP and TC to meet the lower limits accepted by RiskACC/AHA and RiskWHO. There could be several explanations why RiskJBS was found to be more accurate in our study. First, RiskJBS is the only risk assessment model that has been validated in ethnic Indians, even though non-resident ones. Second, RiskJBS is a more comprehensive risk assessment model and takes in to account several additional risk factors such as obesity and family history of premature CVD. Inclusion of these risk factors is likely to enhance the accuracy of risk prediction. Third, as mentioned above, the accuracy of RiskACC/AHA is already a subject of controversy and is likely to be questionable in Indians also for whom it was actually never designed. However, it is difficult to explain why RiskWHO seemed to most underestimate the risk in our study.
5.3. Presentation with acute MI as the clinical setting in the present study
It must be noted that all the available CV risk assessment models have been designed only for predicting future risk of CV events and not for use in a cross-sectional manner as has been done in the present study (and some of the previous ones).22,23,28 However, in the absence of long-term prospective studies, this remains the only approach available to evaluate the predictive accuracy of different risk assessment algorithms. Compared to the previous similar studies, our study indeed had some strong points. We included only those patients who had presented with acute MI. Thus, there was no ambiguity that the patients included in our study were actually at a significantly high risk of having a major CV event. In contrast, in the study by Kanjilal et al, relatively lower risk asymptomatic subjects were included and as no follow up information was available, it was impossible to confirm the true CV risk in them.23 In addition, unlike the previous studies, we did not selectively include only the young subjects.22,23,28 It is well known that in young subjects, most risk assessment algorithms seem to underestimate the 10-year risk.
6. Limitations
There are several limitations of our study that warrant attention. First, some of our patients were already on statins, which must have lowered their cholesterol values. These values must have been lowered even further by the occurrence of the acute coronary event, though the impact of an acute coronary event on cholesterol levels is relatively less marked during the initial 24 h of symptoms onset. In the same manner, it is also likely that the SBP at the time of presentation may have been lower than the actual level. These alterations are expected to have resulted in underestimation of CV risk in our study. However, as both TC and SBP are included in all the four risk assessment models compared in the present study, it is unlikely that any changes in TC or SBP would differentially affect one risk score more than the other. Therefore, as the primary objective of the present study was to compare different risk assessment models and not to derive absolute risk estimates, we believe our study findings were not significantly affected by these factors.
Second, as already discussed above, the only appropriate method to assess the predictive accuracy of different risk assessment methods is to perform a long-term prospective study. However, the rationale behind our approach and the potential strength of our study over the previous similar ones have also been discussed above. In fact, as no prospective study seems to be currently underway to address this issue, our findings provide valuable information that is likely to have significant clinical implications.
Finally, our study had relatively small sample size. However, as we included only the patients presenting with acute MI, we were able to collect reasonable number of hard CV events to derive meaningful conclusions from it.
7. Conclusions
This is the first study to show that in Indian patients presenting with acute MI, RiskJBS is likely to identify the largest proportion of the patients as at ‘high-risk’. RiskWHO underestimates the risk the most whereas RiskFRS and RiskACC/AHA have intermediate accuracy. These findings suggest that RiskJBS may be more suited for use in Indians. However, large-scale prospective studies are needed to confirm these findings.
Conflicts of interest
All authors have none to declare.
Acknowledgment
We sincerely thank Mr Ravinder Negi, clinical research coordinator for his help in data collection and compilation.
References
- 1.Wilson P.W., D'Agostino R.B., Levy D., Belanger A.M., Silbershatz H., Kannel W.B. Prediction of coronary heart disease using risk factor categories. Circulation. 1998;97:1837–1847. doi: 10.1161/01.cir.97.18.1837. [DOI] [PubMed] [Google Scholar]
- 2.D'Agostino R.B., Sr., Vasan R.S., Pencina M.J. General cardiovascular risk profile for use in primary care: the framingham heart study. Circulation. 2008;117:743–753. doi: 10.1161/CIRCULATIONAHA.107.699579. [DOI] [PubMed] [Google Scholar]
- 3.Assmann G., Cullen P., Schulte H. Simple scoring scheme for calculating the risk of acute coronary events based on the 10-year follow-up of the prospective cardiovascular munster (procam) study. Circulation. 2002;105:310–315. doi: 10.1161/hc0302.102575. [DOI] [PubMed] [Google Scholar]
- 4.Conroy R.M., Pyorala K., Fitzgerald A.P. Estimation of ten-year risk of fatal cardiovascular disease in Europe: the score project. Eur Heart J. 2003;24:987–1003. doi: 10.1016/s0195-668x(03)00114-3. [DOI] [PubMed] [Google Scholar]
- 5.Hippisley-Cox J., Coupland C., Vinogradova Y. Predicting cardiovascular risk in England and Wales: prospective derivation and validation of qrisk2. BMJ. 2008;336:1475–1482. doi: 10.1136/bmj.39609.449676.25. [DOI] [PMC free article] [PubMed] [Google Scholar]
- 6.Hippisley-Cox J., Coupland C., Vinogradova Y., Robson J., May M., Brindle P. Derivation and validation of qrisk, a new cardiovascular disease risk score for the united kingdom: prospective open cohort study. BMJ. 2007;335:136. doi: 10.1136/bmj.39261.471806.55. [DOI] [PMC free article] [PubMed] [Google Scholar]
- 7.Hippisley-Cox J., Coupland C., Vinogradova Y., Robson J., Brindle P. Performance of the qrisk cardiovascular risk prediction algorithm in an independent uk sample of patients from general practice: a validation study. Heart. 2008;94:34–39. doi: 10.1136/hrt.2007.134890. [DOI] [PubMed] [Google Scholar]
- 8.World health organization . WHO; Geneva: 2007. Prevention of Cardiovascular Disease Guidelines for Assessment and Management of Cardiovascular Risk. [Google Scholar]
- 9.Goff D.C., Jr., Lloyd-Jones D.M., Bennett G. 2013 ACC/AHA guideline on the assessment of cardiovascular risk: a report of the American College of Cardiology/American Heart Association Task Force on Practice Guidelines. Circulation. 2014;129(25 Suppl 2):S49–S73. doi: 10.1161/01.cir.0000437741.48606.98. [DOI] [PubMed] [Google Scholar]
- 10.Joint British Societies' consensus recommendations for the prevention of cardiovascular disease (jbs3) Heart. 2014;100(suppl 2):ii1–ii67. doi: 10.1136/heartjnl-2014-305693. [DOI] [PubMed] [Google Scholar]
- 11.Anand S.S., Yusuf S., Vuksan V. Differences in risk factors, atherosclerosis, and cardiovascular disease between ethnic groups in Canada: the Study of Health Assessment and Risk in Ethnic Groups (share) Lancet. 2000;356:279–284. doi: 10.1016/s0140-6736(00)02502-2. [DOI] [PubMed] [Google Scholar]
- 12.McKeigue P.M., Miller G.J., Marmot M.G. Coronary heart disease in south Asians overseas: a review. J Clin Epidemiol. 1989;42:597–609. doi: 10.1016/0895-4356(89)90002-4. [DOI] [PubMed] [Google Scholar]
- 13.Joshi P., Islam S., Pais P. Risk factors for early myocardial infarction in south Asians compared with individuals in other countries. JAMA. 2007;297:286–294. doi: 10.1001/jama.297.3.286. [DOI] [PubMed] [Google Scholar]
- 14.Perumal L., Wells S., Ameratunga S. Markedly different clustering of cvd risk factors in New Zealand Indian and European people but similar risk scores (predict-14) Aust N Z J Public Health. 2012;36:141–144. doi: 10.1111/j.1753-6405.2011.00808.x. [DOI] [PubMed] [Google Scholar]
- 15.Bhopal R., Fischbacher C., Vartiainen E., Unwin N., White M., Alberti G. Predicted and observed cardiovascular disease in south Asians: application of finrisk, framingham and score models to Newcastle Heart Project data. J Public Health (Oxford, England) 2005;27:93–100. doi: 10.1093/pubmed/fdh202. [DOI] [PubMed] [Google Scholar]
- 16.Liem S.S., Oemrawsingh P.V., Cannegieter S.C. Cardiovascular risk in young apparently healthy descendents from Asian Indian migrants in the Netherlands: the shiva study. Neth Heart J. 2009;17:155–161. doi: 10.1007/BF03086238. [DOI] [PMC free article] [PubMed] [Google Scholar]
- 17.Enas E.A., Garg A., Davidson M.A., Nair V.M., Huet B.A., Yusuf S. Coronary heart disease and its risk factors in first-generation immigrant Asian Indians to the United States Of America. Indian Heart J. 1996;48:343–353. [PubMed] [Google Scholar]
- 18.Thygesen K., Alpert J.S., Jaffe A.S. Third universal definition of myocardial infarction. Eur Heart J. 2012;33:2551–2567. doi: 10.1093/eurheartj/ehs184. [DOI] [PubMed] [Google Scholar]
- 19.O'Gara P.T., Kushner F.G., Ascheim D.D. 2013 ACCF/AHA guideline for the management of st-elevation myocardial infarction: a report of the American College of Cardiology Foundation/American Heart Association Task Force on Practice Guidelines. J Am Coll Cardiol. 2013;61:e78–140. doi: 10.1016/j.jacc.2012.11.019. [DOI] [PubMed] [Google Scholar]
- 20.Jneid H., Anderson J.L., Wright R.S. 2012 ACCF/AHA focused update of the guideline for the management of patients with unstable angina/non-st-elevation myocardial infarction (updating the 2007 guideline and replacing the 2011 focused update): a report of the American College of Cardiology Foundation/American Heart Association Task Force on Practice Guidelines. J Am Coll Cardiol. 2012;60:645–681. doi: 10.1016/j.jacc.2012.06.004. [DOI] [PubMed] [Google Scholar]
- 21.Chia Y.C. Review of tools of cardiovascular disease risk stratification: interpretation, customisation and application in clinical practice. Singapore Med J. 2011;52:116–123. [PubMed] [Google Scholar]
- 22.Bansal M., Shrivastava S., Mehrotra R., Agarwal V., Kasliwal R.R. Low framingham risk score despite high prevalence of metabolic syndrome in asymptomatic North-Indian population. J Assoc Physicians India. 2009;57:17–22. [PubMed] [Google Scholar]
- 23.Kanjilal S., Rao V.S., Mukherjee M. Application of cardiovascular disease risk prediction models and the relevance of novel biomarkers to risk stratification in Asian Indians. Vasc Health Risk Manag. 2008;4:199–211. doi: 10.2147/vhrm.2008.04.01.199. [DOI] [PMC free article] [PubMed] [Google Scholar]
- 24.Stone N.J., Robinson J., Lichtenstein A.H. 2013 ACC/AHA guideline on the treatment of blood cholesterol to reduce atherosclerotic cardiovascular risk in adults: a report of the American College Of Cardiology/American Heart Association Task Force On Practice Guidelines. Circulation. 2014;129(25 Suppl 2):S1–S45. doi: 10.1161/01.cir.0000437738.63853.7a. [DOI] [PubMed] [Google Scholar]
- 25.Ridker P.M., Cook N.R. Statins: new American guidelines for prevention of cardiovascular disease. Lancet. 2013;382:1762–1765. doi: 10.1016/S0140-6736(13)62388-0. [DOI] [PubMed] [Google Scholar]
- 26.Amin N.P., Martin S.S., Blaha M.J., Nasir K., Blumenthal R.S., Michos E.D. Headed in the right direction but at risk for miscalculation: a critical appraisal of the 2013 ACC/AHA risk assessment guidelines. J Am Coll Cardiol. 2014;63(25PA):2789–2794. doi: 10.1016/j.jacc.2014.04.010. [DOI] [PMC free article] [PubMed] [Google Scholar]
- 27.Enas E.A., Singh V., Munjal Y.P. Recommendations of the second Indo-U.S. health summit on prevention and control of cardiovascular disease among Asian Indians. Indian Heart J. 2009;61:265–274. [PubMed] [Google Scholar]
- 28.Akosah K.O., Schaper A., Cogbill C., Schoenfeld P. Preventing myocardial infarction in the young adult in the first place: how do the national cholesterol education panel iii guidelines perform? J Am Coll Cardiol. 2003;41:1475–1479. doi: 10.1016/s0735-1097(03)00187-6. [DOI] [PubMed] [Google Scholar]