

Abstract
The reaction of 2,3-dichloro-1,4-naphthoquinone (DCNQ) with crizotinib (CZT; a novel drug used for treatment of non-small cell lung cancer) was investigated in different solvents of varying dielectric constants and polarity indexes. The reaction produced a red-colored product. Spectrophotometric investigations confirmed that the reaction proceeded through charge–transfer (CT) complex formation. The molar absorptivity of the complex was found to be linearly correlated with the dielectric constant and polarity index of the solvent; the correlation coefficients were 0.9567 and 0.9069, respectively. The stoichiometric ratio of DCNQ:CZT was found to be 2:1 and the association constant of the complex was found to be 1.07 × 10² l/mol. The kinetics of the reaction was studied; the order of the reaction, rate and rate constant were determined. Computational molecular modeling for the complex between DCNQ and CZT was conducted, the sites of interaction on CZT molecule were determined, and the mechanism of the reaction was postulated. The reaction was employed as a basis in the development of a novel 96-microwell assay for CZT in a linear range of 4–500 μg/ml. The assay limits of detection and quantitation were 2.06 and 6.23 μg/ml, respectively. The assay was validated as per the guidelines of the International Conference on Harmonization (ICH) and successfully applied to the analysis of CZT in its bulk and capsules with good accuracy and precision. The assay has high throughput and consumes a minimum volume of organic solvents thus it reduces the exposures of the analysts to the toxic effects of organic solvents, and significantly reduces the analysis cost.
Keywords: 2,3-Dichloro-1,4-naphthoquinone; Crizotinib; Charge–transfer reaction; Spectrophotometry; Microwell assay; High throughput analysis
1. Introduction
The charge–transfer (CT) reaction has considerable importance in different chemistry fields because of its presence in biological systems (Bolton et al., 1991; Kuznetsov and Ulstrup, 1999), widespread applications as organic electrical conductors (Eychimüller and Rogach, 2000; Singh et al., 2010), in studying drug-receptor interaction mechanisms (Pandeeswaran and Elango, 2009), storage of solar energy (Takahasi et al., 1993), and studying the thermodynamics and pharmacodynamics of drug molecules (Taboada et al., 2003; Pandeswaran and Elango, 2010). CT reactions usually produce intensely colored CT complexes with a new light absorption band that has longer λmax than that of the CT complex components (Atkins and Shriver, 1999; Foster, 1969; Rao, 1975). The rapid formation of these complexes leads to their widespread utility in the development of spectrophotometric methods for an analysis of many organic and/or pharmaceutical molecules (El-Bagary et al., 2011, 2012; Kalyanaramu et al., 2011; Darwish et al., 2005). For these reasons, extensive studies involving CT reactions have been conducted (Dutta et al., 2008; Rappaport, 1963; Pandeeswaran et al., 2009; Nudelman et al., 1999; Fakhroo et al., 2010; Roy et al., 1999). The naphthoquinone derivatives have π-orbitals of the naphthoquinone ring, which have electron affinity. The introduction of electron-withdrawing groups like chloro-, nitro-, cyano, etc., on the naphthoquinone ring increases this electron affinity (Chatterjee, 1971). These groups have strong electronegativity and large Hammett constants (Saito and Matsunaga, 1971). 2,3-Dichloro-1,4-naphthoquinone (DCNQ) acts as a strong π-electron acceptor in studying the CT reactions of electron donors (Saha et al., 2008; Datta and Mukherjee, 2004).
Crizotinib (CZT) is a novel small-molecule; inhibitor of tyrosine kinases. CZT was granted an accelerated approval by the FDA on August 26, 2011 (under the trade name of Xalkori® capsules made by Pfizer, Inc.) for the treatment of patients with advanced local or metastatic non-small cell lung cancer (NSCLC) carrying anaplastic lymphoma kinase (ALK) fusion gene (Kris, 2010; FDA, 2011). Extensive literature survey revealed that the electron-donating properties of CZT and its CT reactions have not been investigated yet. As well, there was no existing analytical method for pharmaceutical quality control (QC) of CZT. These facts were behind our interest in investigating the CT reaction of CZT with DCNQ and employment of the reaction in the development of a new photometric method for QC of CZT.
In this study, CT reaction between CZT and DCNQ was investigated and the reaction was employed in the development of a novel 96-microwell spectrophotometric assay for CZT. In this assay, the CT reaction was carried out in 96-microwell assay plates and absorbances of the CT complex solutions were measured by a microwell-plate absorbance reader.
2. Experimental
2.1. Apparatus
UV-1601 PC double-beam spectrophotometer (Shimadzu, Kyoto, Japan) was used for recording the absorption spectra. Microwell-plate absorbance reader (Spectramax M5, Molecular Devices, California, USA) empowered by Spectramax M5 software (provided with the instrument). RIA/EIA assay plates were a product of Corning/Costar Inc. (Cambridge, USA).
2.2. Chemicals and materials
Crizotinib (CZT) standard was obtained from Haoyuan Chemexpress Co., Ltd. (Shanghai, China) and used as received; the purity of the investigated compound was >99%. DCNQ (Sigma–Aldrich Corporation, St. Louis, MO, USA). Xalkori® Capsules (Pfizer Inc., New York, NY, USA) labeled to contain 250 mg CZT per Capsule. Solvents and pharmaceutical excipients were of analytical grade (Fisher Scientific, California, CA, USA).
2.3. Preparation of standard CZT solutions
Into a 5-ml calibrated flask, 10 mg (2.22 × 10⁻⁵ mol) of CZT was dissolved in 2 ml methanol, and the solution was completed to volume with the same solvent. This stock solution (4.44 × 10⁻³ M) was diluted with the appropriate solvent to obtain CZT concentrations suitable for each corresponding study.
2.4. Determination of association constant
A series of CZT solutions (0.23 × 10⁻⁴ to 1.14 × 10⁻⁴ M) were mixed with DCNQ solution of a fixed concentration (2.28 × 10⁻³ M); both CZT and DCNQ solutions were prepared in ethanol. These mixed solutions were allowed to reach equilibrium (∼90 min) at room temperature (25 ± 2 °C). The absorbance of the solutions was measured at 490 nm against reagent blanks treated similarly.
2.5. Determination of CZT:DCNQ molar ratio
Master solutions of CZT (0.25 × 10⁻² M) and DCNQ (2 × 10⁻² M) were prepared; DCNQ molar concentration was 8-fold that of CZT. A series of the master solutions of CZT with DCNQ were made up comprising CZT solution of a fixed concentration (0.25 × 10⁻² M) and varying DCNQ concentrations (0.25 × 10⁻² to 2 × 10⁻² M); CZT:DCNQ molar ratio was 1:8. The reaction was carried out at room temperature (25 ± 2 °C) for 45 min. The absorbances of the reaction solutions were measured at 490 nm against blanks treated similarly except ethanol was used instead of CZT sample. The measured absorbances were plotted as a function of CZT:DCNQ molar ratio. The generated plot was used for determination of the molar ratio of the reaction between CZT and DCNQ.
2.6. Computational modeling for the CT complex of CZT with DCNQ
The molecular modeling for the CT complex was performed by using CS Chem3D Ultra, version 9 (Cambridge Soft Corporation, Cambridge, MA, USA) implemented with molecular orbital computations software (MOPAC), and molecular dynamics computations software (MM2).
2.7. Preparation of CZT capsule sample solution
The contents of 10 capsules were weighed and a quantity of the capsule content equivalent to 20 mg of CZT was transferred into a 10-ml calibrated flask, dissolved in 4 mL ethanol, swirled and sonicated for 5 min, completed to volume with the ethanol, shaken well for 15 min, and filtered. The first portion of the filtrate was rejected, and a measured volume of the filtrate was diluted with ethanol to yield CZT concentrations in the range of 8–1000 μg/ml.
2.8. Microwell assay procedure
Accurately measured aliquots (100 μl) of the standard or sample solution containing varying amounts of CZT (8–1000 μg/ml) were transferred into wells of 96-microwell assay plates. One hundred microliters of DCNQ solution (0.5%, w/v) was added, and the reaction was allowed to proceed at room temperature (25 ± 2 °C) for 45 min. The absorbances of the resulting solutions were measured at 490 nm by the microwell-plate reader. Blank wells were treated similarly except 100 μl of ethanol was used instead of the sample, and the absorbances of the blank wells were subtracted from those of the other wells.
3. Results and discussion
3.1. Absorption spectral characteristics
The absorption spectrum of CZT solution (1.14 × 10⁻⁴ M, in methanol) was recorded (Fig. 1A). It is obvious from the spectrum that CZT has two maximum absorption peaks (λmax) at 270 and 320 nm. The CZT solution was mixed with DCNQ solution (2.28 × 10⁻³ M, in methanol), and the interaction of CZT with DCNQ was carried out at room temperature (25 ± 2 °C), and the absorption spectrum of the reaction mixture was recorded against DCNQ reagent blank solution (Fig. 1B). A red-colored product was obtained showing absorption maximum at 488 nm. The absorption intensity of this new absorption maximum increased with time (Fig. 1B) and increase in CZT concentrations in the interaction solution (Fig. 1C). This gradual continuous increase in the new absorption band with the reaction time and CZT concentrations was indicative of the formation of CZT-DCNQ product. The new absorption band was due to the electron transfer from CZT (D) to DCNQ (electron acceptor; A) accompanied by the formation of colored radical acceptor anion (DCNQ—) (Taha and Rücker, 1977), which was formed by the dissociation of an original donor–acceptor (D–A) complex:
Figure 1.
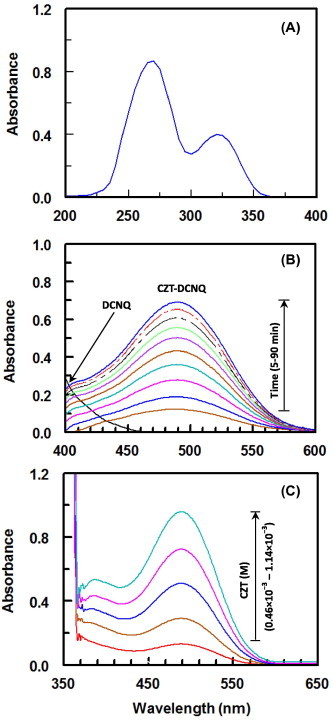
Panel (A): absorption spectra of CZT (1.14 × 10⁻⁴ M) against methanol. Panel (B): absorption spectra of DCNQ (2.28 × 10⁻³ M), and its reaction mixtures with CZT (4.4 × 10⁻⁴ M) measured at varying time intervals (5–90 min) against the reagent blank. Panel (C): absorption spectra of reaction mixtures containing a fixed concentration of DCNQ (2.28 × 10⁻³ M) and varying CZT concentrations (1.78 × 10⁻⁴ to 8.88 × 10⁻⁴ M) against reagent blank. All DCNQ and CZT were prepared in methanol.
This dissociation was promoted by the high ionizing power of the polar solvent (Taha and Rücker, 1977).
3.2. Effect of solvent on the interaction of DCNQ with CZT
The interaction of DCNQ with CZT was allowed to proceed in different solvents of varying dielectric constants and polarity indexes and the absorption spectra were recorded (Fig. 2A); the maximum absorption peaks (λmax) and molar absorptivity (ε) were determined in each solvent. Shifts in the λmax value were observed, and the ε values were also influenced; the obtained values are given in Table 1. The interaction in polar solvents with high dielectric constants (e.g., ethanol) produced more intense higher ε values than those produced in solvents with low polar indexes and dielectric constants (e.g., 1,4-dioxane); however the reaction did not proceed at all in non-polar solvent (chloroform). The values of ε were correlated with both the dielectric constants (Vogel, 1989) and polarity indexes (Polarity Index, 2014) of the solvent in which the reaction was performed (Fig. 2B); correlation coefficients were (r) = 0.9567 and 0.9069 for dielectric constants and polarity indexes, respectively. This was due to the electron transfer from CZT (electron donor; D) to DCNQ (electron acceptor; A) that takes place in the polar solvents. Among all the solvents tested, ethanol was selected for subsequent experiments because it offered the most intense (highest ε value) complexes. This was due to the high dielectric constant of ethanol that promotes a maximum yield of radical anion of DCNQ.
Figure 2.
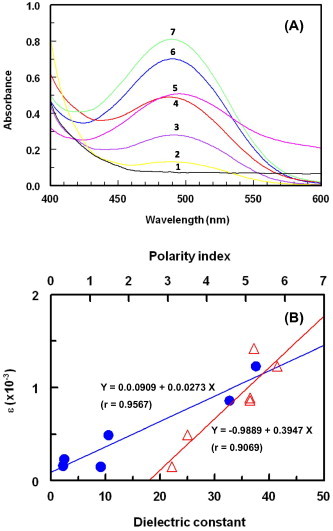
Panel (A): absorption spectra of reaction mixtures of DCNQ (2.28 × 10⁻³ M) and CZT (4.44 × 10⁻⁴ M) in different solvents. Solvents were: chloroform (1), 1,4-dioxane (2), dichloroethane (3), dichloromethane (4), propane-2-ol (5) and ethanol (6). Panel (B): the plot of molar absorptivity (ε) of DCNQ-CZT complex versus dielectric constant (●) and polarity index (△) of the solvent and the fitting linear equations.
Table 1.
Effect of solvents on the position and intensity of absorption of the reaction mixture of DCNQ (2.28 × 10⁻³ M) with CZT (4.44 × 10⁻⁴ M).
| Solvent | Dielectric constant | Polarity index | λmax | ε (×103) |
|---|---|---|---|---|
| Acetonitrile | 37.5 | 5.7 | 490 | 1.23 |
| Methanol | 32.7 | 5.1 | 488 | 0.86 |
| Ethanol | 24.6 | 5.2 | 490 | 1.42 |
| Acetone | 20.7 | 5.1 | 495 | 0.89 |
| Dichloromethane | 10.5 | 3.5 | 492 | 0.49 |
| Toluene | 2.4 | 2.4 | 489 | 0.23 |
3.3. Molar ratio of the reaction, computational modeling of the CT complex, determination of the sites of interaction and proposing the reaction mechanism
The molar ratio of CZT to DCNQ was determined and it was found that the CZT:DCNQ ratio was 1:2. This indicated that two sites of interaction on CZT molecule involved in the formation of the colored CT complex with DCNQ and two DCNQ molecules were required for formation of the complex. For investigating these two possible sites of interaction and explaining the reaction pathway, modeling for the CT complex was conducted. The electron density on each atom of CZT molecule was calculated. As well, one CZT molecule and two DCNQ molecules were energy-minimized alone and together. It was found that the electron densities located on the nitrogen atom of the primary amino group (NH2) attached to the pyridine ring and the nitrogen atom of the piperidine ring are the highest electron densities among all CZT atoms. These densities were 0.45561 and 0.39580, respectively; the negative signs indicate the negative electron densities. As shown in pose depicted in Fig. 3, one DCNQ molecule was found near the primary amino group (NH2) attached to the pyridine ring and the other DCNQ molecule found near the nitrogen atom of the piperidine ring. These observations, taking the molar ratio into account, suggested that the nitrogen atom of the primary amino group (NH2) attached to the pyridine ring and the nitrogen atom of the piperidine ring are the electron-donating sites on CZT molecules those involved in the formation of CT complex with DCNQ. The other anticipated centers did not contribute in the CT reaction based on the fact that certain electron density was required for achievement of a successful electron transfer (Foster, 1969). Based on these results, the CT reaction of CZT with DCNQ was postulated to proceed as described in Fig. 4.
Figure 3.
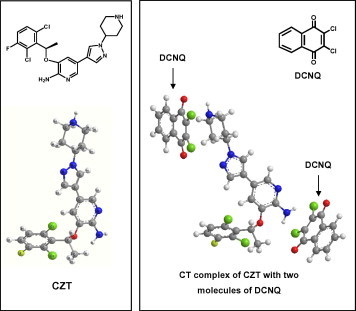
Energy-minimized CZT and its CT complex with two molecules of DCNQ.
Figure 4.
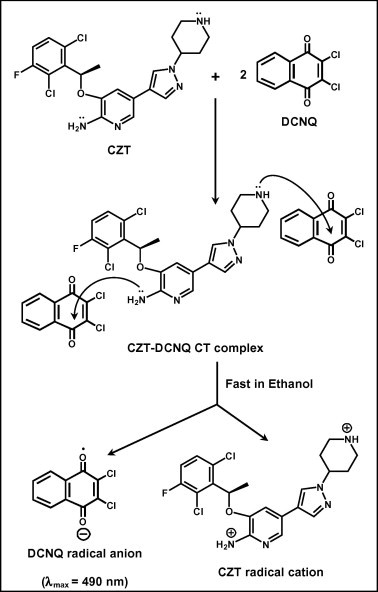
Scheme for the CT reaction pathway of CZT with DCNQ.
3.4. Kinetic study for the formation of DCNQ-CZT CT complex
The interaction of DCNQ with CZT was carried out at room temperature (25 ± 2 °C) and the absorbance-time curves for the reaction of varying CZT concentrations (0.23 × 10⁻⁴ to 1.14 × 10⁻⁴ M) with a fixed concentration of DCNQ (2.28 × 10⁻³ M) were generated (Fig. 5A). The initial reaction rates (K) were determined from the slopes of these curves. The logarithms of the reaction rate (log K) were plotted as a function of logarithms of CZT concentrations (log C) (Fig. 5B).
Figure 5.
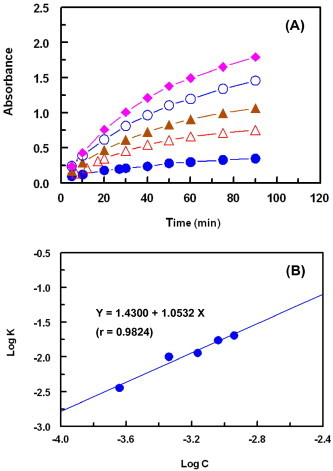
Panel (A): the absorption-time curves for the reaction of DCNQ (2.28 × 10⁻³ M) with varying concentrations of CZT; these concentrations were: 0.23 × 10⁻⁴ (●), 0.46 × 10⁻⁴ (△), 0.89 × 10⁻⁴ (▴), 0.91 × 10⁻⁴ (○), and 1.14 × 10⁻⁴ (♦) M. All solutions were prepared in ethanol and the reactions were carried out at room temperature (25 ± 2 °C). Panel (B): linear plot for log C vs. log K for the kinetic reaction of DCNQ (2.28 × 10⁻³ M) with varying concentrations of CZT (0.23 × 10⁻⁴ to 1.14 × 10⁻⁴ M). C and K are the CZT concentration (M) and the reaction rate (s−1), respectively.
The regression analysis for the values was performed by fitting the data to the following equation:
| (1) |
where K is reaction rate, k′ is the rate constant, C is the molar concentration of CZT, and n (slope of the regression line) is the order of the reaction. A straight line with slope values of 0.9824 (≈1) was obtained confirming that the reaction was first order. However under the reaction conditions, the concentration of DCNQ was in large excess compared to that of CZT in the reaction solution. Therefore, the reaction was regarded as a pseudo-first order reaction.
The absorbance-time curves at different temperatures (25–60 °C) were generated (Fig. 6A) using fixed concentration of CZT (1.14 × 10⁻⁴ M) and DCNQ (2.28 × 10⁻³ M). From these curves the apparent rate constants were calculated. The activation energy, defined as the minimum kinetic energy that a molecule possesses in order to undergo a reaction, was determined using Arrhenius equation (Martin et al., 2004):
| (2) |
where k is the apparent rate constant, A is the frequency factor, Ea is the activation energy, T is the absolute temperature (°C + 273), and R is the gas constant (1.987 calories/degree/mole). The values of log k were plotted as a function of 1/T. Straight lines with slope (=−Ea/2.303R) value of −921.394 was obtained (Fig. 6B). From these value data, the activation energy was calculated and found to be 4.2 kcal/mol. This low activation energy explained that the reaction between DCNQ and CZT was not strongly dependent on the temperature and DCNQ could be used as a useful chromogenic derivatization reagent for the development of a sensitive spectrophotometric assay for the determination of CZT.
Figure 6.
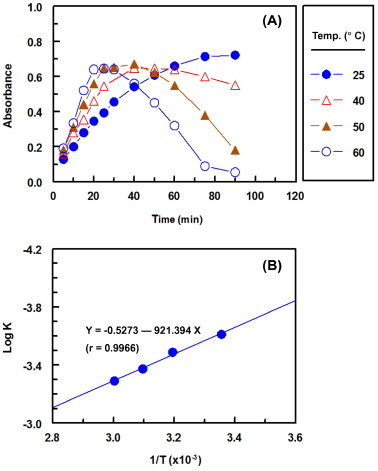
Panel A: absorbance-time curves of reaction mixtures containing fixed concentrations of CZT (0.46 × 10⁻⁴ M) with DCNQ (2.28 × 10⁻³ M) at different temperatures. Panel B: Arrhenius plot for the reaction of CZT with DCNQ at varying temperatures.
3.5. Association constant for the CZT-DCNQ CT complex
The association constant was evaluated at room temperature (25 ± 2 °C) and at the λmax of CZT–DCNQ complex using the Benesi–Hildebrand equation (Benesi and Hildebrand, 1949):
| (3) |
where [Ao] is the molar concentration of the acceptor (DCNQ); [Do] is the molar concentration of the donor (CZT); AAD is the absorbance of the complex formed at the λmax; εAD is the molar absorptivity of the complex; KcAD is the association constant of the complex (l/mole). Upon plotting the values [Ao]/AAD versus l/[Do], a straight line was obtained (Fig. 7), from which the association constant, correlation coefficient, and the molar absorptivity (ε) of the CZT–DCNQ complex were calculated. The intercept of the fitting line was corresponding to 1/εAD and the association constant was calculated from the slope value of the line and the derived value of εAD. The molar absorptivity and association constant of the complex were found to be 6.49 × 10³ l/mole/cm and 1.07 × 10² l/mole, respectively. The relative low value of the association constant was attributed to the common feature for CT complexes with π-acceptors because of the dissociation of the original donor–acceptor complex to the radical anion (Foster, 1969).
Figure 7.
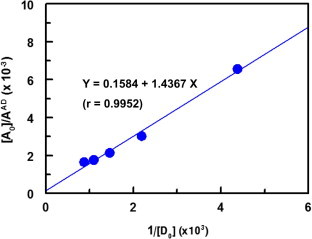
Benesi–Hildebrand plot of CT complex of DCNQ with CZT and the linear fitting equation. [Ao], AAD and [D0] are the molar concentration of DCNQ, absorbance of the complex reaction mixture, and molar concentration of CZT, respectively. All solutions were prepared in ethanol and the reactions were carried out at room temperature (25 ± 2 °C).
3.6. Development of microwell assay
3.6.1. Strategy for the assay development and it design
Based on the aforementioned successful formation of a red CT complex between CZT and DCNQ, the reaction was attempted as a basis for the development of CT-based spectrophotometric assay for the pharmaceutical quality control (QC) of CZT. The conventional CT-based spectrophotometric methods have low throughput. In addition, these methods consume large volumes of organic solvents, which lead to high analysis cost, and more importantly, the incidence of exposure of the analysts to the toxic effects of the organic solvents (Fidler et al., 1987; Wennborg et al., 2000, 2002; Lindbohm et al., 2007; Kristensen et al., 2008). Reduction of human exposure to organic solvents is one of the main objectives of hygienists, public authorities, World Health Organization, environment protection agencies, and occupational safety and health administrations. For these reasons, investigating new alternative methodological approaches to reduce the consumption of organic solvents in CT-based photometric analysis is very important. Therefore, the present research was devoted to employ the CT reaction of CZT in the development of novel non-conventional photometric method with high analysis throughput and can reduce the consumption of organic solvents in the QC of CZT.
In previous studies (Darwish et al., 2010, 2012, 2013) a microwell plate reader equipped with spectrophotometric detection has employed in the development of high-throughput photometric assays for measuring the active drug contents in pharmaceutical preparations. For these reasons, the present study was designed to employ this methodology for CZT; the reaction was carried out in 96-microwell plates (200 μl volume). For high throughput analysis, the solutions were dispensed by 8-chanel pipette, and the absorbances were measured by a plate reader, which was able to read the 96 well simultaneously in ∼30 s.
3.6.2. Optimization of assay conditions
The conditions for carrying out the reaction in the 96-microwell assay plate were optimized by altering each reaction variable in a turn while keeping the others constant. The studied conditions were: concentration of DCNQ reagent, reaction time, and temperature. The studied range of these conditions and the optimum value that was selected for the assay development are given in Table 2.
Table 2.
Optimization of experimental conditions for the microwell spectrophotometric assay for CZT based on its formation of colored CT complex with DCNQ.
| Condition | Studied range | Optimum |
|---|---|---|
| DCNQ conc. (%, w/v) | 0.01–1 | 0.5 |
| Solvent | Differenta | Ethanol |
| Reaction time (min) | 0–90 | 45 |
| Temperature (°C) | 25–60 | 25 |
| λmax (nm) | 400–600 | 490 |
Solvents used were given in Table 1.
3.7. Validation of the assay
3.7.1. Linearity and sensitivity
Calibration curve for the analysis of CZT by the proposed assay was constructed and it was found that Beer’s law plot (8-concentration levels, n = 5) was linear in the range of 4–500 μg mL−1. The limits of detection (LOD) and quantitation (LOQ) were determined (ICH Guideline, 2005) and found to be 3.96 and 12.00 μg/ml, respectively. The quantitative parameters of the proposed microwell assay are given in Table 3.
Table 3.
Quantitative parameters for the analysis of CZT by the microwell spectrophotometric assay based on the CT reaction of CZT with DCNQ.
| Parameter | Value |
|---|---|
| Linear range (μg/ml) | 4–500 |
| Intercept | 0.0005 |
| Standard deviation of intercept | 2.4 × 10⁻³ |
| Slope | 0.0002 |
| Standard deviation of slope | 1.2 × 10⁻⁶ |
| Correlation coefficient | 0.9999 |
| LOD (μg/ml) | 3.96 |
| LOQ (μg/ml) | 12.00 |
3.7.2. Precision
The intra- and inter-assay precision was assessed and the calculated relative standard deviations (RSD) were 0.95–1.74 and 1.48–1.78 in case of intra- and inter-assay precision, respectively (Table 4). These low RSD values proved the high precision of the assay for the routine application in quality control laboratories for determination of CZT.
Table 4.
Precision of the proposed assay at different CZT concentration levels.
| Concentration (μg/ml) | Relative standard deviation |
|
|---|---|---|
| Intra-assay, n = 5 | Inter-assay, n = 3 | |
| 25 | 1.52 | 1.75 |
| 50 | 1.45 | 1.62 |
| 100 | 1.03 | 1.48 |
| 200 | 0.95 | 1.55 |
| 400 | 1.65 | 1.78 |
3.7.3. Accuracy, selectivity and interference liabilities
The accuracy of the proposed assay was assessed by the recovery studies for varying CZT concentrations (Table 4). The recovery values were 98.64–101.53 ± 1.45–2.12% (Table 5), indicating the accuracy of the proposed assay. Before proceeding with the analysis of CZT in its dosage forms (capsules), interference liabilities were carried out to explore the effect of inactive ingredients that might be added during CZT capsules formulation (Xalkori, 2013). Samples were prepared by mixing a known amount (250 mg) of CZT with 50 mg of microcrystalline cellulose, 10 mg of colloidal silicon dioxide, 5 mg of anhydrous dibasic calcium phosphate, 5 mg of sodium starch glycolate, and 5 mg of magnesium stearate. These laboratory-prepared samples were analyzed by the proposed method applying the general recommended procedure. The recovery values ranged from 96.50–101.69 ± 0.31–1.76% (Table 5). These data confirmed the absence of interference from any of the inactive ingredients with the determination of CZT by the proposed assay.
Table 5.
Recovery study for determination of CZT by the proposed microwell spectrophotometric assay.
| Concentration (μg/ml) |
Recovery (% ± SD) a | |
|---|---|---|
| Taken | Measured | |
| 25 | 24.88 | 99.52 ± 1.85 |
| 50 | 50.55 | 101.10 ± 1.18 |
| 100 | 101.53 | 101.53 ± 1.45 |
| 200 | 198.64 | 99.32 ± 2.12 |
| 400 | 394.57 | 98.64 ± 2.05 |
Values are mean of three determinations.
3.7.4. Robustness and ruggedness
Robustness was examined by evaluating the influence of small variation in the assay variables on its analytical performance. In these experiments, one parameter was changed whereas the others were kept unchanged, and the recovery percentage was calculated each time. It was found that small variation in the method variables did not significantly affect the procedures; recovery values ranged from 97.12–102.14 ± 1.05–1.82% (Table 7). This indicated the reliability of the proposed assay for routine application for the analysis of CZT.
Table 7.
Robustness and ruggedness of the proposed microwell spectrophotometric assay for determination of CZT.
| Parameters | Recovery (% ± SD) a |
|---|---|
| Robustness | |
| DCNQ concentration (%, w/v) | |
| 0.4 | 97.12 ± 1.28 |
| 0.6 | 99.48 ± 1.09 |
| Reaction time (min) | |
| 40 | 101.65 ± 1.82 |
| 50 | 102.14 ± 1.47 |
| Temperature (° C) | |
| 23 | 98.77 ± 1.63 |
| 28 | 100.85 ± 1.05 |
| Ruggedness | |
| Instrument to-instrumentb | |
| Instrument-1 | 98.45 ± 1.09 |
| Instrument-2 | 99.82 ± 1.84 |
| Day-to-day | |
| Day-1 | 101.62 ± 1.81 |
| Day-2 | 97.94 ± 1.25 |
| Day-3 | 102.46 ± 1.94 |
Values are the mean of three determinations ± SD.
Instruments 1 and 2 were Spectramax M5 (Molecular Devices, California, USA) and ELx 808 (Bio-Tek Instruments Inc., USA), respectively.
Ruggedness was also tested by applying the proposed methods to the assay of CZT using the same operational conditions but using two different instruments at two different laboratories and different elapsed time. Results obtained from lab-to-lab and day-to-day variations were reproducible, as the RSD values ranged from 97.94–102.46 ± 1.09–1.94% (Table 6).
Table 6.
Analysis of CZT in presence of the excipients those are present in its capsules by the proposed microwell spectrophotometric assay.
| Excipient | Recovery (% ± SD)a |
|---|---|
| Microcrystalline cellulose (50)b | 100.94 ± 1.72 |
| Colloidal silicon dioxide (10) | 98.40 ± 1.73 |
| Anhydrous dibasic calcium phosphate (5) | 101.69 ± 0.48 |
| Sodium starch glycolate (5) | 96.50 ± 1.76 |
| Magnesium stearate (5) | 99.43 ± 0.31 |
Values are mean of three determinations.
Figures in parenthesis are the amounts (in mg) that were added per 250 mg of CZT.
3.8. Application of the proposed assay in the analysis of CZT capsules
The CZT-containing capsules were subjected to the analysis by the proposed assay for their CZT content. The mean percentage recovery, relative to the labeled amounts, obtained by the proposed assay was 98.19 ± 0.86%. This good recovery values indicated the reliability of the proposed assay for routine application for the accurate determination of CZT in pharmaceutical QC laboratories.
4. Conclusions
The present study described, for the first time, the CT reaction between DCNQ and CZT. The DCNQ:CZT ratio was 2:1 and the formation constant of the CT complex was determined. The molar absorptivity of the complex was sensitive to the change in dielectric constant and polarity index of the solvent. The electron donating sites on CZT molecule was determined by the computational molecular modeling for the CT complex, and the reaction mechanism was postulated. The reaction was employed as a basis for new microwell spectrophotometric assay for determination of CZT in its capsules. The assay provided a high analytical throughput that can facilitate the processing of a large number of samples in a relatively short time. This property was attributed to the use of multi-channel pipettes for efficient dispensing of the solutions, carrying out the analytical reaction in 96-well plates (as reaction vessels), and measuring the color signals in the 96 wells at ∼30 s by the plate reader. In addition, the assay can reduce the consumption of organic solvents, accordingly reduction in the exposures of the analysts to the toxic effects of organic solvents, and reduction in the analysis cost when applied in pharmaceutical quality control laboratories.
Acknowledgments
The authors would like to extend their appreciation to the Deanship of Scientific Research at King Saud University for its funding of this research through the research group project No. RGP-VPP-225.
Footnotes
Peer review under responsibility of King Saud University.

References
- Atkins P.J., Shriver D.F. third ed. Freeman & Co.; New York: 1999. Inorganic Chemistry. [Google Scholar]
- Benesi H.A., Hildebrand J. A spectrophotometric investigation of the interaction of iodine with aromatic hydrocarbons. J. Am. Chem. Soc. 1949;71:2703–2707. [Google Scholar]
- Bolton J.R., Mataga N., McLendon G. American Chemical Society; Washington DC: 1991. Electron Transfer in Inorganic, Organic, and Biological Systems. [Google Scholar]
- Chatterjee S. Studies on charge–transfer complexes of 1,4-naphthoquinone acceptors. J. Chem. Soc. B. 1971;2194–2197 [Google Scholar]
- Darwish I.A., Abdel-Wadood H.A., Abdel-Latif N.A. Validated spectrophotometric and fluorimetric methods for analysis of clozapine in tablets and urine. Ann. Chim. 2005;95:345–356. doi: 10.1002/adic.200590039. [DOI] [PubMed] [Google Scholar]
- Darwish I.A., Mahmoud A.M., Al-Majed A.A. A novel analytical approach for reducing the consumption of organic solvents in the charge transfer-based spectrophotometric analysis: application in the analysis of certain antihypertensive drugs. Acta Pharm. 2010;60:493–501. doi: 10.2478/v10007-010-0035-6. [DOI] [PubMed] [Google Scholar]
- Darwish I.A., Wani T.A., Khalil N.Y., Al-Shaikh A., Al-Morshadi N. Development of a novel microwell assay with high throughput for determination of olmesartan medoxomil in its tablets. Chem. Cent. J. 2012;6(1):1–7. doi: 10.1186/1752-153X-6-1. [DOI] [PMC free article] [PubMed] [Google Scholar]
- Darwish I.A., Askal H.F., Refaat I.H., Marzouk M.A., Ahamad S.R. Novel microwell-based spectrophotometric method with high throughput for determination of 4-quinolone antibiotics in their pharmaceutical formulations via spontaneous formation of water soluble ion-pair complexes. Latin Am. J. Pharm. 2013;32:1088–1097. [Google Scholar]
- Datta K., Mukherjee A.K. Study of a reaction between 2,3-dichloro-1,4-naphthoquinone and N,N′-diphenyl thiourea involving an EDA adduct as intermediate. Spectrochim. Acta, Part A. 2004;60:1641–1647. doi: 10.1016/j.saa.2003.09.007. [DOI] [PubMed] [Google Scholar]
- Dutta K., Roy D.K., Mukharjee A.K. Spectroscopic and thermodynamic study of charge transfer interaction between vitamin B6 and p-chloranil in aqueous ethanol mixtures of varying composition. Spectrochim. Acta, Part A. 2008;70:425–429. doi: 10.1016/j.saa.2007.12.024. [DOI] [PubMed] [Google Scholar]
- El-Bagary R.I., Elkady E.F., Ayoub B.M. Spectrophotometric methods for the determination of sitagliptin and vildagliptin in bulk and dosage forms. Int. J. Biomed. Sci. 2011;7:55–61. [PMC free article] [PubMed] [Google Scholar]
- El-Bagary R.I., Elkady E.F., Ayoub B.M. Spectrophotometric methods based on charge transfer complexation reactions for the determination of saxagliptin in bulk and pharmaceutical preparation. Int. J. Biomed. Sci. 2012;8:204–208. [PMC free article] [PubMed] [Google Scholar]
- Eychimüller A., Rogach A.L. Chemistry and photophysics of thiol-stabilized II–IV semiconductor nanocrystals. Pure Appl. Chem. 2000;72:179188. [Google Scholar]
- Fakhroo A.A., Bazzi H.S., Mostafa A., Shahada L. Synthesis, spectroscopic and thermal structural investigations of the charge–transfer complexes formed in the reaction of 2-methylpiperidine with σ- and π-acceptors. Spectrochim. Acta, Part A. 2010;75:134–141. doi: 10.1016/j.saa.2009.09.055. [DOI] [PubMed] [Google Scholar]
- FDA approval for crizotinib. Posted on Aug. 29, 2011. http://www.cancer.gov/cancertopics/druginfo/fda-crizotinib. Accessed March 11, 2014.
- Fidler A.T., Baker E.L., Letz R.E. Neurobehavioural effects of occupational exposure to organic solvents among construction painters. Br. J. Ind. Med. 1987;44:292–308. doi: 10.1136/oem.44.5.292. [DOI] [PMC free article] [PubMed] [Google Scholar]
- Foster R. Academic Press; New York, USA: 1969. Organic Charge–Transfer Complexes. [Google Scholar]
- ICH Guideline Q2(R1), (2005). Validation of analytical procedures: text and methodology. The International Conference on Harmonization, London.
- Kalyanaramu B., Rupakumari G., Ramarao K., Raghubabu K. Development of new visible spectrophotometric methods for quantitative determination of sumatriptan succinate based on charge–transfer complex formation. Int. J. Pharm. Pharm. Sci. Res. 2011;1:47–51. [Google Scholar]
- Kris, M.G., HemOncToday, 2010. http://www.healio.com/hematology-oncology/lung-cancer/news/online/%7B7F093ECD-D7CD-420A-86E2-F47AC2497224%7D/ALK-inhibitor-crizotinib-has-high-response-rate-in-patients-with-ALK-positive-NSCLC. Accessed March 11, 2014.
- Kristensen P., Hilt B., Svendsen K., Grimsrud T.K. Incidence of lymphohaematopoietic cancer at university laboratory: a cluster investigation. Eur. J. Epidemiol. 2008;23:11–15. doi: 10.1007/s10654-007-9203-5. [DOI] [PubMed] [Google Scholar]
- Kuznetsov A.M., Ulstrup J. John Wiley & Sons; New York: 1999. Electron Transfer in Chemistry and Biology: An Introduction to the Theory. [Google Scholar]
- Lindbohm M.L., Taskinen H.T., Sallman M., Hemminki K. Spontaneous abortions among women exposed to organic solvents. Am. J. Ind. Med. 2007;17:449–463. doi: 10.1002/ajim.4700170404. [DOI] [PubMed] [Google Scholar]
- Martin A., Swarbrick J., Cammarata A., Chun A. third ed. Lea & Febiger; Philadelphia, USA: 2004. Physical Pharmacy: Physical Chemical Principles in the Pharmaceutical Sciences. p. 371. [Google Scholar]
- Nudelman N.S., Monica S., Alvaro C.E., Nicotra V., Yankelevich J. Reactions of 2,4-dinitrobenzene with aniline. solvent effect and molecular complex formation. J. Chem. Soc. Perkin Trans. 1999;2:1627–1630. [Google Scholar]
- Pandeeswaran M., Elango K.P. Spectroscopic studies on the molecular complex of the drug atenolol with iodine. J. Solution Chem. 2009;38:1558–1572. [Google Scholar]
- Pandeeswaran M., El-Mossalamy E.H., Elango K.P. Spectroscopic studies on the dynamics of charge–transfer interaction of pantoprazole with DDQ and iodine. Int. J. Chem. 2009;41:787–799. [Google Scholar]
- Pandeswaran M., Elango K.P. Spectroscopic studies on the interaction of cimetidine drug with biologically significant σ- and π-acceptors. Spectrochim. Acta, Part A. 2010;75:1462–1469. doi: 10.1016/j.saa.2010.01.017. [DOI] [PubMed] [Google Scholar]
- Polarity Index. http://macro.lsu.edu/howto/solvents/polarity%20index.htm. Accessed January 1, 2014.
- Rao C.N. Butterworth; London, UK: 1975. Ultraviolet and visible spectroscopy. [Google Scholar]
- Rappaport Z. Nucleophilic attacks on carbon–carbon double bonds. Part V. The reaction of dimethylaniline with tetracyanoethylene: π- and σ -complexes in chloroform. J. Chem. Soc. 1963;4498–4512 [Google Scholar]
- Roy T., Datta K., Nayek M.K., Mukharjee A.K., Banerjee M., Seal B.K. Study of novel reaction between N,N-diphenylthiourea and p-chloranil through a charge–transfer intermediate. J. Chem. Soc. Perkin Trans. 1999;2:2219–2223. [Google Scholar]
- Saha A., Tiwary A.S., Mukherjee A.K. Charge transfer interaction of 4-acetamidophenol (paracetamol) with 2,3-dichloro-1,4-naphthoquinone: a study in aqueous ethanol medium by UV–vis spectroscopic and DFT methods. Spectrochim. Acta, Part A. 2008;71:835–840. doi: 10.1016/j.saa.2008.01.034. [DOI] [PubMed] [Google Scholar]
- Saito G., Matsunaga Y. The electron acceptor strength of some substituted naphthoquinones. Bull. Chem. Soc. Jpn. 1971;44:1788–1791. [Google Scholar]
- Singh P., Kumar P., Katyal A., Kalra R., Dass S.K., Prakash S., Chandra R. Synthetic and electrochemical studies of charge–transfer complexes of thiazolidine-2,4-dione with σ- and π-acceptors. Spectrochim. Acta, Part A. 2010;75:983–991. doi: 10.1016/j.saa.2009.12.019. [DOI] [PubMed] [Google Scholar]
- Taboada P., Gutierrez-Pichel M., Barbosa S., Attwood D., Mosquera V. Effect of temperature on the volume and compressibilities of some amphiphilic penicillins in aqueous solution. Phys. Chem. Chem. Phys. 2003;5:703–709. [Google Scholar]
- Taha A., Rücker G. Utility of pi-acceptors in alkaloid assay. Arch. Pharm. (Weinheim) 1977;310:485. doi: 10.1002/ardp.19773100608. [DOI] [PubMed] [Google Scholar]
- Takahasi K., Horino K., Komura T., Murata K. Photovoltaic properties of porphyrin thin films mixed with o-chloranil. Bull. Chem. Soc. 1993;66:733–738. [Google Scholar]
- Vogel A.I. fifth ed. London, England; Longman Group UK Ltd: 1989. Vogel’s Textbook of Practical Organic Chemistry. p. 1442. [Google Scholar]
- Wennborg H., Lennart B., Harri V., Gösta A. Pregnancy outcome of personnel in Swedish biomedical research laboratories. J. Occup. Environ. Med. 2000;42:438–446. doi: 10.1097/00043764-200004000-00022. [DOI] [PubMed] [Google Scholar]
- Wennborg H., Bonde J.P., Stenbeck M., Olsen J. Adverse reproduction outcomes among employee in biomedical research laboratories. Scand. J. Work Environ. Health. 2002;28:5–11. doi: 10.5271/sjweh.640. [DOI] [PubMed] [Google Scholar]
- Xalkori (2013, March 13). crizotinib package insert, New York: Pfizer Labs., Division of Pfizer Inc. (New York, NY, USA; LAB-0441-6.0, 2013. http://labeling.pfizer.com/showlabeling.aspx?id=676. Accessed March 11, 2013.