

Abstract
Quantitative determination of gatifloxacin in tablets, solid lipid nanoparticles (SLNs) and eye-drops using a very simple and rapid chromatographic technique was validated and developed. Formulations were analyzed using a reverse phase SUPELCO® 516 C-18-DB, 50306-U, HPLC column (250 mm × 4.6 mm, 5 μm) and a mobile phase consisting of disodium hydrogen phosphate buffer:acetonitrile (75:25, v/v) and with orthophosphoric acid pH was adjusted to 3.3 The flow rate was 1.0 mL/min and analyte concentrations were measured using a UV-detector at 293 nm. The analyses were performed at room temperature (25 ± 2 °C). Gatifloxacin was separated in all the formulations within 2.767 min. There were linear calibration curves over a concentration range of 4.0–40 μg.mL−1 and correlation coefficients of 0.9998 with an average recovery above 99.91%. Detection of analyte from different dosage forms at the same Rt indicates the specificity and stability of the developed method.
Keywords: Gatifloxacin, HPLC, Method validation, Accelerated stability, Solid lipid nanoparticles
1. Introduction
Gatifloxacin (GTX) is a synthetic broad spectrum fluoroquinolone antibiotic obtained from nalidixic acid, used to treat various a wide range of infectious diseases (Fig. 1). Fluoroquinolones are quinolones having fluorine at the 6th position of the naphthyridine ring. Published structure–activity data show that the presence of fluorine atom (F) at C6 position broadens their activity spectrum against both Gram-negative and Gram-positive pathogens (Arteseros et al., 2002). The methyl substituent on the piperazine ring contributes to its Gram-positive activity, prolongs the half-life allowing for once daily dosing, provides metabolic stability as evident by primary renal elimination of unchanged drug, and may limit potentially adverse interaction with the drug metabolizing enzyme. GTX has a cyclopropyl group at the N1 position like ciprofloxacin and sparfloxacin which boosts Gram negative activity and provides some Gram positive activity. Like ciprofloxacin and sparfloxacin, GTX has a cyclopropyl group at the N1 position that enhances Gram-negative activity and provides some Gram-positive activity. GTX lacks the 2,4-difluorophenyl group at the N1 position that was postulated to induce hepatic and hematologic toxicities associated with trovafloxacin and temafloxacin, respectively. Most notably, GTX is characterized by the presence of a methoxy (—OCH3) group at the C8 position. This substituent also possessed by moxifloxacin, confers enhanced activity against DNA-gyrase and Topoisomerase-IV (Fukuda and Hiramatsu, 1999) and may be important in limiting the potential for the development of bacterial resistance. In addition, lack of a halide at the C8 position reduces the potential for phototoxicity.
Figure 1.
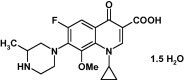
Chemical structure of gatifloxacin (GTX).
In pharmaceutical preparations quantitative determination of fluoroquinolones has been reported by several analytical methods, like capillary electrophoresis (Flurer, 1997), UV spectrophotometry (Gouda et al., 2008; Amin et al., 2007), titrimetry (Belal et al., 1999), on-line solid phase extraction and fluorometric detection by HPLC (Tasso and Costa, 2007), stability indicating high-performance thin-layer chromatographic method for determination of GTX as bulk drug (Motwani et al., 2006) and HPLC (Mirza et al., 2008). Liquid chromatography with column switching technique for GTX determination in serum was developed by Nguyen et al., 2004, but column switching is a difficult and multistep technique so it is not feasible in all analytical laboratories. Mostly HPLC techniques were either very exhaustive or applicable in the identification of fluoroquinolones in biotic fluids, nourishing animal products, feeds (supplements) and to a lesser extent, in pharmaceutical formulations. Majority of the described techniques involve troublesome mobile phase (buffers) and difficult detection methods (fluorescence or mass detectors) (Samanidou et al., 2003 and Joshi, 2002). The main objective of this procedure is to develop and validate an economical, rapid and sensitive method for the quantitative determination of the drug in commercial eye drops and tablets as well as prepared solid lipid nanoparticles where all formulations containing the same fluoroquinolone molecule gatifloxacin could be determined on a single chromatographic system at the wavelength, 293 nm. Although other HPLC analysis methods for GTX have been reported, this proposed method carries two main advantages: (i) versatility proven by the validity of our method to determine GTX level in different pharmaceutical forms including bulk drug, tablets, eye drops, and solid lipid nanoparticles (SLNs) using the very same defined conditions with the same mobile phase, and (ii) the method is considerably fast where GTX retention time was as short as 2.67 min.
2. Materials and methods
2.1. Materials
Gatifloxacin sesquihydrate was kindly gifted by Wockhardt Pharmaceuticals, Aurangabad, India, and used as reference standard without further purification. Acetonitrile (Spectrochem Pvt. Ltd. Mumbai, India), orthophosphoric acid (CDH Pvt. Ltd. New Delhi, India), methanol (MerkSpecialities, Pvt. Ltd. Mumbai, India), and analytical grade disodium hydrogen phosphate (CDH Pvt. Ltd. New Delhi, India) were purchased. Milli-Q, Millipak® 40, Millipore System was used to purify water. Purification of all solvents and solutions was done by using the membrane filter (Millipore®Millex-HV filter units, Durapore-PVDF, polyethylene, 0.45 μm pore size) and degassed before use by ultrasonication (Ultrasonicator, PCI, Mumbai, India). All other solvents used were of HPLC and reagents were of analytical grade. Different pharmaceutical dosage forms of different manufacturers, presented in Table 1 were used as samples for the analysis by the developed method.
Table 1.
Commercial dosage forms and solid lipid nanoparticles (SLNs) of GTX used in the developed HPLC method.
| Samples | Drug/active molecule | Manufacturers | Pharmaceutical dosage form | Brand names | Batch number |
|---|---|---|---|---|---|
| ED-1 | Gatifloxacin sesquihydrate | Ajantha Pharma Ltd. | Eye drops 0.3%, w/v | Gate eye drops | CA 047A |
| ED-2 | Gatifloxacin base | Cipla Ltd. | Eye drops 0.3%, w/v | Gatiquin eye drops | G 70503 |
| TAB-1 | Gatifloxacin base | Cipla Ltd. | Tablet 400 mg | Gatiquin tablet | D 80338 |
| TAB-2 | Gatifloxacin base | Dr. Reddy’s Lab. | Tablet 400 mg | Gaity tablet | V 80306 |
| SLN-A | Gatifloxacin sesquihydrate | – | Suspension 0.3%, w/v | – | – |
| SLN-B | Gatifloxacin sesquihydrate | – | Suspension 0.3%, w/v | – | – |
| SLN-C | Gatifloxacin sesquihydrate | – | Suspension 0.3%, w/v | – | – |
| SLN-D | Gatifloxacin sesquihydrate | – | Suspension 0.3%, w/v | – | – |
2.2. Instrumentation and chromatographic conditions
Quaternary pump high pressure liquid chromatograph model Shimadzu® LC-9A, equipped with UV–visible detector model SPP-6A, controlling system SCL-6B, connected to a microcomputer with “Chemstation” Shimadzu® Class LC-10 Version 1:62 is used for integration and processing of chromatograms. A reversed phase SUPELCO® 516 C-18-DB, 50306-U, HPLC Column of dimension 250 mm × 4.6 mm, 5 μm was used as the analytical column. All analysis was done at ambient temperature (25 ± 2 °C). The mobile phase is a mixture of 0.02 M disodium hydrogen phosphate buffer:acetonitrile (75:25, v/v) and using orthophosphoric acid pH was adjusted to 3.3. The flow rate was 1.0 mL.min−1 and volume of injection was 20 μL. Before using all solutions the mobile phase was sonicated for 30 min and UV detection was performed at 293 nm for GTX.
2.3. Calibration curves
Accurately weighed amount of standard of gatifloxacin sesquihydrate bulk, equivalent to 10 mg of free base was transferred to a 100 mL volumetric flask. The volume was completed with the mobile phase. The prepared solutions were sonicated during 30 min and filtered through a membrane filter (0.45 μm). Final concentration was 100 μg.mL−1. Aliquots of each solution were accordingly diluted with the mobile phase in order to obtain solutions with a final concentration of 12 μg.mL−1. Every day solutions are prepared freshly. Ten different concentrations of GTX bulk (4, 8, 12, 16, 20, 24, 28, 32, 36 and 40 μg.mL−1) were obtained of each standard solution and diluted with mobile phase. 20 μL of each solution was injected in the chromatographic system (n = 3) and mean values of peak areas were plotted against concentrations.
2.4. Method validation
Linearity refers to “the relationship of (the analyte) concentration and assay measurement” (USP, 2007). We evaluated linearity by calibrating the curves to calculate the coefficient of correlation and the intercept values. Moreover, method precision was evaluated through intraday and interday repeatability. For this purpose, the interday and intraday variation for GTX determination was carried out at different concentration levels (4, 12, 18, 32 and 40 μg.mL−1) and expressed in terms of % RSD and standard error of mean (SEM). Recovery tests were done to assess the accuracy of the described technique by applying the technique to drug samples of familiar amounts of GTX corresponding to 50, 100 and 150% of the GTX label claim. Limit of detection (LOD) and limit of quantification (LOQ) were calculated using Eqs. (1) and (2), respectively, where SD is the average standard deviation of the curve and α is the slope of the curve:
| (1) |
| (2) |
Furthermore, robustness was assessed by minor intentional modifications in the mobile phase volume ratio. Mobile phases have different ratios of Na2HPO4 buffer:acetonitrile (75:25 ± 2 mL), changing the pH of this mobile phase (3.3 ± 0.2) and minor alterations in the flow rate (1.0 ± 0.2 mL.min−1) were tried in the proposed method. Robustness of the method was studied in triplicate at a GTX concentration of 12 μg.mL−1.
2.5. Selectivity and specificity
A stock solution containing 100 mg of GTX in 100 mL distilled water was prepared and used for forced degradation to provide an indication of the stability and specificity of the developed HPLC method. Thereafter, to 15 mL of GTX stock solution, 15 mL of 1 N HCl and 15 mL of 1 N NaOH were added separately. Similarly, to 15 mL of stock solution of GTX, 15 mL of hydrogen peroxide (H2O2) (30%, v/v) was added to evaluate oxidative degradation. This solution was heated in boiling water bath for 10 min to completely remove the excess of hydrogen peroxide. All mixtures were refluxed separately for 3 h at 80 °C in the dark in order to prevent light degradation. Then, 120 μL of each mixture was diluted separately with the mobile phase to a final concentration of 12 μg.mL−1. GTX powder was stored at 100 °C for 8 h under dry heat to study the inherent stability of GTX from which a stock solution was prepared as described earlier. 5 mL of the prepared stock solution was diluted to 10 mL with the mobile phase to a final concentration of 50 μg.mL−1. 1.2 mL of the resultant solution was diluted up to 5 mL with the mobile phase to get a concentration of 12 μg.mL−1. Also, 5 mL of the stock solution was diluted to 10 mL with the mobile phase to reach 500 μg.mL−1 and was exposed to UV-irradiation at 254 nm for 8 h in a UV-chamber. 120 μL of the irradiated solution was diluted up to 5 mL with the mobile phase to get a concentration of 12 μg.mL−1. In all degradation studies, all prepared dilutions were filtered through Milli-Q® filter unit before injection into the HPLC system and the average peak area of GTX after injection (12 μg.mL−1) of three replicates was obtained.
2.6. Kinetic study
Kinetic study was conducted to verify the drug stability in solution, but not the stability of drug in the finished product. Briefly, 100 mg of GTX was dissolved in 100 mL distilled water to prepare standard solution (1000 μg.mL−1). 40 mL aliquots of each were transferred in two separate 100 mL double necked round bottomed flasks and mixed with 10 mL of 1 N HCl and 1 N NaOH respectively, to get the final concentration 800 μg.mL−1. These flasks were refluxed at different temperatures (40 °C, 50 °C, 60 °C, 70 °C and 80 °C) for acidic and alkaline degradation for different time intervals. At the specified time, the contents of the flask were neutralized to pH 7.0 using predetermined volumes of 1 N HCl and 1 N NaOH. Accurately 1.5 mL contents of the flask were quantitatively transferred to 100 mL volumetric flasks with the help of microsyringe, and were diluted appropriately up to 100 mL with the mobile phase to get a solution of 12 μg.mL−1 concentration of drug for the quantitative estimation. 20 μL of each filtered solution was injected in to the HPLC system, and the concentration of the non-degraded drug was calculated. Each experiment was repeated three times at each time interval for every temperature. Data were further processed and the degradation kinetics constants were calculated.
2.7. Application of the developed HPLC method
2.7.1. Analysis of GTX in different dosage forms
Ten tablets of GTX of two brands, Gatiquin 400 mg (TAB-1) and Gaity 400 mg (TAB-2) were weighed individually, triturated to acquire a homogeneous mixture. An accurately weighed quantity of triturated mixtures equivalent to 10 mg of freebase of both brands were transferred separately to 100 mL volumetric flasks. The portions were completed with the mobile phase. The resulting solutions were sonicated for 30 min to facilitate proper solubilization. Aliquots of each solution were accordingly diluted with the mobile phase to a final concentration of 12 μg.mL−1 of GTX. All samples were filtered through Milli-Q® filter unit before injection into the system. Gate Eye-drops (0.3%, w/v) as ED-1 and Gatiquin Eye-Drops (0.3%, w/v) as ED-2 were used. The approach adopted for the preparation of eye drop sample was close to that of tablets. Appropriate dilutions were made with the mobile phase to get a final concentration of 12 μg.mL−1 of GTX. SLNs for the eye coded as SLN-A, SLN-B, SLN-C and SLN-D prepared in our laboratory containing equivalent amount of GTX (i.e. 0.3%, w/v). Accurately weighed amount of each SLN containing equivalent amount of drug was dissolved in a mixture of acetone:chloroform (2.5:2.5, v/v) in 10 mL different volumetric flasks, to ensure complete extraction of the drug, it was sonicated for 30 min and volume was completed to 10 mL with chloroform. The resulting solution was centrifuged at 14,000 rpm at 10 °C (Cooling Centrifuge, C24, REMI Instruments Ltd. Mumbai, India) for 30 min and supernatants were obtained. Aliquots of each supernatant were accordingly diluted with the mobile phase, in order to obtain a resulting concentration of 12 μg.mL−1 of drug. All dilutions were filtered through Milli-Q® filter unit before injection into the HPLC system.
2.7.2. Analysis of accelerated stability samples
Among two marketed tablets, TAB-1 was stored in the stability chamber at the accelerated stability conditions: 40 °C, 50 °C, 60 °C, 70 °C, and 80 °C temperatures and at 75 ± 5% RH for 6 months. Similarly, among the two marketed eye-drops, ED-1 was chosen and exact volume of nanosuspension of SLN-B (in 0.9%, w/v NaCl solution) was packed in screw-capped high density polyethylene container and stored at the same accelerated stability temperatures but at 20 ± 5% RH for 6 months (Mathews and Wall, 2000). Testing samples were withdrawn at time points: initial (zero time), 1st month, 3rd month and 6th month and remaining amount of drug contents were analyzed by the developed HPLC method.
3. Results and discussion
3.1. Method validation
In order to validate an efficient method for analysis of drug in pharmaceutical products, preliminary tests were performed with the objective to select adequate and optimum conditions. Parameters, such as detection wavelength, ideal mobile phase and their proportions, optimum pH and concentration of the standard solutions were exhaustively studied and the flow rate of 1 mL.min−1 was selected after preliminary tests.
3.1.1. Development of the optimum mobile phase
The HPLC method was optimized to develop a stability indicating assay method for the quantitative determination of gatifloxacin from solid lipid nanoparticles, tablets and eye drops as mentioned above. Solutions of pure drug and the degraded products were injected in to the HPLC system and run in different solvent systems. Initially acetonitrile–water, acetonitrile–water–methanol and dihydrogen potassium phosphate buffer-acetonitrile in varying ratios were tried. The mobile phase 0.02 M dihydrogen potassium phosphate buffer:acetonitrile (65:35 and 75:25, v/v) gave good results with Rt = 3.525 and 2.925 min respectively for gatifloxacin but the typical peak was not sharp because of tailing. Substitution of 0.02 M, dihydrogen potassium phosphate buffer with 0.025 M disodium hydrogen phosphate buffer improved the peak characteristics and the quantity optimized was 75 mL. Finally, the mobile phase consisting of 0.025 M disodium hydrogen phosphate buffer:acetonitrile (75:25, v/v) gave a sharp and well-defined symmetrical peak at Rt = 2.767 min as shown in Fig. 2.
Figure 2.

Representative chromatogram of gatifloxacin bulk drug showing retention time 2.767 min: (12 μg.mL−1). Conditions: RP-Supelco 516 C-18-DB, 50306-U, HPLC column (250 mm × 4.6 mm, 5 μm), mobile phase, Na2HPO4: MeCN (75:25, v/v); pH adjusted to 3.3 with orthophosphoric acid; flow rate, 1.0 mL.min−1; UV-detection of gatifloxacin at 293 nm at temperature (24 ± 2 °C).
3.1.2. Calibration curves
The linear regression data for the calibration curves (n = 3) of GTX at 293 nm (Table 2) showed a good linear relationship over a concentration range of 4–40 μg.mL−1 with respect to the peak area. No significant difference was observed in the slopes of standard curves (one way ANOVA, P > 0.05). The observed equation of the straight line was found as; y = 118423x + 120390 with R2-value above 0.9998. Linearity data showed concentration interval of gatifloxacin in which the intensity of the detector response is proportional to the concentration of the analyzed substance.
Table 2.
Linear regression data for the calibration curve (n = 3).
| Statistical parameters | Data |
|---|---|
| Linearity range (μg/mL) | 4–40 |
| Correlation coefficient (r2 ± SD) | 0.9998 ± 0.0006 |
| Slope of curve ± SD | 118,423 ± 1439.91 |
| Confidence limit of slopea | 114,846–122,001 |
| SEM of slope | 831.3591 |
| Intercept of curve ± SD | 120,390 ± 1979.62 |
| Confidence limit of intercepta | 115,472–125,308 |
| SEM of intercept | 1142.97 |
95% confidence limit.
3.1.3. Precision
The measurement of the peak area which in turn gave the concentrations at five different spiked concentration levels of 4, 12, 18, 32 and 40 μg.mL−1 showed low values of %RSD (<1.47%) and very low values of the SEM (<0.27) for inter- and intra-day variations (Table 3) suggesting an excellent precision of the developed HPLC method.
Table 3.
Intra-day and inter-day precision of the proposed HPLC method (n = 3).
| Spiked concentration (μg/mL) | Repeatability (intra-day precision) |
Intermediate (inter-day precision) |
||||
|---|---|---|---|---|---|---|
| Measured concentration (μg/mL) ± SD | RSD (%) | SEM | Measured concentration (μg/mL) ± SD | RSD (%) | SEM | |
| 4 | 4.079 ± 0.054 | 1.330 | 0.031 | 4.1057 ± 0.048 | 1.184 | 0.028 |
| 12 | 12.009 ± 0.123 | 1.027 | 0.071 | 11.775 ± 0.156 | 1.329 | 0.090 |
| 18 | 18.055 ± 0.101 | 0.559 | 0.058 | 17.857 ± 0.244 | 1.369 | 0.144 |
| 32 | 31.865 ± 0.383 | 1.202 | 0.221 | 31.706 ± 0.467 | 1.476 | 0.270 |
| 40 | 40.281 ± 0.363 | 0.902 | 0.209 | 40.255 ± 0.342 | 0.851 | 0.197 |
3.1.4. Recovery studies
The accuracy of the assay method was evaluated in triplicate at four concentration levels 12, 18, 24 and 32 μg.mL−1, i.e. (0, 50, 100 and 150%). The percentage of recoveries, %RSD and SEM were calculated from the slope and y-intercept of the calibration curve obtained. The recovery values obtained were between the range of 99.91–100.42% (Table 4) confirming accuracy of the developed method.
Table 4.
Recovery as accuracy studies of the proposed HPLC method (n = 3).
| Percent (%) of drug added to analyte | Theoretical concentration (μg/mL) | Concentration found (μg/mL) ± SD | % RSD | SEM | % Recovery |
|---|---|---|---|---|---|
| 0 | 12 | 12.02 ± 0.119 | 0.995 | 0.069 | 100.16 |
| 50 | 18 | 17.98 ± 0.025 | 0.139 | 0.014 | 99.91 |
| 100 | 24 | 24.10 ± 0.019 | 0.081 | 0.011 | 100.43 |
| 150 | 32 | 31.98 ± 0.113 | 0.354 | 0.065 | 99.94 |
3.1.5. LOD and LOQ
The limit of detection and limit of quantification was calculated by the method as described in section (preparation of degradation products). The signal-to-noise ratios of 3.3:1 and 10:1 were considered as LOD and LOQ and were found to be 0.507 and 1.538 μg.mL−1, respectively, which indicated the adequate sensitivity of the method.
3.1.6. Robustness of the method
When mobile phase components were intentionally altered as much as ±2 mL each, practically no effect was observed in the chromatogram and no significant difference was observed in the area and retention time (Rt). There was a minor delay in the retention time when mobile phase flow rate was reduced to 0.8 mL.min−1. There was no significant difference in the retention time but a slight increase in the area of the chromatogram was observed when pH of the mobile phase was altered in order ±0.2 units. The low values of SD, %RSD and SEM along with almost unchanged Rt values of gatifloxacin obtained after introducing small deliberate changes as mentioned above in the method indicated the robustness of the developed HPLC method Table 5.
Table 5.
Robustness of the developed HPLC method (12 μg/mL, n = 3).
| Mobile phase composition (Disodiumhydrogen phosphate buffer:acetonitrile, pH = 3.3) | Mean area ± SD | % RSD | SEM | Retention time (Rt) ± SD | % RSD | SEM |
|---|---|---|---|---|---|---|
| (73:27, v/v) | 1,502,388 ± 17129.44 | 1.141 | 9889.976 | 2.799 ± 0.015 | 0.530 | 0.009 |
| (77:23, v/v) | 1,476,562 ± 15021.72 | 1.017 | 8673.048 | 2.743 ± 0.009 | 0.348 | 0.006 |
| Mobile phase flow rate | ||||||
| (1.2 mL/min) | 1,478,228 ± 9945.20 | 0.673 | 5742.033 | 2.706 ± 0.011 | 0.416 | 0.005 |
| (0.8 mL/min) | 1,494,895 ± 12146.76 | 0.812 | 7013.139 | 2.832 ± 0.043 | 1.547 | 0.025 |
| pH of mobile phase | ||||||
| (pH = 3.5) | 1,505,562 ± 12746.11 | 0.846 | 7359.179 | 2.769 ± 0.020 | 0.731 | 0.012 |
| (pH = 3.1) | 1,508,228 ± 11232.41 | 0.745 | 6485.250 | 2.783 ± 0.011 | 0.377 | 0.006 |
3.1.7. Selectivity and specificity
Forced degradation studies here may be considered as stability indicating property and their results indicating the selectivity and specificity of the developed method. The chromatograms of the samples treated with acid, base, H2O2, dry heat, and UV-light (254 nm), showed well-separated peaks of pure GTX as well as some additional peaks at different Rt-values. Degradants identification was based on the comparison of UV-spectra of “stressed samples” with that of the “standard solution”. Peaks of the degradation products were well resolved from the drug peak and the number of degradation products with their Rt values (Fig. 3). The number of degradation products with their Rt-values, content of GTX remaining, and calculated percentage recovery are listed in Table 6.
Figure 3.

Representative chromatograms of GTX after forced degradations: induced with 1 N HCl (a); with 1 N NaOH (b); with 30% H2O2 (c) with UV at 254 nm (d) and dry heat (e) (12 μg.mL−1). Conditions: RP-Supelco 516 C-18-DB, 50306-U, HPLC column (250 mm × 4.6 mm, 5 μm), mobile phase, Na2HPO4:MeCN (75:25, v/v); pH adjusted to 3.3 with orthophosphoric acid; flow rate, 1.0 mL.min−1; UV-detection of gatifloxacin at 293 nm at temperature (24 ± 2 °C).
Table 6.
Summary of forced degradation studies of gatifloxacin (GTX) (12 μg/mL).
| Exposure conditions | Time (h) | % GTX recovery | Degradation products (%) (± SD, n = 3) | Rt values for degradation products (min) |
|---|---|---|---|---|
| Acid, 1 N HCl, refluxed | 3 | 57.32 | DP1⁎ (8.11% ± 1.02), DP2⁎ (34.57% ± 8.19) | 4.40, 5.81 |
| Base, 1 N NaOH, refluxed | 3 | 78.21 | DP1⁎ (21.79% ± 6.58) | 4.54 |
| H2O2 (30%, v/v), refluxed | 3 | 96.15 | DP1⁎ (3.85% ± 4.89) | 4.39 |
| UV (254 nm) | 8 | 97.06 | DP1⁎ (2.94% ± 3.56) | 4.38 |
| Dry heat (80 °C) | 3 | 98.10 | Not detected | Not detected |
DP1 and DP2 are the degradation products obtained in the forced degradation studies as shown in Fig. 3a–e.
Drug recovery at the level of 57.32% and 78.21% from the acid- and base-stressed samples, respectively, suggests a significant degradation of the drug in acidic and basic conditions. The peaks of degradation products were well resolved from the drug peak. The chromatogram of the sample treated with 30% (v/v) H2O2 showed only one additional peak at Rt, 4.392 min. The area of the H2O2 degradation product peak was significant and accountable for 96.15% recovery of GTX from the H2O2-stressed sample. The chromatogram of the dry-heat stressed sample did not show the appearance of any additional peak of degradants but showed 98.10% recovery of GTX. Drug recovery at the levels of 97.06% for the UV-exposed sample, showed that the drug is unstable more toward the dry heat stressed degradation than UV-irradiation.
3.1.8. Stability indicating property of the developed method
The chromatograms of the acid degraded sample for gatifloxacin showed two additional peaks at Rt values of 4.4 and 5.8 min respectively (Fig. 3a). The chromatograms of the base degraded sample showed one additional peak at Rt value of 4.542 min (Fig. 3b). The areas of the base-degraded product peaks were found to be extremely small than the area of standard drug concentration (12 μg.mL−1) indicating that gatifloxacin undergoes mild degradation under basic conditions (1 N NaOH). Drug recovery at the level of 57.32% and 78.21% suggests significant degradation of gatifloxacin in acidic condition (1 N HCl) and basic condition (1 N NaOH) respectively.
The chromatogram of the sample of gatifloxacin treated with 30% (v/v) H2O2 showed only one additional peak at Rt = 4.392 min. other than the standard gatifloxacin peak at Rt = 2.775 min. (Fig. 3c). The area of the H2O2-degraded product peak was found to be extremely small than the area of standard drug concentration (12 μg.mL−1) and drug recovery at the level of 96.15% suggesting the stability of gatifloxacin toward the oxidation induced degradation.
The chromatogram of the sample exposed to UV-light at 254 nm showed one additional peak at Rt = 4.383 min other than the standard gatifloxacin peak at Rt = 2.783 min (Fig. 3d). Drug recovery at the level of 97.06%, indicated that the drug is stable toward the UV-radiations for the exposure period of 8 h under study. Under dry heat (80 °C) condition the drug did not show any additional peak other than the standard gatifloxacin peak at Rt = 2.817 min (Fig. 3e). Drug recovery at the level of 98.1%, suggested that the drug is stable toward dry heat for the exposure period of 3 h.
3.1.9. Kinetics investigation
The kinetics of degradation of gatifloxacin was investigated in 1 N HCl and 1 N NaOH. Each experiment was repeated three times at each temperature and time interval and mean concentration of gatifloxacin was calculated for each experiment. A regular decrease in the concentration of gatifloxacin with increasing time intervals was observed for higher temperatures. At the selected temperatures (40 °C, 50 °C, 60 °C, 70 °C and 80 °C for acidic and alkaline degradation) the degradation process followed first-order kinetics (Figs. 4 and 5). From the slopes of the straight lines it was possible to calculate apparent first order degradation rate constant (Kobs), half-life (t1/2), t90 (i.e. time where 90% of original concentration of the drug is left) and R2-values for pseudo first order plots at each temperature for acidic and alkaline degradation processes using the developed HPLC method are given in Table 7. Data obtained from first-order kinetics treatment were further subjected to fit in Arrhenius equation:
| (3) |
where, K is the rate constant, A the frequency factor, Ea the energy of activation (cal.mol−1), R the gas constant (1.987 cal.K−1 mol−1) and T is absolute temperature (Kelvin). Arrhenius plot shows the temperature dependence of the drug in the form of a natural logarithm of the rate coefficient versus the reciprocal temperature. An Arrhenius plot is extremely useful if data are determined experimentally. It also shows at a glance if the scatter of the data points is small or large; if there exists an Arrhenius relation at all (i.e. a straight line); and if there are enough data points to get unambiguous values for A and Ea. The plot of (2 + Log K) versus (1/T × 103) gave the Arrhenius plot (Fig. 6), which was found to be linear in the temperature range of 40–80 °C. The correlation coefficient for the line fittings was found to be 0.987 and 0.972, respectively, for acidic and basic degradation process. The activation energy (Ea) and the Arrhenius frequency factor (Ae) were calculated for acidic and alkaline degradation processes. The degradation rate constant of GTX in solutions at room temperature (K25) was obtained by extrapolating to 25 °C (where 1000/T = 3.356) by inserting this into Eq. (3) and t1/2 and t90 are calculated, respectively, the values are represented in Table 8.
Figure 4.

First-order plots for the degradation of gatifloxacin solution with 1 N HCl at various temperatures. 40 °C ( ); 50 °C (▪), 60 °C (▴), 70 °C (
 ), 80 °C (
 ).
).
Figure 5.

First-order plots for the degradation of gatifloxacin solution with 1 N NaOH at various temperatures. 40 °C (); 50 °C (▪), 60 °C ( ), 70 °C (●), 80 °C (
 ).
).
Table 7.
Degradation rate constant (Kobs), half-life (t1/2), t90 and R2 values for gatifloxacin in solution.
| Temperature (K) | Kobs (h−1) a | t1/2 (h)b | t90 (h)c | R2 for pseudo-first order plots |
|---|---|---|---|---|
| In 1 N HCl | ||||
| 313 (40 °C) | 0.126 | 5.49 | 0.83 | 0.9917 |
| 323 (50 °C) | 0.161 | 4.30 | 0.65 | 0.9989 |
| 333 (60 °C) | 0.203 | 3.42 | 0.52 | 0.9930 |
| 343 (70 °C) | 0.238 | 2.91 | 0.44 | 0.9986 |
| 353 (80 °C) | 0.330 | 2.11 | 0.32 | 0.9964 |
| In 1 N NaOH | ||||
| 313 (40 °C) | 0.081 | 8.55 | 1.30 | 0.9927 |
| 323 (50 °C) | 0.103 | 6.71 | 1.02 | 0.9921 |
| 333 (60 °C) | 0.124 | 5.62 | 0.85 | 0.9938 |
| 343 (70 °C) | 0.140 | 4.93 | 0.75 | 0.9987 |
| 353 (80 °C) | 0.151 | 4.58 | 0.70 | 0.9971 |
Degradation rate constant.
Half-life.
Time for 90% potency left.
Figure 6.

Arrhenius plot for the degradation of gatifloxacin solution in presence of 1 N HCl (♦) and 1 N NaOH (■).
Table 8.
Summary of degradation kinetics of gatifloxacin in solution at 25 °C (298 K).
| Parameters | 1 N HCl | 1 N NaOH |
|---|---|---|
| Ea (kcal mol−1)a | 1.363 × 10⁻³ | 1.024 × 10⁻³ |
| K25 (h−1)b | 8.265 × 10⁻² | 6.414 × 10⁻² |
| t1/2 (h)c | 8.3846 | 10.8041 |
| t90 (h)d | 1.2728 | 1.6401 |
| Ae | 1.0564 | 0.3618 |
Activation energy.
Degradation rate constant.
Half-life.
Time for 90% potency left.
Arrhenius frequency factor.
3.2. Application of the developed method
3.2.1. Analysis of GTX in tablets, eye drops and SLNs
A single peak was observed in the chromatogram of gatifloxacin samples extracted from tablets, eye drops and prepared solid lipid nanoparticles. There was no interference from the excipients present in the tablets, eye drops and SLNs. The drug content (%) with %RSD and SEM of all the tested samples are given in Table 9. It may, therefore, be inferred that degradation of gatifloxacin had not occurred in the formulations that were analyzed by this method. The low %RSD value indicated the suitability of this method for routine analysis of gatifloxacin in conventional and novel drug delivery systems.
Table 9.
Detailed analysis report of GTX in tablets, eye drops and solid lipid nanoparticles (SLNs).
| Samples | Theoretical concentration (μg/mL) | Concentration found (μg/mL) ± SD | % RSD | SEM | Drug content (%) | Retention (Rt) min |
|---|---|---|---|---|---|---|
| TAB 1 | 12.0 | 11.97 ± 0.076 | 0.637 | 0.044 | 99.77 | 2.758 |
| TAB 2 | 12.0 | 12.02 ± 0.025 | 0.209 | 0.015 | 100.19 | 2.733 |
| ED 1 | 12.0 | 12.01 ± 0.026 | 0.220 | 0.015 | 100.08 | 2.742 |
| ED 2 | 12.0 | 12.00 ± 0.040 | 0.337 | 0.023 | 99.97 | 2.767 |
| SLN-A | 12.0 | 11.98 ± 0.025 | 0.211 | 0.014 | 99.81 | 2.817 |
| SLN-B | 12.0 | 12.04 ± 0.015 | 0.126 | 0.009 | 100.36 | 2.775 |
| SLN-C | 12.0 | 12.03 ± 0.031 | 0.254 | 0.018 | 100.22 | 2.767 |
| SLN-D | 12.0 | 11.99 ± 0.026 | 0.221 | 0.015 | 99.92 | 2.767 |
3.2.2. Analysis of accelerated stability
The method of accelerated testing of pharmaceutical products based on the principle of chemical kinetics, which could be used as a measure of stability of the drug under the stressed conditions. Stability testing of the drug product after constitution, should be conducted to provide information for the labeling on the product, storage condition, and in-use period of the constituted product. In general, a drug product should be evaluated under storage conditions that test its thermal stability and some times, its sensitivity to moisture or loss of solvent. Here the accelerated study was performed to calculate the shelf life of the drug products. At temperatures 40 °C, 50 °C, 60 °C, 70 °C and 80 °C the process of drug degradation followed first-order kinetics (Fig. 7A-Fig. 7C). From the slopes of the straight lines the apparent first order degradation rate constant (Kobs), half-life (t1/2), t90 and R2-values for first order plots at each temperature point were calculated and results are presented in Table 10. The obtained data from first-order kinetics, were fitted in the Arrhenius equation as mentioned above. The plots of Log K versus (1/T × 103) K, was linear in the temperature range of 40–80 °C (Fig. 7D). The correlation coefficient for the line fittings was found to be 0.9994, 0.9979 and 0.9984 for TAB-1, ED-1 and SLN-B respectively, for the decay process. The decay rate constant at room temperature (K25) is obtained by extrapolating to 25 °C (where 1000/T = 3.356 K) by inserting this into Eq. (3) as mentioned above also t1/2 and t90 were calculated and values are presented in Table 10.
Figure 7.

First-order plots for the degradation of gatifloxacin from different dosage forms: TAB-1 (A), ED-1 (B) and SLN-B (C) at temperature ranges of 40–80 °C. Arrhenius plots for gatifloxacin degradation from different dosage forms (D).
Table 10.
Summary of degradation kinetics of drug product at 25 °C (298 K).
| Parameters | Formulations |
||
|---|---|---|---|
| TAB-1 | ED-1 | SLN-B | |
| K25 (day−1)a | 2.91 × 10⁻³ | 4.52 × 10⁻³ | 3.82 × 10⁻³ |
| t1/2 (years)b | 5.355 | 4.092 | 4.785 |
| t90 (years)c | 0.652 | 0.419 | 0.497 |
Degradation rate constant.
Half-life.
Time for 90% potency left.
4. Conclusion
The developed method was validated in terms of accuracy, precision and robustness. A good linear relationship was observed for GTX in the concentration ranges of 4–40 μg.mL−1. The correlation coefficient was found to be 0.9998. The inter-day and intra-day precision results were good enough to indicate that the proposed method was precise and reproducible. Preparation of samples was easy and efficient. UV detection at 293 nm was found to be suitable. The assay experiment showed that the contents of gatifloxacin estimated in the tablet dosage form, eye drops and SLN were free from the interference of excipients. This demonstrated that the developed HPLC method was simple, fast as evidenced by short retention time, precise, accurate, sensitive and efficient and could be conveniently adopted for the routine quality control analysis of gatifloxacin from its pharmaceutical dosage forms and bulk drug. The results of forced degradation studies imply that the developed method is stability indicating.
Acknowledgments
The authors are also thankful to the College of Pharmacy Research Center and the Deanship of Scientific Research at King Saud University for logistic and financial assistance and to Wockhardt Pharmaceutical Ltd., Aurangabad, Maharashtra, India, for supplying free samples of gatifloxacin.
Footnotes
Peer review under responsibility of King Saud University.

References
- Amin A.S., Gouda A.A.F., El-Sheikh R., Faten-Zahran F. Spectrophotometric determination of gatifloxacin in pure form and in pharmaceutical formulation. Spectrochim. Acta Part A. 2007;67:1306–1312. doi: 10.1016/j.saa.2006.09.041. [DOI] [PubMed] [Google Scholar]
- Arteseros A.H., Barbosa J., Compano R. Analysis of quinolone residues in edible animal products. J. Chromatogr. A. 2002;945:1–24. doi: 10.1016/s0021-9673(01)01505-9. [DOI] [PubMed] [Google Scholar]
- Belal F., Al-Majed A.A., Al-Obaid A.M. Methods of analysis of 4-quinolone antibacterials. Talanta. 1999;50:765–786. doi: 10.1016/s0039-9140(99)00139-3. [DOI] [PubMed] [Google Scholar]
- Flurer C.L. Analysis of antibiotics by capillary electrophoresis. Electrophoresis. 1997;18:2427–2437. doi: 10.1002/elps.1150181233. [DOI] [PubMed] [Google Scholar]
- Fukuda H., Hiramatsu K. Primary targets of fluoroquinolones in Streptococcus pneumoniae. Antimicrob. Agents Chemother. 1999;43:410–412. doi: 10.1128/aac.43.2.410. [DOI] [PMC free article] [PubMed] [Google Scholar]
- Gouda A.A.F., El-Sheikh R., Amin A.S. Utility of some π-acceptors for spectrophotometric determination of gatifloxacin in pure form and in pharmaceutical preparations. Chem. Pharm. Bull. 2008;56:34–40. doi: 10.1248/cpb.56.34. [DOI] [PubMed] [Google Scholar]
- Joshi S. HPLC separation of antibiotics present in formulated and unformulated samples. J. Pharm. Biomed. Anal. 2002;28:795–809. doi: 10.1016/s0731-7085(01)00706-3. [DOI] [PubMed] [Google Scholar]
- Mathews B.R., Wall G.M. Stability storage and testing of ophthalmic products for global registration. Drug Dev. Ind. Pharm. 2000;26:1227–1237. doi: 10.1081/ddc-100102304. [DOI] [PubMed] [Google Scholar]
- Mirza S., Rabindra N., Hassan D.M., Huda N., Shaikh F. Simultaneous determination of gatifloxacin and ambroxol hydrochloride from tablet dosage form using reversed phase high performance liquid chromatography. Chin. J. Chromatogr. 2008;26:358–361. doi: 10.1016/s1872-2059(08)60021-8. [DOI] [PubMed] [Google Scholar]
- Motwani S.K., Khar R.K., Ahmad F.J., Chopra S., Kohli K., Talegaonkar S., Iqbal Z. Stability indicating high-performance thin-layer chromatographic determination of gatifloxacin as bulk drug and from polymeric nanoparticles. Anal. Chim. Acta. 2006;576:253–260. doi: 10.1016/j.aca.2006.06.032. [DOI] [PubMed] [Google Scholar]
- Nguyen H.A., Grellet J., Ba B.B., Quentin C., Saux M. Simultaneous determination of levofloxacin, gatifloxacin and moxifloxacin in serum by liquid chromatography with column switching. J. Chromatogr. B. 2004;810:77–83. doi: 10.1016/j.jchromb.2004.07.019. [DOI] [PubMed] [Google Scholar]
- Samanidou V.F., Demetriou C.E., Papadoyannis I.N. Direct determination of four from fluoroquinolones, enoxacin, norfloxacin, ofloxacin and ciprofloxacin in pharmaceuticals and blood serum by HPLC. Anal. Bioanal. Chem. 2003;375:623–629. doi: 10.1007/s00216-003-1749-9. [DOI] [PubMed] [Google Scholar]
- Tasso L., Costa T.D. High performance liquid chromatography for quantification of gatifloxacin in rat plasma following automated on-line solid phase extraction. J. Pharm. Biomed. Anal. 2007;44:205–210. doi: 10.1016/j.jpba.2007.02.026. [DOI] [PubMed] [Google Scholar]
- United States Pharmacopoeia 30th ed/ National Formulary, 25th ed. United States Pharmacopeial Convention, Rockville, MD-2007.