

Abstract
Determination of tumor volume in subcutaneously inoculated xenograft models is a standard procedure for clinical and preclinical evaluation of tumor response to treatment. Practitioners frequently use a hands-on caliper method in conjunction with a simplified formula to assess tumor volume. Non-invasive and more precise techniques as investigation by MR or (μ)CT exist but come with various adverse effects in terms of radiation, complex setup or elevated cost of investigations. Therefore, we propose an advanced three-dimensional sonographic imaging technique to determine small tumor volumes in xenografts with high precision and minimized observer variability. We present a study on xenograft carcinoma tumors from which volumes and shapes were calculated with the standard caliper method as well as with a clinically available three-dimensional ultrasound scanner and subsequent processing software. Statistical analysis reveals the suitability of this non-invasive approach for the purpose of a quick and precise calculation of tumor volume in small rodents.
Introduction
For a couple of years and despite most recent advances in tumor research, still the display of tumor growth as a clinically and pre-clinically relevant factor for prognosis and development of a cancerous diseases remains important. A decrease or increase in tumor size is in most cases directly linked to a response or non-response to tumor treatment [1].
Conventionally, growth of solid tumors is followed under various conditions, e.g. different treatment regimes, and then assessed by regularly tracking increase in volume of the xenografts that are initially created by subcutaneously injecting tumor cells in immune-deficient small rodents like mice. However, the methods for volume measurement used by practitioners is involving a mere mechanical in vivo caliper measurement of length and width directly on anaesthetized tumor-bearing mice, and a subsequent calculation of an approximate tumor volume with a formula derived from Geran et al. [2]. This widely used equation is an altered version of the calculation used for determination of an ellipsoid volume: π/6 w(idth) d(epth) l(ength) and, assuming the depth to be approximately the same as the width, it becomes π/6 w w l or π/6 (short axis) (short axis) (long axis).
The main disadvantage of this method evidently becomes clear: it is imprecise because tumors, especially human xenograft lines transplanted and grown in mice, often undergo shape changes that considerably deviate from an ellipsoid volume. Additionally, the measurement overestimates tumor size because the uppermost skin layers (dermis and epidermis) above the tumor hull are not taken into consideration. Furthermore, the method of measuring with calipers in the sub-millimeter range on tumors which tend to perform evasive subcutaneous movements is also highly influenced by intra-observer variabilities.
In contrast to the study of Ayers et al. [3] our method does not necessarily require the excision of the tumors to determine the tumor volume. Furthermore, there have been a number of studies trying to circumvent this problem by using ultrasound in a 2D-segmentational analysis as a non-invasive tool to determine exact tumor volume [4]. Many of these investigations focused on clinical questions, regarding e.g. the high frequency sonographic imaging of small animals for pathogenesis and embryonic development of mice [5], [6]. Also, two dimensional imaging modalities as ultrasound bio-microscopy (UBM) and scanning acoustic microscopy (SAM) have been used to investigate tumors in a non-invasive fashion [4], [7]. Earlier studies shed light on the suitability of ultrasound in quantifying tumor volume, first on phantom models in 3D ultrasound compared with a 2D ultrasound approach [8]. As the technique progressed, 3D ultrasound became more widely used, as in a clinical setting on small metastatic nodular tumor entities [9] or as a common tool to visualize organs in different orientations [10]. However, none of these so far used the possibilities which 3D-ultrasound combined with speckle tracking has to offer. Not only is it possible to generate a complete three-dimensional rendering of the tumor, but the integrated software with a speckle tracking detection and wall motion tracking algorithm makes precise volume determination possible. At a sonographic frequency of 2.5 MHz or higher, the approximate wavelength of 0.4 to 0.6 mm is sufficient for imaging the typical tumor dimensions of larger subcutaneous and hypertensed tumors in the range of 4 to 6 cm length. Due to the attenuation not being directly proportional to fourth power of frequency like in solid materials [11], but rather it being in the range of f^1 to f^2 [12], the low frequency of 2.5 to 4 MHz used here does still not suffer significantly from the typical wave attenuation in soft tissues. High frequency approaches (e.g. UBM and SAM performed between 5 to 30 MHz, or higher) are thus limited in the depth of penetration of the ultrasonic waves.
In the present study we propose a 3D sonographical approach at 4 MHz to determine exact tumor volume, without employing microbubbles or similar binding-agent techniques on 11 vulva-carcinoma A431 tumors. Accuracy and results of this method are hence compared to the results of conventional caliper measurements as well as to the procedure of determining volume by weighing with general tissue density assumptions. The latter one can be considered as the gold standard method, as displayed in Ayers et al. [3]. We show that the ultrasound method used is suitable for ex vivo transplants and yields highly reliable tumor volume representations, considering our technology as applicable for in vivo measurements as well. This data, in turn, can be used in non-invasive ultrasound studies on biomechanical parameters such as TIFP to facilitate data processing and visualize even small changes in tumor volume due to the release or increase of internal tumor pressure.
Materials and Methods
Cell Culture
Vulva-carcinoma derived epithelial A431 cells were cultured in low-glucose DMEM medium with 10 % FCS (fetal calf serum) and 1% PS (penicilline/streptomycine) at 37°C under 5% CO2 atmosphere. When a cell density of 1 × 10⁷ cells per flask was reached, cells were harvested and diluted in PBS (phosphate-buffered saline) solution for tumor cell inoculation.
Animal Experiments
5 × 10⁶ cells were subcutaneously injected into both flanks of six to eight weeks old immune-compromised female NMRI (Naval Medical Research Institute) nu/nu mice. Food and water were given ad libitum. In total, 12 mice were used and 18 tumors were assessed in the different experiments. In some animals only one tumor was used for measurements due to increased growth compared to the second implanted tumor. Caliper measurements of tumor length and width were performed at three-day intervals with Vernier calipers (digital 6”/150 mm steel calipers with 0.01 mm resolution; Neiko Tools, USA)(Supplementary Table 1). Mice were anaesthetized with Isoflurane® (Abbott GmbH, Wiesbaden, Germany; 2% vaporized in oxygen). Tumors were grown for 14 to 21 days depending on the growth rate of individual tumors but not exceeding 20% of total bodyweights of the animals. Mice were sacrificed with tumors left in place for immediate in vivo ultrasonic investigation and later carefully excised for ex vivo ultrasonic investigation. All animal experiments were conducted and approved in accordance with the German animal welfare regulations (Regierungspräsidium Darmstadt, F79/47).
Ultrasonic Investigation
For ex vivo ultrasonic investigation, all tumors were placed in a water bath (Aqua dest.) at 25°C. Three-dimensional ultrasonic measurements were conducted using a commercial 3D sonographic instrument (ARTIDA Systems) developed by Toshiba Medical Systems Company (Tochigi, Japan). The probe was installed in a stand-off device during data acquisition (Suppl. Figure 1). Ex vivo image acquisition were performed using 3D transducers at 4 MHz center frequency. The high resolution images (DICOM format) were acquired by dividing the tumor into six virtual segments at 1 Hz time synchronization frequency with a line density of the synchronized segmentation at 3000 sampling points. The frame numbers were optimized at 12 frames/second because, as the tumors were static, the lower resolution in time leads to a higher spatial resolution. As the acoustic impedance mismatch between water and tumor results in a pronounced gray scale contrast along the boundaries, this threshold contrast could be used to detect them along the coupling fluid/tissue interface.
Signal Analysis and 3D Data Processing
To generate 3D representations of the tumors, speckle tracking and a 3D wall motion tracking (3D-WMT) algorithm with an output of 36 × 36 data points in radial and longitudinal directions was implemented. The speckle density was determined in 1 cm3 blocks and an 8-node block matching speckle tracking algorithm was used with an image resolution of 0.43 mm/pixel. The algorithm was implemented on two mutually orthogonal sections of the tumor and three longitudinal sections as shown exemplarily for the in situ situation of an A431 tumor in Supplementary Figure 2.
It generates three dimensional Cartesian coordinates along the geometry of the tumor which can be visualized in a standard ultrasonic contrast image (Figure 1A) as well as in a “plastic bag” wireframe display (Figure 1B), which are also suited for a subsequent import in MATLAB (MathWorks, R2012a) software. The visualization facilitates rendering in space and the evaluation of tumor inhomogeneity. The final volume of the tumor was calculated by product of the cross section area of the radial slices and the thickness of the corresponding longitudinal section.
Figure 1.
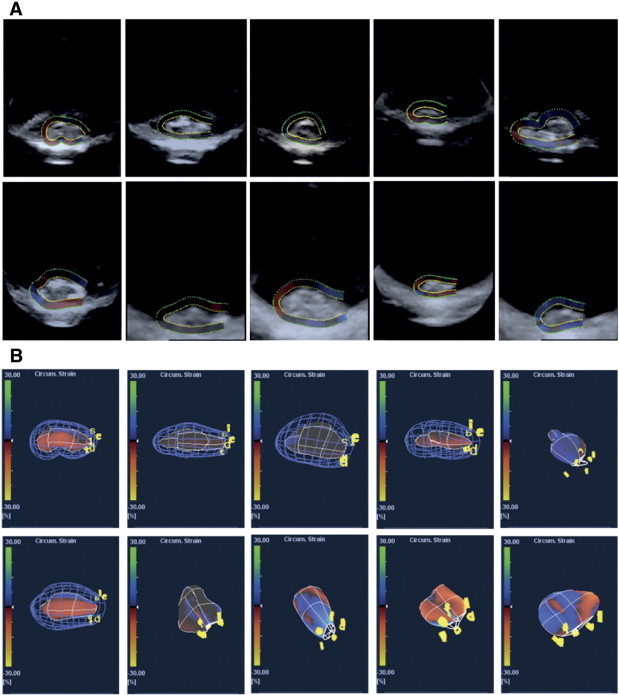
Tumor imaging utilizing the 4 MHz ultrasound ARTIDA scanning system. A) Volumetric representations of ten experimental A431 tumors. B) Stress load mesh volumes (“plasticbag” wireframe) of ten experimental A431 tumors.
Statistical Analysis
Statistics were performed with one- and two-way ANOVA standard tests for analysis of significance. Confidence levels were chosen at 95% confidence-interval.
Results
Tumor Volume Determination Using a Speckle Tracking Algorithm
The main purpose of this work was to investigate how accurate 3D-ultrasound with a new speckle tracking algorithm can obtain reasonable tumor volume estimates in comparison to the standard technique conventionally based on caliper measurements and volume calculation with the formula derived from Geran et al. [2]. For ten exemplary tumors in our studies, the live B-Mode grey image acquisition window in x-y plane direction is shown in Figure 1A, including the superimposed semi-automatic outline path which marks individual tumor boundaries. The dotted, innermost signal line, colored in yellow, was taken to indicate and interpolate the most probable boundary between tumor tissue and signal reflections from the surroundings. Density from tissue (tumor and microenvironment) makes for the main grey value contrast whereas backscattering of the signal at the bottom of the plane and the tumor/plane interfaces creates noise distortions, as can be seen in the sagittal cut portions of the display. In cases where the loop path ends could not be fully closed at one tip of the tumor, the remaining path was interpolated automatically with minimized error. The resulting volumetric representations for the exact same 10 experimental tumors, including a hypothetical estimate on potential circumferential strain loads, are shown in a so-called “plastic bag” simulation (Figure 1B). The potential strain loads, assumed automatically by the software, can be neglected in all cases, as we did not load the tissues with any prestress. Interestingly, a wide variety of tumor hull geometries can be identified in an otherwise homogenous set of these subcutaneous samples of A431-tumors.
Volume Measurements for Tumors are Established and Compared
In order to corroborate the differences we expected to find between the two methods—tumor volume acquisition by ultrasound compared to tumor volume estimation by calipers—a reference (gold standard) method had to be employed to determine an assumed true tumor volume. The true tumor volume was calculated according to the established method by Ayers et al. [3] by determining tumor weight and calculating volume with a known or expected tissue density according to:
The average value for tissue density assumed with our calculations was ρ = 0.85 g/cm3, and assumed from the literature as given in [13], it was ρ = 1 g/cm3, resulting in tumor volumes Vw or VL, respectively. Table 1 shows the results for tumor volume measurements on seven A431 tumors, indicating next to both gold standard volumes (Vw, VL) the caliper/formula derived volume VE and the ARTIDA-calculated volume VA for each individual tumor.
Table 1.
Volume measurement on a subset of seven A431 tumors
Table indicating tumor volumes obtained by a) calculation from fresh weight with weight-derived density estimation (VW) and density estimation with literature value (VL) (Gold standards VW and VL) b) ellipsoid formula/caliper determination (VE) and c) estimation by ARTIDA-speckle tracking algorithm at 4 MHz (VA)
| Code | Origin, treatment | Volume [mm3] VW | Volume [mm3] VL | Volume [mm3] VE | Volume [mm3] VA |
|---|---|---|---|---|---|
| Tumor 1 | A431, none | 875.9 | 743.6 | 811.9 | 690 |
| Tumor 2 | A431, none | 847.0 | 719.1 | 704.6 | 720 |
| Tumor 3 | A431, none | 657.2 | 558.0 | 405.5 | 650 |
| Tumor 4 | A431, none | 470.0 | 399.0 | 481.2 | 180 |
| Tumor 5 | A431, none | 351.4 | 291.4 | 388.0 | 340 |
| Tumor 6 | A431, none | 801.1 | 680.1 | 2012.6 | 910 |
| Tumor 7 | A431, none | 1073.3 | 911.2 | 1468.7 | 1250 |
TIFP Pressure Values Correlate in Part with Tumor Volumes
An intrinsic phenomenon on most solid tumors, generated by the chaotic nature of their blood vessel supply and dysfunctional lymph drainage in the tumor, is an elevated tumor interstitial fluid pressure (TIFP). It can account for upholding a large portion of the final tumor volume and shape. Supplementary Figure 3 shows TIFP values measured via the wick-in-needle technique in relation to respective (ARTIDA calculated) tumor volumes for a larger set of A431 tumors, reaching volumes up to 3300 mm3 and TIFP values up to 11 mmHg. Measurements were performed as described previously [1]. Though, a strictly linear correlation between fluid pressure and tumor volume cannot be identified, a general increase of interstitial fluid pressure with a rising volume can be reasonably assumed and observed for most cases. A lot of data points tend to accumulate around certain volume/TIFP values, such as seen here between volume values around V = 800 to 1200 mm3 and TIFP values around 4 to 5 mm Hg.
Tumor Volumes Are More Accurately Assessed by Ultrasound/ARTIDA Than by Caliper/Formula
Tumor volumes have been calculated for all A431 tumors by the conventional caliper/formula method and by ultrasound with the ARTIDA system. Comparing ARTIDA-calculated tumor volumes to the volumes derived from the caliper/ellipsoid formula calculations and referenced to the gold standard volume determination method (with literature density values), as it is shown in Figure 2A. The difference of VA volumes to the true tumor volume VL is considerably smaller than the significant difference of VE to VL volumes. Moreover, the same observation is made in the case when we use the other estimation for tumor tissue density from our own calculations as the true tumor volume (Vw), as displayed in Figure 2B. Though the differences between VA and VE are smaller than in Figure 2A, still it can be considered that ARTIDA-calculated volumes VA are closer to the true tumor volume VW than the ellipsoid/caliper-calculated volumes VE. Additionally, a Bland-Altman plot reveals differences in volume estimations for both methods around the range of 1 SD (1 SD = 396 mm3), and accumulating around the distribution of tumor volumes between 350 and 750 mm3 (Figure 2C). Similar differences between the two methods are revealed by the corresponding correlation curve to the Bland-Altman plot (Figure 2D). The resulting linearly fitted correlation curve considerably deviates from the hypothetical normal 45°-angled correlation curve for the case of ideal fit.
Figure 2.
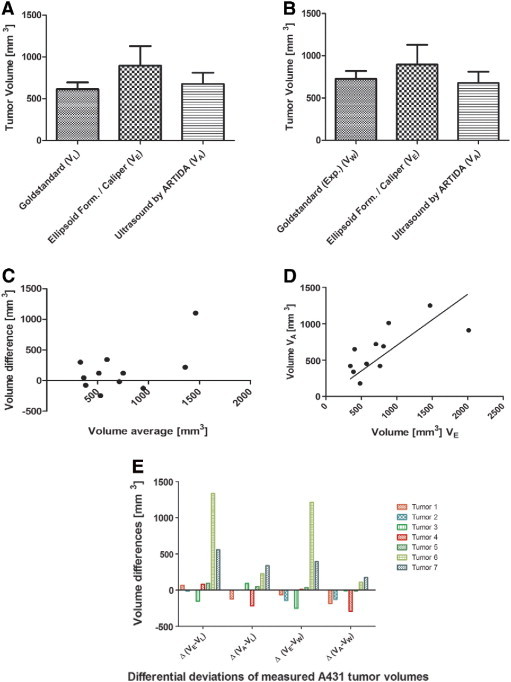
Comparison of volume calculation via gold standard with ARTIDA and caliper method. A) Artida (VA) and Caliper (VE) measurements are compared to the gold standard volume determination method (VL). B) Artida (VA) and Caliper (VE) measurements are compared to the second gold standard volume determination method (VW). C) Bland-Altman plot of tumor volume difference calculations by two different methods. D) Correlation plot of tumor volume difference calculations by two different methods. E) Deviations of tumor volume measurements for individual tumors. Green bars indicate Artida measurement proves superior over the caliper/formula method. Red bars indicate caliper/formula measurement is superior over the Artida method. *P = .05.
These findings are clarified furthermore by displaying the extent and the direction of the differences of tumor volume calculations by the two methods, individually for each tumor displayed in Table 1 (Figure 2E). Figure 2E shows, that independent of the direction of the estimation (positive range meaning overestimation, negative range meaning underestimation), in five out of seven cases the ultrasound method proves superior over the caliper/formula method. This is true for both kinds of density estimations on the reference method, when looking at the left half or right half of the figure separately. Especially in the case of large tumor volume differences, e.g. for tumor 6, the ultrasound method produces better estimates.
Discussion
One of the most important predictors for clinical and preclinical treatment outcome and an experimentally, on first glance, “easy-to-follow” aspect in tumor biology is the speed of tumor growth and the associated tumor volume increase. In many solid tumors, this increase in volume is not only attributed to an increase in tissue “material” on a cellular level, but also to an elevated tumor interstitial fluid pressure (TIFP) [1], [14], [15], [16], [17]. The TIFP is also partly responsible for creating the tension upholding the individual tumor shape, which in “ideal” case is a spherical/ellipsoid form.
Tumor volume studies have had a big impact on clinical as well as preclinical studies, because influences of tumor treatment are directly associated with tumor volume changes and can be easily followed in animal experiments. Volume measurement methods used by practitioners working with tumor-bearing mice though often lack the desired precision, as they are conducted by using steel or electronic calipers. The tumor volume is then calculated with the standard ellipsoid formula π/6 w(idth) d(epth) l(ength). Moreover, this method lacks reproducibility which is tried to overcome by repeated measurements and use of mean values for these measurements. One additional disadvantage of the hands-on procedure is not only its dependency on the user skills (the same holds true for the use of UBM on-screen-calipers, as shown by Cheung et al. [4], but as well the impossibility for repeated measurements after the specimen are no longer available, as there is no “raw” dataset to store.
In the presented work we tried to evaluate the usefulness and accuracy of modern, 3D ultrasound imaging including a speckle tracking algorithm software to track tumor outline borders and segmentationally reconstruct 3D tumor volumes. To account for a wide variability of samples, A431 tumors with varying growth time and resulting differences in end volume were chosen. The 3D-ultrasound method was finally compared to the conventional caliper method pertaining to the amount of possible deviations in our ex-vivo measurements, using two different types of reference volume estimations as gold standards.
The data we present in this study with subcutaneously grown tumor xenografts shows only a mediocre correlation between the caliper-and-formula calculated tumor volumes and the data generated by ultrasound, as demonstrated by a statistical correlation value of only r = 0.5. However, when comparing both methods directly, the plots also reveal a strong overestimation of tumor volumes by the conventional method, prominently seen in tumors with higher end volume. A possible reason for these findings is that when measuring with calipers, either tumor hull, and/or especially with in-situ measurements on (nude) mice, the thickness of the dermal and subdermal skin tissue layers have to be taken into account. As these layers are slightly movable against each other and also add up in the three orthogonal planes of measurement, it becomes evident that they account for a major overestimation error of real tumor volume. For early developing xenografts, these findings are corroborated by the experimental studies of Cheung et al. [4]. For more irregular tumor shapes, which commonly appear in a large part of tumor inoculation experiments, we expect this problem to be even more pronounced.
Tumor volume estimation via 3D-ultrasound seems to generate far more accurate results than the conventional method which is prone to intra-observer variability. The differences to the widespread conventional caliper method are pronounced even for the majority of tumors which do not exceed the end volume of 900 mm3 and more. In cases of higher tumor end volume, the ultrasound method seems to work even better, as the cases of tumor 6 and 7 show in exemplary fashion (Figure 2E). Of course, studies of these kinds find their limitations in the high heterogeneity in tumor end volumes even when generated from the same initial amount of cells and from the same tumor entity in a controlled set of mice.
There were various attempts to non-invasively quantify tumor volume of subcutaneously grown tumors in small animals before, one of them being the use of mesoscopic epi-fluorescence tomography and epi-illumination reflectance imaging, as recently shown by Abou-Elkacem et al. [18]. However, these methods make use of specific fluorescence labeling and require injection of green/red fluorescent substances into the tumor tissue.
In conclusion we identified that three-dimensional sonographic imaging, as carried out in this study in conjunction with a speckle tracking algorithm, is a suited technology to non-invasively assess tumor volume in subcutaneous tumors. Moreover, it was shown that this technology produces more reliable tumor volume estimates in a certain variety of tumor types and volume ranges than conventional techniques. The technology is relatively easy to handle (hazard-free) and requires only standard medical-type of ultrasound transducers, which might open access of 3D-ultrasound from daily patient-oriented medical scenarios to encompass a wider preclinical and research use.
The following are the supplementary data related to this article.
Caliper measurements of A431 tumor xenograft length (l) and width (w) over the total experimental tumor growth time. Missing values indicate an earlier endpoint of the respective experiment due to ethical regulations of animal care (tumor burden).
Experimental setup for ARTIDA volume measurements on an excised A431 tumor. An adjustable standoff for the fixation of the medical type low frequency transducers was used.
Screen-captured live ARTIDA speckle tracking on in-situ subcutaneous A431 tumor including three planar (x,y,z), M-mode/top-down mode windows as well as the ECG gated signal window.
Tumor interstitial fluid pressure is rising with the increase of tumor volume in A431 tumors
Acknowledgment
R. Pflanzer and M. Hofmann contributed equally to this work. This research was supported by the LOEWE PräBionik network of the state of Hesse (to RP, MH, AS, AH, WD, TSR, RS, BH).
References
- 1.Hofmann M., Guschel M., Bernd A., Bereiter-Hahn J., Kaufmann R., Tandi C., Wiig H., Kippenberger S. Lowering of tumor interstitial fluid pressure reduces tumor cell proliferation in a xenograft tumor model. Neoplasia. 2006;8:89–95. doi: 10.1593/neo.05469. [DOI] [PMC free article] [PubMed] [Google Scholar]
- 2.Geran R.I., Greenberg N.H., Macdonald M.M., Schumacher A.M., Abbott B.J. Protocols for screening chemical agents and natural products against animal tumors and other biological systems. Cancer Chemother Rep. 1972;3:1–103. [Google Scholar]
- 3.Ayers G.D., McKinley E.T., Zhao P., Fritz J.M., Metry R.E., Deal B.C., Adlerz K.M., Coffey R.J., Manning H.C. Volume of preclinical xenograft tumors is more accurately assessed by ultrasound imaging than manual caliper measurements. J Ultrasound Med. 2010;29:891–901. doi: 10.7863/jum.2010.29.6.891. [DOI] [PMC free article] [PubMed] [Google Scholar]
- 4.Cheung A.M., Brown A.S., Hastie L.A., Cucevic V., Roy M., Lacefield J.C., Fenster A., Foster F.S. Three-dimensional ultrasound biomicroscopy for xenograft growth analysis. Ultrasound Med Biol. 2005;31:865–870. doi: 10.1016/j.ultrasmedbio.2005.03.003. [DOI] [PubMed] [Google Scholar]
- 5.Foster F.S., Zhang M.Y., Zhou Y.Q., Liu G., Mehi J., Cherin E., Harasiewicz K.A., Starkoski B.G., Zan L., Knapik D.A. A new ultrasound instrument for in vivo microimaging of mice. Ultrasound Med Biol. 2002;28:1165–1172. doi: 10.1016/s0301-5629(02)00567-7. [DOI] [PubMed] [Google Scholar]
- 6.Goertz D.E., Yu J.L., Kerbel R.S., Burns P.N., Foster F.S. High-frequency Doppler ultrasound monitors the effects of antivascular therapy on tumor blood flow. Cancer Res. 2002;62(22):6371–6375. [PubMed] [Google Scholar]
- 7.Pflanzer R., Shelke A., Bereiter-Hahn J., Hofmann M. Ultrasonic quantification of tumor interstitial fluid pressure through scanning acoustic microscopy. In: Nowicki A., Litniewski J., Kujawska T., editors. Acoustical imaging 31. Springer; Berlin, Germany: 2012. pp. 291–299. [Google Scholar]
- 8.Riccabona M., Nelson T.R., Pretorius D.H. Three-dimensional ultrasound: accuracy of distance and volume measurements. Ultrasound Obstet Gynecol. 1996;7:429–434. doi: 10.1046/j.1469-0705.1996.07060429.x. [DOI] [PubMed] [Google Scholar]
- 9.Kim H.C., Han M.H., Do K.H., Kim K.H., Choi H.J., Kim A.Y., Sung M.W., Chang K.H. Volume of cervical lymph nodes using 3D ultrasonography. Differentiation of metastatic from reactive lymphadenopathy in primary head and neck malignancy. Acta Radiol. 2002;43:571–574. doi: 10.1080/j.1600-0455.2002.430606.x. [DOI] [PubMed] [Google Scholar]
- 10.Fenster A., Downey D.B. Three-dimensional ultrasound imaging. Annu Rev Biomed Eng. 2000;2:457–475. doi: 10.1146/annurev.bioeng.2.1.457. [DOI] [PubMed] [Google Scholar]
- 11.Mason W.P., McSkimin H.J. Attenuation and scattering of high frequency sound waves in metals and glasses. J Acoust Soc Am. 1947;19:464–473. [Google Scholar]
- 12.Cooper T.E., Trezek G.J. A probe technique for determining the thermal conductivity of tissue. J Heat Transfer. 1972;94:133–140. [Google Scholar]
- 13.Salomonsson G., Björkman L. Investigation of methods to estimate ultrasonic attenuation of soft tissue. IEEE Trans Biomed Eng. 1985;32:583–591. doi: 10.1109/TBME.1985.325597. [DOI] [PubMed] [Google Scholar]
- 14.Jain R.K. Delivery of novel therapeutic agents in tumors: physiological barriers and strategies. J Natl Cancer Inst. 1989;81:570–576. doi: 10.1093/jnci/81.8.570. [DOI] [PubMed] [Google Scholar]
- 15.Heldin C.H., Rubin K., Pietras K., Ostman A. High interstitial fluid pressure – an obstacle in cancer therapy. Nat Rev Cancer. 2004;4:806–813. doi: 10.1038/nrc1456. [DOI] [PubMed] [Google Scholar]
- 16.Hofmann M., Schultz M., Bernd A., Bereiter-Hahn J., Kaufmann R., Kippenberger S. Long-term lowering of tumor interstitial fluid pressure reduces Ki-67 expression. J Biomech. 2007;40:2324–2329. doi: 10.1016/j.jbiomech.2006.10.039. [DOI] [PubMed] [Google Scholar]
- 17.Hofmann M., McCormack E., Mujic M., Rossberg M., Bernd A., Bereiter-Hahn J., Gjertsen B.T., Wiig H., Kippenberger S. Increased plasma colloid osmotic pressure facilitates the uptake of therapeutic macromolecules in a xenograft tumor model. Neoplasia. 2009;11:812–822. doi: 10.1593/neo.09662. [DOI] [PMC free article] [PubMed] [Google Scholar]
- 18.Abou-Elkacem L., Björn S., Doleschel D., Ntziachristos V., Schulz R., Hoffman R.M., Kiessling F., Lederle W. High accuracy of mesoscopic epi-fluorescence tomography for non-invasive quantitative volume determination of fluorescent protein-expressing tumours in mice. Eur Radiol. 2012;9:1955–1962. doi: 10.1007/s00330-012-2462-x. [DOI] [PubMed] [Google Scholar]
Associated Data
This section collects any data citations, data availability statements, or supplementary materials included in this article.
Supplementary Materials
Caliper measurements of A431 tumor xenograft length (l) and width (w) over the total experimental tumor growth time. Missing values indicate an earlier endpoint of the respective experiment due to ethical regulations of animal care (tumor burden).
Experimental setup for ARTIDA volume measurements on an excised A431 tumor. An adjustable standoff for the fixation of the medical type low frequency transducers was used.
Screen-captured live ARTIDA speckle tracking on in-situ subcutaneous A431 tumor including three planar (x,y,z), M-mode/top-down mode windows as well as the ECG gated signal window.
Tumor interstitial fluid pressure is rising with the increase of tumor volume in A431 tumors