

Abstract
The standard of care for glioblastoma (GB) is surgery followed by concurrent radiation therapy (RT) and temozolomide (TMZ) and then adjuvant TMZ. This regime is associated with increased survival but also increased occurrence of equivocal imaging findings, e.g., tumor progression (TP) versus treatment effect (TE), which is also referred to as pseudoprogression (PsP). Equivocal findings make decisions regarding further treatment difficult and often delayed. Because none of the current imaging assays have proven sensitive and specific for differentiation of TP versus TE/PsP, we investigated whether blood-derived microvesicles (MVs) would be a relevant assay. METHODS: 2.8 ml of citrated blood was collected from patients with GB at the time of their RT simulation, at the end of chemoradiation therapy (CRT), and multiple times following treatment. MVs were collected following multiple centrifugations (300g, 2500g, and 15,000g). The pellet from the final spin was analyzed using flow cytometry. A diameter of approximately 300 nm or greater and Pacific Blue–labeled Annexin V positivity were used to identify the MVs reported herein. RESULTS: We analyzed 19 blood samples from 11 patients with GB. MV counts in the patients with stable disease or TE/PsP were significantly lower than patients who developed TP (P = .014). CONCLUSION: These preliminary data suggest that blood analysis for MVs from GB patients receiving CRT may be useful to distinguish TE/PsP from TP. MVs may add clarity to standard imaging for decision making in patients with equivocal imaging findings.
The current standard of care for glioblastoma (GB) includes the use of temozolomide (TMZ)–based chemoradiation therapy (CRT) following debulking surgery [1], [2]. The TMZ-based CRT regime has increased survival [1], [2] but has also increased the frequency of false positive post-treatment magnetic resonance imaging (MRI) assessments of tumor progression (TP) [3]. In roughly 30% of patients, TP cannot reliably be distinguished on imaging from pseudoprogression (PsP) [3], a type of treatment effect (TE).1 This has resulted in difficult and/or delayed decision making regarding further treatment [3]. New neuroimaging techniques are not yet capable of accurately distinguishing TE/PsP from TP [3]. For patients with TP, additional therapy is indicated and avoiding additional therapies for patients with TE/PsP may improve patient outcome. It will also decrease the number of patients needed for clinical trials [4].
Sparse molecular markers that are shed from tumors into the circulation may be assessed from a “liquid biopsy.” Extracellular vesicles (ECVs), “naked” DNA, and circulating tumor cells are examples of biomarkers that may be isolated from a blood sample. ECVs are membrane-derived, organelle-like structures. They are referred to by many names, including exosomes, microparticles, and microvesicles (MVs). We use the term MVs to refer to vesicles > 300 nm in diameter versus exosomes that are < 300 nm.2 The larger MVs can be interrogated using flow cytometry (FCM) with fluorescent conjugated surface markers. Both normal (i.e., red blood cells, B and T cells, platelets, and macrophages) and cancer cells secrete a heterogeneous mixture of ECV into the tumor interstitial spaces and the circulation [5]. Both exosomes and MVs have been shown to act as signaling complexes in disease and are generally associated with a poor prognosis [6]. We hypothesized that the number of Annexin V–positive3 circulating MVs (based on FCM) could be used as a biomarker for the differentiation of TP from TE/PsP in GB.
Methods
Patients and Volunteers
Patients and volunteers signed University of Pennsylvania Institutional Review Board–approved informed consent for this study. All patients had a diagnosis of GB and surgery was their only treatment before entry into this protocol. Samples for MV analysis were obtained from patients as long as they were receiving standard therapy (additional surgery, radiation, TMZ, and Avastin); MV data were not included in this study once a patient began a therapeutic vaccine-based experimental study.
Clinical, Radiographic, and Histopathologic Assessments
For this study, a central review by one pathologist (M.M.-L.) was performed (Table 1). All patients were diagnosed with GB at their first surgery, and for all patients with TP who received a second surgery, the diagnosis was GB with treatment-related necrosis and other treatment-related changes. MRI images were made following surgery, at the time of simulation for CRT, and at 1, 3, 6, 12, and 24 months after CRT. All of these MRI studies were centrally reviewed (R.L.W.), recording the sum of products of greatest transverse dimensions for enhancing lesions and products of greatest transverse dimensions of flair regions, as described by the Response Assessment in Neuro-Oncology (RANO) criteria [7].
Table 1.
Patient Demographics
| Sex | Male = 6 |
| Female = 5 | |
| Age | Average = 61 (range, 45-75) |
| Surgery | |
| Location | Temporal = 3/11 |
| Parietal = 3/11 | |
| Frontal = 5/11 | |
| Extent of resection | NTR = 2/11 |
| GTR = 2/11 | |
| STR = 6/11 | |
| Biopsy only: 1 | |
| Progression between surgery and simulation | 2 of 10 (biopsied patient not included) |
| Pathologic features | |
| Tumor type (primary) | 11 of 11 GB |
| Ki67 | Average = 29% (8-70%) |
| Absence of pseudopalisading necrosis | 2 of 11 |
| Absence of microvascular proliferation | 2 of 11 |
| EGFR IHC | Average = 2.71⁎ |
| EGFR vIII (RT-PCR) | 6 of 11 positive |
| MGMT methylation | 2 of 9 unmethylated |
| IDH1 IHC | 11 of 11 negative |
| p53 IHC† | Average = 2.18 |
| Recurrent tumor type based on surgery | 3; GBM with necrosis |
| Outcomes | |
| Clinical status at the time of analysis | 2 of 11—DOD |
| 6 of 11—alive with progression | |
| 3 of 11—alive without progression | |
NTR: near total resection; GTR: gross total resection; STR: subtotal resection; GB: glioblastoma; DOD: dead of disease.
EGFR: scale is 0 (no membranous staining), 1 (weak staining), 2 (moderate), and 3 (strong).
p53: scale is 0 (no staining), 1 (subset positive cells), 2 (moderate), and 3 (strong, majority of tumor cells).
Therapy
Maximum safe surgical resection was performed. Approximately 40 to 45 days later, patients underwent computerized tomography/MRI-based treatment planning. The initial volume of the cavity plus the MRI-determined enhancing tumor and flair abnormality volumes were expanded by 1.5 cm and treated at 200 cGy per fraction to 4600 cGy. The fields were then decreased in size to include the cavity and enhancing tissue and continued at 200 cGy per fraction to 6000 cGy for a total of 30 fractions. All patients received concurrent daily TMZ at 75 mg/M2 and began adjuvant TMZ approximately 1 month after radiation. As patients experienced TP, they were assigned to a modified or additional treatment or a clinical trial considered optimal by their physician.
Blood Collection
Following completion of Institutional Review Board–approved written informed consent, peripheral blood was obtained from patients with GB and healthy volunteers. The exclusion criteria for healthy volunteers were that they were < 18 years old and had a previous history and/or current malignancy. For both volunteers and patients with GB, 2.8 ml of blood was collected into a plastic sodium citrate vacutainer tube (BD Scientific, Franklin Lakes, NJ; 363083). Several volunteers agreed to a second sample at a later date, whereas the patients with GB had longitudinal sampling as mentioned above. Because this was a preliminary study, blood draws for MVs were not performed at every imaging session (described above). Thus, we compared MRI images with the nearest temporal assessment of circulating MVs.
Blood tubes were maintained in a vertical position at room temperature until addition of a fixative (Caltag; Fix and Perm Medium A, Invitrogen, Carlsbad, CA), approximately 1 hour after blood collection.
Timing of Samples
Samples were collected from patients with GB within 2 weeks before CRT simulation, at the end of CRT, and at 1, 3, 6, 12, and 24 months after CRT. Patients were taken off the study if they or their treating physician requested this, or they experienced extraordinary medical circumstances. Analysis of blood samples taken after a patient started an experimental vaccine therapy was not included in this analysis.
Blood Processing
Blood (0.9 ml) was added to 0.1 ml of filtered Caltag A and allowed to stand at room temperature for approximately 60 minutes. Red and white cells were removed by a 20-minute spin (20°C) at 300g using a swinging bucket centrifuge with brake set at 0 (Allegra X-22 R; Beckman Coulter, Pasadina, CA). The supernatant (0.4 ml; platelet-rich plasma) was removed with a wide-mouth pipette tip (2 × 200 μl) and mixed thoroughly with 0.6 ml of minimal buffer citrate (standard NaCl and KCl, with 10 mM Hepes and 11 mM sodium citrate). This was further spun at 2500g for 20 minutes (same centrifuge) to produce a platelet pellet and platelet-free supernatant; 0.8 ml of the latter was then removed, 200 μl saved, and the remaining 600 μl spun at 15,000g for 30 minutes at 20°C (swinging bucket, Microfuge 22R; Beckman Coulter). Four hundred microliters of supernatant was removed and half of this was saved (high-speed supernatant), leaving 200 μl above the high-speed pellet (HSP). All samples thus consisted of 200 μl of sample, and each of these was diluted with an equal volume of filtered minimal buffer and 10% DMSO and frozen (5 minutes at − 27°C, plunged to dry ice or at a lower temperature, and stored at − 75°C). The vast majority of MVs was contained in the HSP, and this is the basis of the data presented.
Flow Cytometry
Samples were thawed at 37°C (less than 2 minutes) in a Multi-Blok heater (Barnstead/Lab-Line Multi-Blok® Heaters, Thermo Scientific, Ashville, NC) and gently vortexed. To detect MVs, minimal buffer with 3 mm Ca2 + was supplemented with Pacific Blue (PB)–labeled Annexin V and PE-labeled anti-epidermal growth factor receptor (EGFR)4 [8], [9]. This solution was filtered with a 0.2-μm non–protein-binding filter5 and was then supplemented with 3-μm beads (Spherotech BCP-30) to a final concentration of 50,000/ml (“analysis solution”). For each sample, MV-containing HSP was added to 200 μl of analysis solution in a FCM tube held at room temperature for 30 minutes and then stored on ice until FCM analysis (less than 2.5 hours). A FACS-Canto, three-laser instrument (violet, blue, and red) was set so that the 3-μm beads were situated at about 105 on both forward scatter (FSC) and side scatter log scales. Under these conditions, 1-μm beads were easily observed where expected, but 0.3-μm beads were only partially resolved depending on the daily “mood” of the cytometer. The fluorescent scales were set so that background fluorescence from the 3-μm beads (no fluorescence stain) was at ~ 2000. Each sample was run at medium speed until 4000 beads were counted (0.08 ml at ~ 2 minutes), and the results were analyzed using FlowJo software.
Electron Microscopy
C-flat holey carbon transmission electron microscope grids (Protochips, Raleigh, NC) were glow discharged for 20 seconds at 25 mA to create a hydrophilic surface for the 3 μl of blood plasma. A thin film was formed by blotting the grid with filter paper. Vitreous ice was formed by rapid plunging into liquid ethane cooled to − 180°C by liquid nitrogen. Grids were cryogenically observed at − 178°C in an FEI (Hillsboro, OR) Tecnai-12 microscope, which was operated at 80 keV at magnification as indicated in the figure legends. Images were recorded on a Gatan (Warrendale, PA) US 1000 20482 CCD camera.
Statistics
Analysis of differences between MV values occurring in temporal association with the diagnosis of TP versus TE/PsP and in volunteers was calculated using the Student's t test and expressed in a “box and whisker” plot.
Results
Seven volunteers (three males and four females, ages 30 to 68) and 15 GB patients were accrued to the study. Four of the seven volunteers allowed a second blood draw at a later time. Four patients with GB withdrew from the study before the completion of CRT and were eliminated from further analysis. Thus, data are reported on 11 patients and 7 volunteers. Six patients were male and five were female; all were Caucasian. The average age at diagnosis of GB was 61 (range, 45-75; Table 1). All patients had a centrally confirmed surgical diagnosis of GB from their initial surgery; three patients who underwent second surgery had GB with varying degrees of necrosis (15%, 20%, and 60%). Review of MRI studies following surgery (within 24 hours) demonstrated that six patients had subtotal resection, two had gross total resection, and two had near total resection. One patient had a stereotactic biopsy due the extent and location of the tumor. Immunohistochemical (IHC) molecular markers indicated that none of the tumors were isocitrate dehydrogenase mutant positive, 2 of 9 were methylguanine-DNA methyltransferase (MGMT) unmethylated,6 and 6 of 11 had EGFR vIII mutations (based on real-time polymerase chain reaction). The p53 status, based on IHC (range, 1-3 with 3 being strongly positive), averaged 2.18, and the EGFR averaged 2.7 on the same scale. The average Ki67 count was 29% (range, 8-70%; Table 1).
At the time of simulation, all patients showed nontarget enhancement (nonmeasurable or less than 1 ml), five had target enhancement (measurable enhancement or 1 ml or greater), five had no target enhancement, and one could not be assessed due to excessive motion. RANO values could be determined in 11 of 21 MRI images. After CRT, the first imaging study (baseline) showed 8 of 11 patients with target enhancement, of which 3 were new compared to the simulation study. Five of the eight with target enhancement were equivocal for TE/PsP versus TP with an increase in enhancing volume ranging from 17% to 164% compared to simulation volume; all of these patients had shown mild or convincing progression on the simulation study. Two of these patients required re-resection after baseline MRI. On follow-up after the end of CRT, one patient showed equivocal changes over time, eventually developing slowly evolving target enhancement. Two patients with suspect baseline MRI showed continuing progression on follow-up, and another developed progressive enhancement by the first post-baseline MRI and thereafter. The other patient with concern for progression on baseline improved. The MRI findings in the remaining patients were relatively stable or improved over additional studies.
The MV count in seven normal volunteers ranged from 193 to 4300 raw MV counts.7 One of the volunteers had an MV count that was four to five times higher than the other values, and therefore, we used the median (vs mean) value of 965 as a working value for the cutoff for “normal” Annexin V–positive MV. Four of the volunteers had two MV analyses over 2 to 19 months. The differences between the paired MV values ranged from 4.2% to 51.0%.
Figure 1A shows the cryo-transmission electron microscopy images of vesicles from a volunteer’s blood sample. Vesicles of various sizes and shapes are identified inside of the supporting grid (arrowhead); some exosomes with diameters less than 300 nm are present. The background material (arrow) is plasma protein or spilled MV contents. The great majority of the vesicles seen in approximately 50 fields were intact, supporting that the serial centrifugation and freeze/thaw processes did not damage them.
Figure 1.
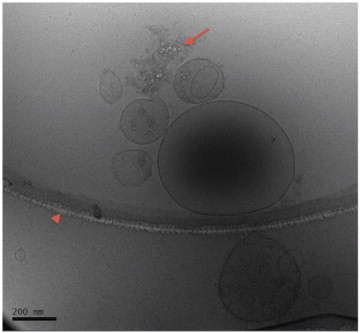
This figure shows a representative image of MV from human blood made with a cryo-transmission electron microscope. In the image, the outer ring that contains the main group of MV is part of the grid holding the sample (arrowhead). Vesicles of various sizes and shapes are identified, some with diameters less than 300 nm (scale bar, 200 nm). The contents of several MVs can be seen as densities or shapes inside the MV. Released contents and/or plasma proteins are also seen (arrow). The majority of the vesicles that were seen in approximately 50 fields were intact, similar to that seen in this image.
Figure 2 shows the FCM control study of 0.3-, 1.0-, and 3.0-μm polystyrene beads. The largest beads are well delineated and are used to calibrate the FCM machine so that the data can be compared over time. An example of FCM of MV from a patient with GB is shown in Figure 2B. Events of interest are based on Annexin V-postivie binding. Annexin V binds to PS, which is conjugated to the fluorochrome PB. In the figure, these events are plotted against FSC. The Annexin V PB positive, low FSC population represents raw MV counts (see region of interest). These values, multiplied by the dilution factor, are equal to the number of MV per milliliter of plasma. In addition to Annexin V, MV samples were stained for EGFR. All MV samples from patients with GB contained EGFR-positive MV (data not shown.)
Figure 2.
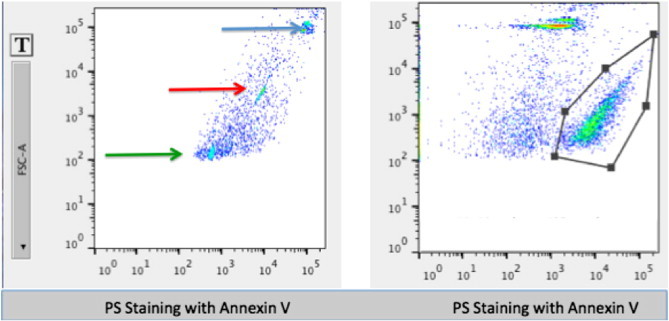
(Left) An FCM example of differently sized polystyrene beads (0.3, 1, and 3 μm diameter) as a size control for sample studies. (Right) An example of the FCM output from a GB patient’s blood prepared for MV analysis. The graph shows an area of interest as defined by PB-conjugated Annexin V plotted against FSC. A clearly defined separate population can be identified as MVs. Note that the FSC and side scatter thresholds were set to 250, so nothing less than that value can be seen.
Figure 3A and B demonstrates the longitudinal temporal measurements of MV production as related to the clinical history for two patients. Figure 3A shows an example of TE/PsP that was associated with low MV counts in patient 4. The patient had a high MV count at the end of CRT. It dropped dramatically by day 45 and remained low. MRIs made between 100 and 150 days were considered equivocal, and the patient maintained a high Karnofsky performance status score without steroids and associated low MV values. By 170 days, MRIs were considered stable, associated with low MV counts. Figure 3B shows an example of TP (patient 3.) At completion of CRT, MV counts were elevated with values > 1000 raw MV counts. Subsequently, MRI studies showed progression in extent of enhancement on fluid attenuation inversion recovery. A second surgery was performed and confirmed recurrence. The patient was subsequently treated with Avastin. This patient died of disease 200 days following initial surgery.
Figure 3.
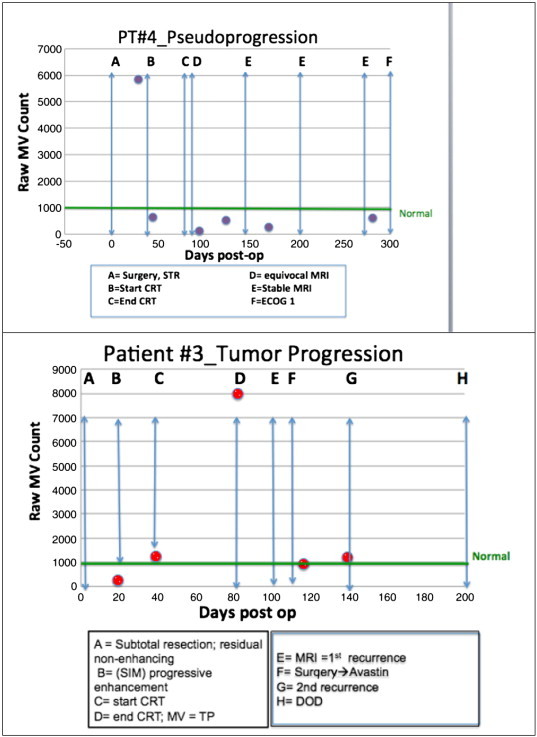
Examples of longitudinal collection of MV samples from two patients. The green line at ≈ 1000 represents the median value of volunteers. The upper panel shows an example of TE/PsP characterized by low MV counts; this was sustained over time. The lower panel shows TP as very elevated MV values (label D); this was 23 days before the radiographic diagnosis of TP. A second surgery was performed and recurrence was confirmed. Post-operatively and after initiation of Avastin therapy, MV counts decreased (labels F-G). The patient died of disease 200 days following initial surgical diagnosis. In both panels, the timeline shown is the same (300 days) for ease of comparison.
The average patient follow-up was 247 days with 9 of 11 patients alive at the time of analysis. Six patients were alive with TP or residual disease post second surgery (two in hospice care) and three patients were living with TE/PsP.
Figure 4 provides the clinical outcome data as related to MV data on 11 patients with 19 imaging sessions and 7 normal volunteers as “box and whiskers” plots. In this small study, there was a statistically significant difference in the MV count at or near the time of TP compared to patients who responded to treatment (TE/PsP) (P = .014). The MV values from the volunteers was statistically different than the patients with TP (P = .04).
Figure 4.
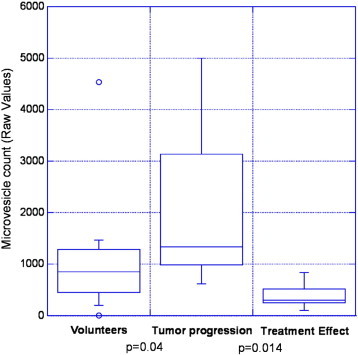
Results from 11 patients with 19 MRI images, plotted as “box and whiskers” plots. Each data element for this graph is based on an MRI imaging reading and a temporally associated MV measurement. Thus, there may be more than one data point for each patient. The bottom and top of each box represents the first and third quartiles, and the band inside the box is the second quartile (the median). The “whiskers” represent the lowest datum still within 1.5 interquartile range of the lower quartile and the highest datum still within 1.5 interquartile range of the upper quartile. The small circles represent outliers. The MV counts in patients that experienced TP were statistically different from the volunteers (P = .04). The MV counts in patients at the point that they experienced TP were statistically higher than that from patients with TE/PsP (P = .014).
Our overall findings were: (1) if MVs from the patients with GB were elevated at the time of simulation, they tended to decrease—although not necessarily to normal—by the end of CRT; (b) patients with low MV numbers at the start of CRT and did not have TP tended to have low MV at the end of CRT; (c) TP was associated with increased MV values greater or much greater than 965 raw MV count, the working “cutoff” based on blood from normal volunteers; and (d) in most patients, therapeutic interventions (i.e., radiation, Avastin, and surgery) resulted in a decreased MV count.
Discussion
We hypothesized that the FCM-based number of Annexin V–positive circulating MV could be used in real time as a biomarker for differentiating TP versus TE/PsP in GB patients receiving CRT followed by standard therapies. Our preliminary findings (Figure 4) support that hypothesis, where following CRT, GB patients with TP have elevated Annexin V–positive MV compared to patients with TE/PsP (P = .014).
Controversy exists over the best methods to differentiate TP from TE/TP. A recent systematic review of the imaging literature concluded that single-photon emission computed tomography, not conventional MRI, is the most sensitive and specific imaging modality [10]. However, the standard response criteria for GB RANO are based on MRI imaging plus clinical considerations (Karnofsky performance status and steroid dependence) [11]. Since MRI changes are not specific for TP versus TE/PsP, there is a possibility for misdiagnosis in a substantial number of patients, and therefore, new methods of imaging patients with GB are desirable. Positron emission tomography imaging [12], diffusion tensor imaging MRI [13], and magnetic resonance perfusion are being explored. Non–imaging-based tumor biomarkers such as Ki67 [14] and MGMT [15] have been reported to be prognostic in some studies. However, these markers only provide a probability of a patient developing TE/PsP (vs TP) and are not specific to a patient at a given time. Newer methods including those based on circulating tumor cells and/or naked DNA are beginning to approach this question [16].
Only a few studies on blood-borne MV isolated from patients with GB have been published. One of the earliest studies was published in 2008 by Skog et al. [17]. GB patient’s tumor biopsies and serum-derived MV were analyzed for RNA and proteins that may promote tumor growth and provide diagnostic biomarkers. Twenty-five patient samples were studied and seven (28%) were positive for the EGFR vIII mutation. More recent studies of blood-borne MV have shown that patients with GB have downregulated levels of RNA coding for ribosomal production compared to normal controls [18]. The work from the Belting Laboratory has demonstrated that exosomes from patients with GB are enriched in several hypoxia-regulated proteins known to have important roles in GB pathology [19].
The work presented herein is preliminary, but if confirmed in a larger study, it will have substantial clinical significance. The ability to differentiate TP from TE/PsP will allow for improved confidence in treatment decisions and potentially improve patient survival. When MRI studies are equivocal, the current recommendation is to re-image patients in 1 month to determine whether the changes persist or progress. Sometimes the changes are slow enough that multiple months may pass before clinical and/or imaging findings are definitive. If TE/PsP could be differentiated from TP earlier in the disease course, patients with TP could more rapidly be offered a change to more effective therapy. Figure 3B gives an example of TP (patient 4); the MV count supporting TP was proposed 23 days before MRI changes were definitive enough to change therapy. Patients with TE/PsP could be spared more aggressive therapy. Another application of these findings is the possibility to decrease medical costs and patient morbidity. Many patients are taken for surgical biopsy/resection when their MRI studies are equivocal for TE/PsP versus TP, increasing costs and potential morbidity. If a blood-based test could help differentiate these conditions, the number of additional invasive therapies could be reduced. In addition, the number of patients on clinical trials to test new therapies could be decreased. Patients who are misdiagnosed (i.e., diagnosed as TP when truly TE/PsP) and treated on clinical trials increases the number of patients needed to identify a significant effect because only a fraction of the subjects are able to respond to therapy. For example, if only 50% of patients on a therapeutic trial have TP, the trial could require nearly 10-fold more patients to identify efficacy [4]. In the future, the study of MV to detect therapy response would be of substantial importance.
In this study, we used a cutoff of 965 raw MV counts to distinguish between “normal” and “abnormal” MV counts. There is some overlap between groups, and therefore, there is a concern for specificity of the assay. Co-morbidities [20], [21], [22], [23], [24] could confuse analysis based on a single cutoff, and we will accrue more patients and volunteers to determine whether we can use each patient as their own control and/or determine a range of “normal” values. It should be noted that several of the patients in our GB cohort had co-morbidities including multiple sclerosis, hyperlipidemia, diabetes, and cardiac disease. Nonetheless, our analysis of differences in MV count between TP and TE/PsP was highly significant. It needs to be emphasized that the proposed MV analyses are not meant to identify patients with brain cancer, for which overlap between volunteers’ and patients’ values would be very problematic. We propose its use in patients with diagnosed GB who are undergoing treatment.
The possibility to “personalize” the diagnosis of TP versus TE/PsP in patients with GB has many advantages and, based on this small study, seems feasible. In addition to providing an early warning system for tumor recurrence, identifying high MV values preceding clinical and imaging changes may support the use of anti-MV therapies. There is extensive literature supporting that MVs are associated with aggressive tumor characteristics such as invasion and metastasis [25], [26]. Destruction of MV may be a novel therapeutic option. Drugs are being developed for clinical use in solid cancers. For example, Bavituximab, an antibody to PS residues [27], [28], is being used in phase III trials of solid tumors, primarily to modify the immune system. Drugs with other mechanisms of action such as targeting calpain are being proposed [29]. These drugs face the challenge of being specific to tumor MV without damaging normal cells.
Footnotes
Herein, we will use the notation TE/PsP to denote that on MRI images, the histologic content of the changes cannot be specifically predicted.
There are many definitions in the literature regarding the size range of exosomes versus MVs. Herein, we selected the cutoff at 300 nm because this is the smallest particle size that can be delineated by flow cytometry.
Annexin V is a marker of phosphotidylserine (PS), which is found on the outside surface of MVs.
EGFR vIII was not measured in the MVs collected but was determined on the surgical specimen by reverse transcription–polymerase chain reaction (RT-PCR).
It should be noted that no MV-containing solution was filtered.
Two patients did not have MGMT methylation status evaluated.
To convert raw MV counts to MV per milliliter of plasma, the raw MV count should be multiplied by the dilution factor.
References
- 1.Stupp R, Dietrich PY, Ostermann Kraljevic S, Pica A, Maillard I, Maeder P, Meuli R, Janzer R, Pizzolato G. Promising survival for patients with newly diagnosed glioblastoma multiforme treated with concomitant radiation plus temozolomide followed by adjuvant temozolomide. J Clin Oncol. 2002;20:1375–1382. doi: 10.1200/JCO.2002.20.5.1375. [DOI] [PubMed] [Google Scholar]
- 2.Stupp R, Hegi ME, Mason WP, van den Bent MJ, Taphoorn MJ, Janzer RC, Ludwin SK, Allgeier A, Fisher B, Belanger K. Effects of radiotherapy with concomitant and adjuvant temozolomide versus radiotherapy alone on survival in glioblastoma in a randomised phase III study: 5-year analysis of the EORTC-NCIC trial. Lancet Oncol. 2009;10:459–466. doi: 10.1016/S1470-2045(09)70025-7. [DOI] [PubMed] [Google Scholar]
- 3.Kruser T, Mehta M, Robins H. Pseudoprogression after glioma therapy: a comprehensive review. Expert Rev Neurother. 2013;13:389–403. doi: 10.1586/ern.13.7. [DOI] [PubMed] [Google Scholar]
- 4.Stone HB, Brown JM, Phillips TL, Sutherland RM. Oxygen in human tumors: correlations between methods of measurement and response to therapy. Summary of a workshop held November 19-20, 1992, at the National Cancer Institute, Bethesda, Maryland. Radiat Res. 1993;136:422–434. [PubMed] [Google Scholar]
- 5.Camussi G, Deregibus MC, Bruno S, Cantaluppi V, Biancone L. Exosomes/microvesicles as a mechanism of cell-to-cell communication. Kidney Int. 2010;78:838–848. doi: 10.1038/ki.2010.278. [DOI] [PubMed] [Google Scholar]
- 6.Ohno S, Ishikawa A, Kuroda M. Roles of exosomes and microvesicles in disease pathogenesis. Adv Drug Deliv Rev. 2013;65:398–401. doi: 10.1016/j.addr.2012.07.019. [DOI] [PubMed] [Google Scholar]
- 7.Lin NU, Lee EQ, Aoyama H, Barani IJ, Baumert BG, Brown PD, Camidge DR, Chang SM, Dancey J, Gaspar LE. Challenges relating to solid tumour brain metastases in clinical trials, part 1: patient population, response, and progression. A report from the RANO group. Lancet Oncol. 2013;14:e396–e406. doi: 10.1016/S1470-2045(13)70311-5. [DOI] [PubMed] [Google Scholar]
- 8.Shao H, Chung J, Balaj L, Charest A, Bigner DD, Carter BS, Hochberg FH, Breakefield XO, Weissleder R, Lee H. Protein typing of circulating microvesicles allows real-time monitoring of glioblastoma therapy. Nat Med. 2012;18:1835–1840. doi: 10.1038/nm.2994. [DOI] [PMC free article] [PubMed] [Google Scholar]
- 9.Graner MW, Alzate O, Dechkovskaia AM, Keene JD, Sampson JH, Mitchell DA, Bigner DD. Proteomic and immunologic analyses of brain tumor exosomes. FASEB J. 2009;23:1541–1557. doi: 10.1096/fj.08-122184. [DOI] [PMC free article] [PubMed] [Google Scholar]
- 10.Shah AH, Snelling B, Bregy A, Patel PR, Tememe D, Bhatia R, Sklar E, Komotar RJ. Discriminating radiation necrosis from tumor progression in gliomas: a systematic review what is the best imaging modality? J Neurooncol. 2013;112:141–152. doi: 10.1007/s11060-013-1059-9. [DOI] [PubMed] [Google Scholar]
- 11.Quant EC, Wen PY. Response assessment in neuro-oncology. Curr Oncol Rep. 2011;13:50–56. doi: 10.1007/s11912-010-0143-y. [DOI] [PubMed] [Google Scholar]
- 12.Oborski MJ, Laymon CM, Lieberman FS, Mountz JM. Distinguishing pseudoprogression from progression in high-grade gliomas: a brief review of current clinical practice and demonstration of the potential value of 18F-FDG PET. Clin Nucl Med. 2013;38:381–384. doi: 10.1097/RLU.0b013e318286c148. [DOI] [PMC free article] [PubMed] [Google Scholar]
- 13.Agarwal A, Kumar S, Narang J, Schultz L, Mikkelsen T, Wang S, Siddiqui S, Poptani H, Jain R. Morphologic MRI features, diffusion tensor imaging and radiation dosimetric analysis to differentiate pseudo-progression from early tumor progression. J Neurooncol. 2013;112:413–420. doi: 10.1007/s11060-013-1070-1. [DOI] [PubMed] [Google Scholar]
- 14.Pouleau HB, Sadeghi N, Baleriaux D, Melot C, De Witte O, Lefranc F. High levels of cellular proliferation predict pseudoprogression in glioblastoma patients. Int J Oncol. 2012;40:923–928. doi: 10.3892/ijo.2011.1260. [DOI] [PMC free article] [PubMed] [Google Scholar]
- 15.Fabi A, Russillo M, Metro G, Vidiri A, Di Giovanni S, Cognetti F. Pseudoprogression and MGMT status in glioblastoma patients: implications in clinical practice. Anticancer Res. 2009;29:2607–2610. [PubMed] [Google Scholar]
- 16.MacArthur KM, Kao GD, Chandrasekaran S, Alonso-Basanta M, Chapman C, Lustig RA, Wileyto EP, Hahn SM, Dorsey JF. Detection of brain tumor cells in the peripheral blood by a telomerase promoter-based assay. Cancer Res. 2014;78:2152–2159. doi: 10.1158/0008-5472.CAN-13-0813. [DOI] [PMC free article] [PubMed] [Google Scholar]
- 17.Skog J, Wurdinger T, van Rijn S, Meijer DH, Gainche L, Sena-Esteves M, Curry WT, Jr, Carter BS, Krichevsky AM, Breakefield XO. Glioblastoma microvesicles transport RNA and proteins that promote tumour growth and provide diagnostic biomarkers. Nat Cell Biol. 2008;10:1470–1476. doi: 10.1038/ncb1800. [DOI] [PMC free article] [PubMed] [Google Scholar]
- 18.Noerholm M, Balaj L, Limperg T, Salehi A, Zhu LD, Hochberg FH, Breakefield XO, Carter BS, Skog J. RNA expression patterns in serum microvesicles from patients with glioblastoma multiforme and controls. BMC Cancer. 2012;12:22. doi: 10.1186/1471-2407-12-22. [DOI] [PMC free article] [PubMed] [Google Scholar]
- 19.Kucharzewska P, Christianson HC, Welch JE, Svensson KJ, Fredlund E, Ringner M, Morgelin M, Bourseau-Guilmain E, Bengzon J, Belting M. Exosomes reflect the hypoxic status of glioma cells and mediate hypoxia-dependent activation of vascular cells during tumor development. Proc Natl Acad Sci U S A. 2013;110:7312–7317. doi: 10.1073/pnas.1220998110. [DOI] [PMC free article] [PubMed] [Google Scholar]
- 20.Duijvesz D, Luider T, Bangma CH, Jenster G. Exosomes as biomarker treasure chests for prostate cancer. Eur Urol. 2011;59:823–831. doi: 10.1016/j.eururo.2010.12.031. [DOI] [PubMed] [Google Scholar]
- 21.Karolina DS, Tavintharan S, Armugam A, Sepramaniam S, Pek SL, Wong MT, Lim SC, Sum CF, Jeyaseelan K. Circulating miRNA profiles in patients with metabolic syndrome. J Clin Endocrinol Metab. 2012;97:E2271–E2276. doi: 10.1210/jc.2012-1996. [DOI] [PubMed] [Google Scholar]
- 22.Weilner S, Schraml E, Redl H, Grillari-Voglauer R, Grillari J. Secretion of microvesicular miRNAs in cellular and organismal aging. Exp Gerontol. 2013;48:626–633. doi: 10.1016/j.exger.2012.11.017. [DOI] [PMC free article] [PubMed] [Google Scholar]
- 23.Lee HS, Jeong J, Lee KJ. Characterization of vesicles secreted from insulinoma NIT-1 cells. J Proteome Res. 2009;8:2851–2862. doi: 10.1021/pr900009y. [DOI] [PubMed] [Google Scholar]
- 24.Azevedo LC, Pedro MA, Laurindo FR. Circulating microparticles as therapeutic targets in cardiovascular diseases. Recent Pat Cardiovasc Drug Discov. 2007;2:41–51. doi: 10.2174/157489007779606121. [DOI] [PubMed] [Google Scholar]
- 25.Peinado H, Lavotshkin S, Lyden D. The secreted factors responsible for pre-metastatic niche formation: old sayings and new thoughts. Semin Cancer Biol. 2011;21:139–146. doi: 10.1016/j.semcancer.2011.01.002. [DOI] [PubMed] [Google Scholar]
- 26.Janowska-Wieczorek A, Wysoczynski M, Kijowski J, Marquez-Curtis L, Machalinski B, Ratajczak J, Ratajczak MZ. Microvesicles derived from activated platelets induce metastasis and angiogenesis in lung cancer. Int J Cancer. 2005;113:752–760. doi: 10.1002/ijc.20657. [DOI] [PubMed] [Google Scholar]
- 27.Gerber DE, Stopeck AT, Wong L, Rosen LS, Thorpe PE, Shan JS, Ibrahim NK. Phase I safety and pharmacokinetic study of bavituximab, a chimeric phosphatidylserine-targeting monoclonal antibody, in patients with advanced solid tumors. Clin Cancer Res. 2011;17:6888–6896. doi: 10.1158/1078-0432.CCR-11-1074. [DOI] [PubMed] [Google Scholar]
- 28.He J, Yin Y, Luster TA, Watkins L, Thorpe PE. Antiphosphatidylserine antibody combined with irradiation damages tumor blood vessels and induces tumor immunity in a rat model of glioblastoma. Clin Cancer Res. 2009;15:6871–6880. doi: 10.1158/1078-0432.CCR-09-1499. [DOI] [PubMed] [Google Scholar]
- 29.Roseblade A, Luk F, Rawling T, Ung A, Grau GER, Bebawy M. International Society of Extracellular Vesicles. 2014. Calpain inhibition: a new strategy to circumvent microparticle- mediated multidrug resistance in cancer. [Rotterdam, Holland] [Google Scholar]