

Abstract
Background.
Little is known about the health and functioning of individuals who become centenarians in the years prior to reaching age 100. We examined long-term trajectories of disease, disability, and cognitive function in a sample of U.S. centenarians to determine how their aging experience differs from their nonsurviving cohort counterparts, and if there is heterogeneity in the aging experience of centenarians.
Methods.
Data are from the 1993–2010 waves of the nationally representative Health and Retirement Study. Among those who had the potential to become centenarians, we identified 1,045 respondents who died before reaching age 100 and 96 who survived to their 100th birthday. Respondents, or their proxies, reported on diagnosis of six major diseases (hypertension, heart disease, lung disease, stroke, cancer, and diabetes), limitations in activities of daily living, and cognitive function.
Results.
As they age to 100, centenarians are generally healthier than nonsurviving members of their cohort, and a number of individuals who become centenarians reach 100 with no self-reported diseases or functional impairments. About 23% of centenarians reached age 100 with no major chronic disease and approximately the same number had no disability (18%). Over half (55%) reached 100 without cognitive impairment. Disease and functioning trajectories of centenarians differ by sex, education, and marital status.
Conclusions.
While some centenarians have poor health and functioning upon reaching age 100, others are able to achieve exceptional longevity in relatively good health and without loss of functioning. This study underscores the importance of examining variation in the growing centenarian population.
Key Words: Centenarians, Longevity, Disease, Functioning.
Although centenarians are still rare in the U.S. population, the number of U.S. centenarians has grown rapidly in the past 30 years (1). Current centenarians survived to age 100 years when the median age at death for their cohort was around 70 years (2), and thus represent a unique subset of the older population. The U.S. centenarian population is projected to increase sixfold by 2050 (3). The rapid emergence of this long-lived population raises the question: Are longer lives healthier lives?
Of major concern is the possibility that additional years of life are accompanied by increased rates of disease and disability, often referred to as the “expansion of morbidity” (4). Although the exceptional longevity of centenarians is impressive, centenarians may be spending much of their added years in poor health, with a high disease burden (5) and diminished physical and cognitive functioning (6–9). Another perspective on centenarians, however, is that they are exemplars of life-long healthy aging (10,11) and that most of their additional years are healthy years. This perspective, which is consistent with the “compression of morbidity” hypothesis (12), maintains that survival to 100 years is predicated on an individual’s ability to remain healthy. Perhaps a more plausible characterization of the centenarian experience is that there is variation in health and functioning. Although as a group centenarians share the unique trait of being “longevity outliers,” they likely vary in their aging experience. Emerging studies of centenarians find that although some centenarians live with disease and diminished functioning, others remain healthy and functional (8,13,14).
Understanding the aging experience of those who become centenarians requires longitudinal data on older adults in the decades before reaching 100 years. Most prior studies of centenarians, however, are based on cross-sectional surveys that only measure health and functioning at or around 100 years of age (5–9,14–16), or use retrospective information to determine health and functioning prior to reaching 100 years of age (13,17,18). We know of one study that has examined trajectories of physical and cognitive independence in a cohort of centenarians, using multiple assessments of centenarians during their 90s, but this study did not directly examine heterogeneity in trajectories (19). Another limitation of existing research is that few studies have compared centenarians with appropriate controls, the nonsurviving members of their birth cohort. Two studies using data on the 1905 Danish cohort compared centenarians with their shorter-lived counterparts and found that centenarians were healthier and higher functioning over time (17,19). Making intracohort comparisons precludes cohort differences as a potential explanation for centenarians’ health advantage at older ages.
We use a national, prospective study of older U.S. adults to examine disease and functioning trajectories of centenarians and their shorter-lived cohort counterparts. We find that compared with their nonsurviving counterparts, centenarians were healthier during their 80s and 90s. There is, however, considerable heterogeneity in disease and functioning trajectories among centenarians.
Methods
Study Population
We use data from the Health and Retirement Study (HRS), a prospective panel study that started in 1993 with a nationally representative sample of the noninstitutional U.S. population aged 70 and older. Follow-up interviews were conducted every 2 years with respondents or their proxies. The current study includes data through the 2010 interview, totaling 17 years of follow-up. The response rate at baseline was 83%, with follow-up response rates ranging from 93% to 96%. The baseline sample has been shown to correspond to the 1993 Current Population Survey for those aged 80 and older and to represent both healthy and frail older adults (20).The initial sample in 1993 only represented community-dwelling older adults, but because respondents could be interviewed in later waves in institutionalized settings, such as nursing homes, the sample also becomes representative of the institutionalized population within two survey waves (21).
Figure 1 shows how the analytic sample was selected. Respondents were included in the sample if they had the potential to survive to 100 years by 2010 and had at least one follow-up interview. Among those who were born in 1910 or earlier, we differentiate between nonsurvivors (n = 1,045)—respondents who died before reaching 100 years of age—and centenarian survivors (n = 113)—respondents who reached 100 years of age during the study period. In brief, we refer to centenarian survivors as centenarians. We also excluded centenarians who were in the study for fewer than 3 years prior to reaching 100 years or were not observed within 3 years of reaching 100 years, yielding a final sample of 96 centenarians.
Figure 1.

Sample selection flow chart.
Age validation is important in studies of extreme longevity because age and birth year misreporting can artificially inflate the number of centenarians. Age misreporting is more likely to occur among the very old due to lack of birth records documenting year of birth (22). Individuals in this study were born close to or after 1900 and are, therefore, more likely to accurately report their birth year (23). Furthermore, birth year was reported accurately by 89% of centenarians (n = 85) and nonsurvivors (n = 932) according to comparisons with birth year information recorded in Medicare data, a reliable administrative source of birth year information (24). Only one centenarian reported a birth year inconsistent with Medicare records. Birth year information could not be verified for the remaining 10 centenarians and 113 nonsurvivors. However, it is likely that centenarians for whom birth year could not be validated reported their year of birth correctly because their individual characteristics are consistent with those who correctly report their birth year: eight were white, six had at least 12 years of education and none were born in the South, where vital statistics systems were not complete until the 1930s.
Disease and Functioning Measures
We examine three dimensions of health: selected self-reported chronic diseases and conditions, disability, and cognitive function. Disease is measured with a count of the number of six selected disease and chronic conditions: hypertension; diabetes; cancer; chronic lung disease (eg, chronic bronchitis, emphysema); heart disease (eg, coronary heart disease, angina, congestive heart failure), and stroke. These represent six of the leading causes of death among adults aged 85 and older (25). Respondents who report having a doctor diagnosed disease or condition are given a score of 1, for a total score that ranges from 0 to 6.
Disability is measured using a modified Katz activities of daily living (ADL) scale (26) that consists of the following activities: walking across a room, dressing, bathing, eating, getting in and out of bed, and using the toilet. Respondents who reported any difficulty with an activity were given a score of 1, for a total score that ranges from 0 to 6.
Cognitive function is assessed with a 35-point scale that sums scores on an immediate and delayed 10-noun free-recall test to measure memory, a serial seven subtraction test to measure working memory, a backwards counting test to measure processing speed, recall of the date and name of the president and vice-president to measure orientation, and an object naming test to measure knowledge and language. These tests were adapted from the Telephone Interview for Cognitive Status and have been validated for use in population surveys (27). Scores of 8 or less indicate severe cognitive impairment in adults aged 70 and older (21,27,28).
The cognitive function assessment is administered directly to respondents. For respondents with proxies, we considered additional information that would indicate cognitive impairment. If respondents did not have a cognitive function score in a survey wave, but their proxy reported they had been diagnosed with a memory-related disease, we categorized them as being cognitively impaired at that wave and all subsequent waves. In the 2010 interview, the questionnaire was changed and respondents or their proxies were asked if a doctor had ever told them that the respondent had Alzheimer’s, dementia, senility, or other serious memory impairment.
Survival Pathways
We use an existing classification approach to define three centenarian survival pathways: escapers, delayers, and survivors (13). Escapers had no diseases or functional loss at the time of the first interview or the last interview. For instance, centenarians who showed no signs of cognitive impairment over time were considered to have escaped cognitive impairment. Delayers also had no diseases or functional loss at baseline, but had some level of disease or functional loss by the time of their last interview. For example, those who had no ADL limitations at baseline, but who were limited in at least one activity by the time they reached 100 years, were considered to have delayed disability. Survivors had some level of disease or functional loss at both the baseline and the final interview.
Statistical Analyses
We examined differences between centenarians and nonsurvivors using t tests for continuous variables and chi-square tests for categorical variables. We used one-way analysis of variance and chi-square tests to compare characteristics between survival pathways. All statistical analyses were performed using Stata 12.1. All analyses are weighted to account for differential sampling probabilities and nonresponse.
Results
Baseline characteristics of nonsurvivors and centenarians are shown in Table 1. Centenarians were older at baseline, and more likely to be female, widowed, and living alone. They also had a lower disease burden at baseline, compared with nonsurvivors. Centenarians had lower levels of disability and higher levels of cognitive function compared with nonsurvivors, but the differences were not statistically significant.
Table 1.
Baseline Characteristics by Survivorship Status
| Nonsurvivors (N = 1,045) | Centenarian Survivors (N = 96) | p Value | |
|---|---|---|---|
| Age at baseline, y | 86.2 | 89.4 | <.000 |
| Birth cohort | |||
| 1896–1900 | 4% | 29% | <.000 |
| 1901–1905 | 23% | 37% | |
| 1906–1910 | 74% | 34% | |
| Female | 68% | 83% | .004 |
| Nonwhite | 12% | 16% | .261 |
| Education, y | 10.3 | 10.7 | .431 |
| Not married | 67% | 79% | .014 |
| Live alone | 48% | 61% | .029 |
| Proxy respondent | 14% | 10% | .364 |
| Diseases (0–6) | 1.45 | 1.03 | <.000 |
| Hypertension | 43% | 35% | .065 |
| Heart disease | 32% | 20% | .003 |
| Stroke | 11% | 6% | .027 |
| Lung disease | 7% | 0% | .003 |
| Cancer | 12% | 12% | .694 |
| Diabetes | 9% | 2% | .015 |
| ADLs (0–6) | 0.57 | 0.53 | .802 |
| Walking | 17% | 19% | .654 |
| Dressing | 13% | 10% | .145 |
| Bathing | 11% | 7% | .083 |
| Bed | 3% | 5% | .032 |
| Toileting | 8% | 4% | .659 |
| Eating | 5% | 8% | .746 |
| Cognitive function (1–35) | 16.87 | 17.23 | .613 |
| Impaired | 8% | 9% | .789 |
Notes: ADLs = activities of daily living. Numbers are means for continuous variables and percentages for categorical variables. Nonwhite = black, Hispanic, and other race. Not married = divorced, separated, widowed, never married. Sample size for cognitive function measures is n = 898 for nonsurvivors and n = 86 for Centenarian survivors. p values from two-tailed t tests for continuous variables and two-tailed chi-square tests for categorical variables.
Figure 2 shows trajectories of disease, ADL limitations, and cognitive functioning by 2-year age intervals for centenarians and nonsurvivors. To account for the large cohort differences shown in Table 1, we compared trajectories of centenarians with their age-matched nonsurvivor counterparts. Those who become centenarians had fewer diseases at every age (Panel A). However, the average number of diseases increased more rapidly among centenarians, resulting in a narrowing of the gap between nonsurvivors and centenarians. Similarly, centenarians had fewer ADL limitations relative to nonsurvivors (Panel B). Trajectories of cognitive functioning are shown in Panel C. There was very little difference in cognitive function between centenarians and nonsurvivors. After 96 years of age, the average cognitive function score among centenarians declined from about 15 to just below 10 by age 100–101 years. Mean cognitive functioning was calculated for a smaller number of respondents because scores were not available from respondents who had a proxy complete the interview.
Figure 2.
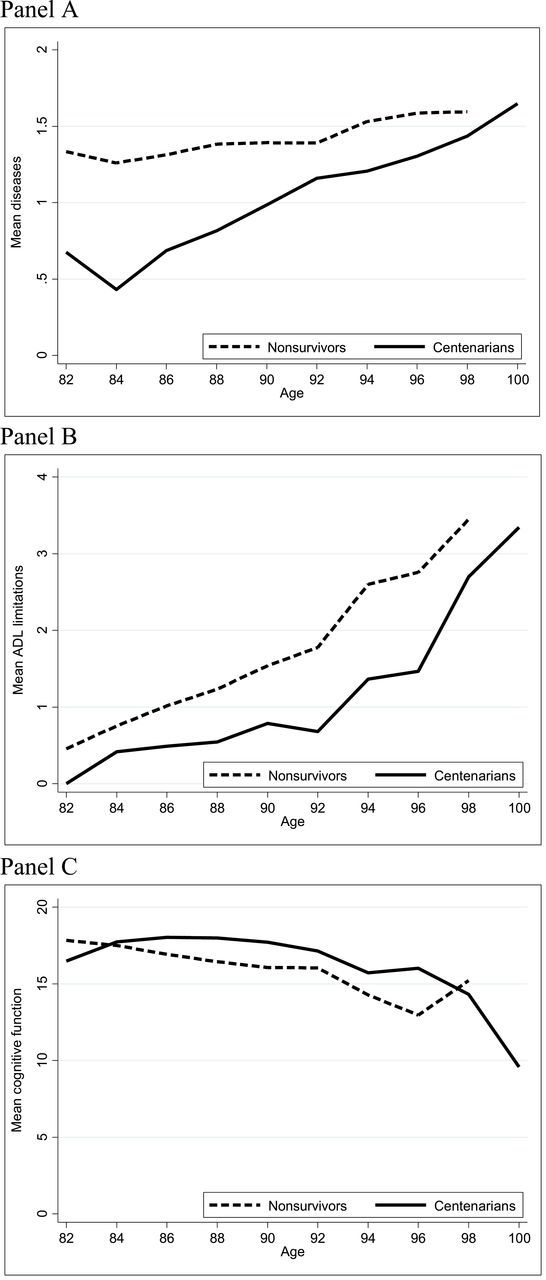
Trajectories of disease (panel A), ADL limitations (panel B), and cognitive function (panel C) by age and survivorship status.
Although centenarians are generally healthier than their nonsurviving counterparts, there may be heterogeneity in the centenarian aging experience. Figure 3 shows the distribution of centenarians across the three survival pathways (escapers, delayers, and survivors) for each of the three health indicators. Over half survived to 100 years of age with at least one chronic disease or condition; most had been diagnosed with hypertension or heart disease. About one-fifth did not have any diseases in their 80s and 90s, delaying disease onset into later ages. The other 21% escaped poor health, reaching 100 years of age with no diagnosed diseases.
Figure 3.
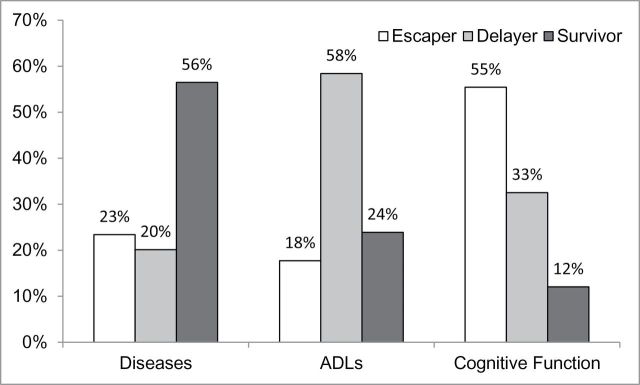
Distribution of centenarians by survival pathway.
One-fifth of centenarians escaped with no disability and about one-fourth survived with disability. Most had no activity limitations in their 80s and 90s and experienced a delay of functional loss into later years. Contrary to the small number of centenarians who escaped with no diseases, over half of the centenarians remained cognitively intact (ie, escaped cognitive impairment). About 31% were cognitively intact in their 80s and 90s, but had developed cognitive impairment prior to reaching 100 years of age. Only 12% of those who survived to 100 years of age were cognitively impaired at younger ages.
Table 2 shows the distribution of sociodemographic characteristics of centenarians by survival pathway for each of the three health indicators. Those who escaped with no diseases were older, on average, than those who delayed or survived with disease. With respect to the ADL pathways, relatively fewer women and unmarried (ie, widowed) adults were present among ADL escapers and delayers, compared with ADL survivors. Centenarians who escaped or delayed cognitive impairment were younger at baseline than those who survived with impairment, and both escapers and delayers had higher education levels compared with survivors.
Table 2.
Centenarian Survivor Characteristics by Survival Pathways
| Diseases | ADLs | Cognitive Impairment | |||||||
|---|---|---|---|---|---|---|---|---|---|
| Escaper (n = 23) | Delayer (n = 22) | Survivor (n = 51) | Escaper (n = 19) | Delayer (n = 56) | Survivor (n = 23) | Escaper (n = 50) | Delayer (n = 33) | Survivor (n = 13) | |
| Age at baseline, y | 90.6* | 87.7 | 89.6 | 89.9 | 88.9 | 90.5 | 89.7* | 88.2 | 91.7 |
| Birth cohort | |||||||||
| 1896–1900 | 43%** | 18% | 27% | 24% | 24% | 46% | 27%** | 21% | 62% |
| 1901–1905 | 34% | 20% | 44% | 54% | 37% | 25% | 45% | 30% | 16% |
| 1906–1910 | 23% | 62% | 29% | 23% | 39% | 30% | 28% | 49% | 22% |
| Female | 77% | 82% | 85% | 77%* | 80% | 95% | 75%* | 90% | 100% |
| Nonwhite | 22% | 22% | 10% | 16% | 15% | 16% | 11% | 17% | 32% |
| Education, y | 11.9 | 11.4 | 10.0 | 11.2 | 11.1 | 9.3 | 11.3** | 11.3 | 6.3 |
| Not married | 67% | 77% | 85% | 69%* | 75% | 96% | 75% | 80% | 96% |
| Live alone | 63% | 71% | 56% | 63% | 55% | 71% | 60% | 62% | 58% |
| Time in study, y | 11.4 | 13.1 | 11.6 | 12.0 | 12.3 | 10.8 | 12.0 | 12.6 | 9.1 |
Notes: ADLs = activities of daily living. Numbers are means for continuous variables and percentages for categorical variables. Statistically significant differences (**p < .05, *p < .10) among groups from two-tailed t tests for continuous variables and two-tailed chi-square tests for categorical variables.
Disease and functioning trajectories by survivor pathways are shown in Figure 4. In the disease pathway (Panel A) escapers are represented by a flat line at zero because they survived to 100 years of age with none of the diagnosed diseases. Delayers and survivors both experienced increases in the number of diseases over time. Although the line is relatively flat, ADL escapers are not represented by a completely flat trajectory because some individuals reported ADL limitations during the study period but then experienced recovery from disability prior to reaching 100 years of age (Panel B). The ADL survivors have an average of nearly two limitations at baseline, increasing to over four limitations by 100 years of age. Although delayers do not initially have much disability, they ultimately reach an average of nearly four limitations by 100 years of age. Escapers and delayers have relatively high cognitive functioning scores over time, though scores decline steeply with age for delayers (Panel C). Survivors have consistently low scores over time.
Figure 4.
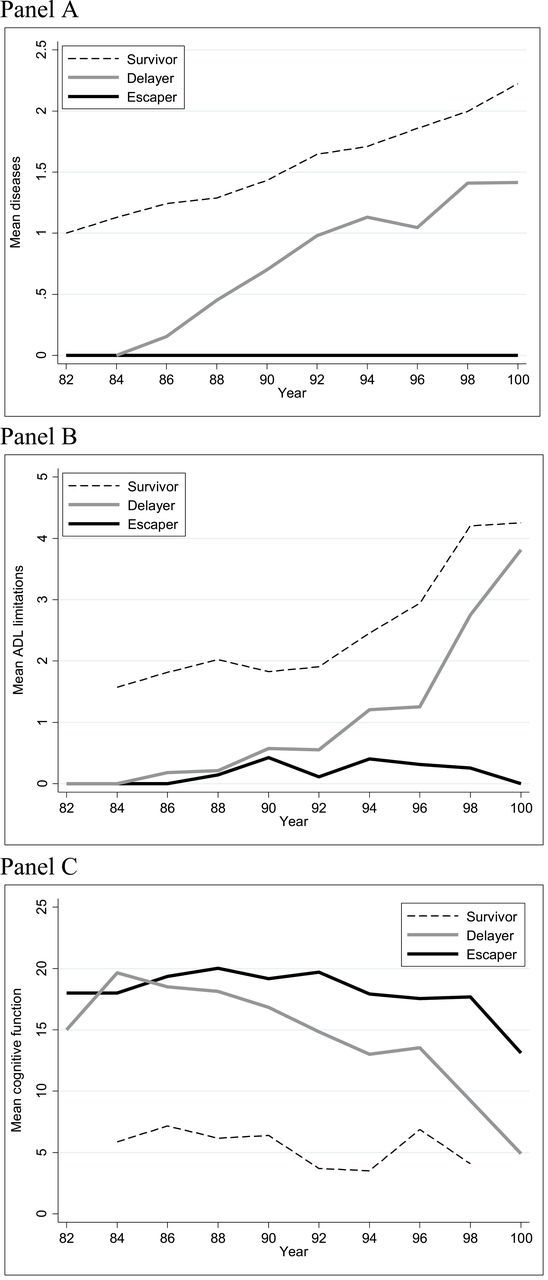
Trajectories of diseases (panel A), ADL limitations (panel B), and cognitive function (panel C) by age and centenarian survival pathway.
Discussion
This study confirms in a prospective, national sample of older U.S. adults that there is significant heterogeneity in the aging experience of centenarians prior to reaching 100 years. In general, centenarians are healthier throughout their 80s and 90s compared with their shorter-lived cohort counterparts. However, while some centenarians exhibited healthy aging by either escaping or delaying disease and functional impairment, over half of centenarians aged with disease and about one-fifth and one-tenth aged with disability and cognitive impairment, respectively, exhibiting aging trajectories similar to nonsurvivors. Although these centenarians are living longer than most of their cohort, they are doing so with poor health and functioning.
It has been suggested that exceptional longevity is achieved by postponing the onset of disease and disability (19). The majority of centenarians postponed physical and cognitive impairment into their 90s and 100s, although less than half made it through their 90s disease-free. Heterogeneity in the survival experience of centenarians suggests that both compression and expansion of morbidity and disability are occurring within the population of centenarians and that there are multiple paths to becoming a centenarian (29).
Our finding that 23% of centenarians escaped major diagnosed diseases is lower than the one-third of escapers reported by Evert and colleagues (13); though the higher disease prevalence among HRS centenarians is more consistent with what has been reported in other centenarian studies that have found rates as high as 66%–72% for cardiovascular disease (5,15). We also found that only 18% of HRS centenarians had escaped disability. The prevalence of independence is much lower in our study compared with the 22%–41% reported in other studies of centenarians (5,8,18,19). Previous research on levels of cognitive functioning among centenarians is less consistent, with reports of the prevalence of cognitive impairment ranging from 37% to 100% (7–9), depending on the population and method of cognitive assessment (30). In our sample of U.S. centenarians, 55% remained cognitively intact over the study period, confirming that dementia is not an inevitable condition of living longer lives (7).
Centenarian aging trajectories differed according to sociodemographic characteristics. Consistent with what has been reported previously, women’s aging trajectories are characterized by more disability and disease than their male counterparts (6,13,14). One explanation for the gender difference is that women have a higher proinflammatory status, relative to older men, and thus a greater risk for accumulating age-related disease and disability (14). We also found that non-Hispanic whites and those with higher levels of education were more likely to remain cognitively intact, confirming that social patterning in cognitive functioning observed at earlier ages persist even among centenarians (31,32).
An increasing number of HRS respondents are surviving to 100 years of age. The HRS has, therefore, become an emergent centenarian study providing an ideal opportunity to study U.S. adults as they reach very old age and gain insights into the health and functioning trajectories of exceptionally long-lived individuals. With its prospective design, a key advantage of the HRS is the ability to compare the aging experience of centenarians with their cohort counterparts who did not survive to 100 years.
There are some important limitations to the study. Our list of diseases and chronic conditions is not exhaustive and is missing important age-related conditions, such as pneumonia, kidney disease, and hip fracture. We do, however, assess the major conditions that are the leading causes of death in the United States (25). Because we did not have information on the exact timing of onset for diseases and functional impairment we were unable to assess the precise amount of time respondents lived with poor health and functioning prior to becoming centenarians. We also lacked information on disease management and severity. Over half of the centenarians in our study were diagnosed with hypertension prior to 100 years of age, but we do not know if their blood pressure was under control. There may be important unobserved heterogeneity in disease severity among delayers and survivors.
Our measures of disease and disability are self-reported and may be subject to reporting error. However, these measures have been validated for use in population surveys and are considered to be robust indicators of health and functioning in older populations (33). Moreover, previous research on older adults has found self-reported chronic diseases and ADL limitations to correlate well with medical records and direct examination (34,35). However, because we rely on self-reported disease and disability we may overlook underlying pathology, even in those centenarians who appear healthy (36).
A common concern in studies of long-lived individuals is bias introduced through selective survival of the sample. At baseline, the HRS sample represented community-dwelling older adults who were likely healthier and more functionally intact than older adults residing in institutional settings, such as nursing homes. Because the baseline sample did not include the institutionalized older adult population, we likely underestimate the baseline health and functioning differences between centenarians and their nonsurviving counterparts. Observed differences between centenarians and nonsurvivors are less subject to this selection bias over the follow-up as individuals are followed into institutions. Finally, previous research suggests there are cohort differences in the aging experience of centenarians (37,38) that we were unable to observe with our small sample. As new centenarian cohorts emerge in the HRS, future studies should investigate the differences in survival pathways between older and younger cohorts.
Funding
National Institutes of Health (K99AG039528, P30AG17265, T32AG0037).
Acknowledgment
The contents of this article are solely the responsibility of the authors and do not necessarily represent the official views of the sponsors.
References
- 1. U.S. Census Bureau, 2010. Census Special Reports. Centenarians: 2010. Washington, DC: C2010SR-03, U.S. Government Printing Office; 2012. [Google Scholar]
- 2. Bell FC, Miller ML. Life Tables for the United States Social Security Area, 1900–2100. Baltimore, MD: Social Security Administration, Office of the Chief Actuary; 2002. [Google Scholar]
- 3. Projections of the Population by Age and Sex for the United States: 2010 to 2050 (NP2008-T12). Washington, DC: Population Division, US Census Bureau; 2008. [Google Scholar]
- 4. Olshansky SJ, Rudberg MA, Carnes BA, et al. Trading off longer life for worsening health: the expansion of morbidity hypothesis. J Aging Health. 1991;3:194–216. :10.1177/089826439100300205 [Google Scholar]
- 5. Andersen-Ranberg K, Schroll M, Jeune B. Healthy centenarians do not exist, but autonomous centenarians do: a population-based study of morbidity among Danish centenarians. J Am Geriatr Soc. 2001;49:900–908. :10.1046/j.1532-5415.2001.49180.x [DOI] [PubMed] [Google Scholar]
- 6. Andersen-Ranberg K, Christensen K, Jeune B, et al. Declining physical abilities with age: a cross-sectional study of older twins and centenarians in Denmark. Age Ageing. 1999;28:373–377. :10.1093/ageing/28.4.373 [DOI] [PubMed] [Google Scholar]
- 7. Andersen-Ranberg K, Vasegaard L, Jeune B. Dementia is not inevitable: a population-based study of Danish centenarians. J Gerontol B Psychol Sci Soc Sci. 2001;56:P152–P159. :10.1093/geronb/56.3.P152 [DOI] [PubMed] [Google Scholar]
- 8. Gondo Y, Hirose N, Arai Y, et al. Functional status of centenarians in Tokyo, Japan: developing better phenotypes of exceptional longevity. J Gerontol A Biol Sci Med Sci. 2006;61:305–310. [DOI] [PubMed] [Google Scholar]
- 9. Silver MH, Jilinskaia E, Perls TT. Cognitive functional status of age-confirmed centenarians in a population-based study. J Gerontol B Psychol Sci Soc Sci. 2001;56:P134–P140. :10.1093/geronb/56.3.P141 [DOI] [PubMed] [Google Scholar]
- 10. Hitt R, Young-Xu Y, Silver M, et al. Centenarians: the older you get, the healthier you have been. Lancet. 1999;354:652. :10.1016/S0140-6736(99)01987-X [DOI] [PubMed] [Google Scholar]
- 11. Smith DW. Centenarians: human longevity outliers. Gerontologist. 1997;37:200–206. :10.1093/geront/37.2.200 [DOI] [PubMed] [Google Scholar]
- 12. Fries JF. Aging, natural death, and the compression of morbidity. N Engl J Med. 1980;303:130–135. :10.1056/NEJM198007173030304 [DOI] [PubMed] [Google Scholar]
- 13. Evert J, Lawler E, Bogan H, et al. Morbidity profiles of centenarians: survivors, delayers, and escapers. J Gerontol A Biol Sci Med Sci. 2003;58:232–237. :10.1093/gerona/58.3.M232 [DOI] [PubMed] [Google Scholar]
- 14. Franceschi C, Motta L, Valensin S, et al. Do men and women follow different trajectories to reach extreme longevity? Italian Multicenter Study on Centenarians (IMUSCE). Aging (Milano). 2000;12:77–84. :10.1007/BF03339894 [DOI] [PubMed] [Google Scholar]
- 15. Davey A, Elias MF, Siegler IC, et al. Cognitive function, physical performance, health, and disease: norms from the Georgia centenarian study. Exp Aging Res. 2010;36:394–425. :10.1080/0361073X.2010.509010 [DOI] [PMC free article] [PubMed] [Google Scholar]
- 16. Terry DF, Sebastiani P, Andersen SL, et al. Disentangling the roles of disability and morbidity in survival to exceptional old age. Arch Intern Med. 2008;168:277–283. :10.1001/archinternmed.2007.75 [DOI] [PMC free article] [PubMed] [Google Scholar]
- 17. Engberg H, Oksuzyan A, Jeune B, et al. Centenarians—a useful model for healthy aging? A 29-year follow-up of hospitalizations among 40,000 Danes born in 1905. Aging Cell. 2009;8:270–276. :10.1111/j.1474-9726.2009.00474.x [DOI] [PMC free article] [PubMed] [Google Scholar]
- 18. Willcox DC, Willcox BJ, Shimajiri S, et al. Aging gracefully: a retrospective analysis of functional status in Okinawan centenarians. Am J Geriatr Psych. 2007;15:252–256. :10.1097/JGP.0b013e31803190cc [DOI] [PubMed] [Google Scholar]
- 19. Christensen K, McGue M, Petersen I, et al. Exceptional longevity does not result in excessive levels of disability. Proc Natl Acad Sci. 2008;105:13274–13279. :10.1073/pnas.0804931105 [DOI] [PMC free article] [PubMed] [Google Scholar]
- 20. Soldo BJ, Hurd MD, Rodgers WL, et al. Asset and health dynamics among the oldest old: an overview of the AHEAD Study. J Gerontol B Psychol Sci Soc Sci. 1997;52 Spec No:1–20. :10.1093/geronb/52B.Special_Issue.1 [DOI] [PubMed] [Google Scholar]
- 21. Suthers K, Kim JK, Crimmins E. Life expectancy with cognitive impairment in the older population of the United States. J Gerontol B Psychol Sci Soc Sci. 2003;58:S179–S186. :10.1093/geronb/58.3.S179 [DOI] [PubMed] [Google Scholar]
- 22. Elo IT, Preston SH. Estimating African-American mortality from inaccurate data. Demography. 1994;31:427–458. :10.2307/2061751 [PubMed] [Google Scholar]
- 23. Kestenbaum B. A description of the extreme aged population based on improved Medicare enrollment data. Demography. 1992;29:565–580. :10.2307/2061852 [PubMed] [Google Scholar]
- 24. Kestenbaum B, Ferguson BR. Mortality of the extreme aged in the United States in the 1990s, based on improved Medicare data. North Am Actuar J. 2002;6:38–44. :10.1080/10920277.2002.10596055 [Google Scholar]
- 25. Sahyoun NR, Lentzner H, Hoyert D, Robinson KN. Trends in causes of death among the elderly. Aging Trends. 2001;1:1–9. [DOI] [PubMed] [Google Scholar]
- 26. Katz S, Ford AB, Moskowitz RW, et al. Studies of illness in the aged: the index of adl: a standardized measure of biological and psychosocial function. JAMA. 1963;185:914–919. [DOI] [PubMed] [Google Scholar]
- 27. Herzog AR, Wallace RB. Measures of cognitive functioning in the AHEAD study. J Gerontol B Psychol Sci Soc Sci. 1997;52B(Special):37–48. :10.1093/geronb/52B.Special_Issue.37 [DOI] [PubMed] [Google Scholar]
- 28. Crimmins EM, Kim JK, Langa KM, Weir DR. Assessment of cognition using surveys and neuropsychological assessment: the Health and Retirement Study and the Aging, Demographics, and Memory Study. J Gerontol B Psychol Sci Soc Sci. 2011;66 (suppl 1:i162–i171. :10.1093/geronb/gbr048 [DOI] [PMC free article] [PubMed] [Google Scholar]
- 29. Martin P, Hagberg B, Poon LW. Models for studying centenarians and healthy ageing. Asian J Gerontol Geriatr. 2012;7:14–18. [Google Scholar]
- 30. Hagberg B, Bauer Alfredson B, Poon LW, et al. Cognitive functioning in centenarians: a coordinated analysis of results from three countries. J Gerontol B Psychol Sci Soc Sci. 2001;56:P141–151. :10.1093/geronb/56.3.P141 [DOI] [PubMed] [Google Scholar]
- 31. Alley D, Suthers K, Crimmins E. Education and cognitive decline in older Americans. Res Aging. 2007;29:73–94. :10.1177/0164027506294245 [DOI] [PMC free article] [PubMed] [Google Scholar]
- 32. Sloan FA, Wang J. Disparities among older adults in measures of cognitive function by race or ethnicity. J Gerontol B Psychol Sci Soc Sci. 2005;60:P242–P250. :10.1093/geronb/60.5.P242 [DOI] [PubMed] [Google Scholar]
- 33. Wallace RB, Herzog AR. Overview of the health measures in the Health and Retirement Study. J Hum Res. 1995;30:S84–S107. [Google Scholar]
- 34. Simpson CF, Boyd CM, Carlson MC, et al. Agreement between self-report of disease diagnoses and medical record validation in disabled older women: factors that modify agreement. J Am Geriatr Soc. 2004;52:123–127. :10.1111/j.1532-5415.2004.52021.x [DOI] [PubMed] [Google Scholar]
- 35. Guralnik JM, Simonsick EM, Ferrucci L, et al. A short physical performance battery assessing lower extremity function: association with self-reported disability and prediction of mortality and nursing home admission. J Gerontol. 1994;49:M85–M94. :10.1093/geronj/49.2.M85 [DOI] [PubMed] [Google Scholar]
- 36. Berzlanovich AM, Keil W, Waldhoer T, et al. Do centenarians die healthy? An autopsy study. J Gerontol A Biol Sci Med Sci. 2005;60:862–865. :10.1093/gerona/60.7.862 [DOI] [PubMed] [Google Scholar]
- 37. Cho J, Martin P, Margrett J, et al. Cohort comparisons in resources and functioning among centenarians: findings from the Georgia Centenarian Study. Int J Behav Dev. 2012;36:271–278. :10.1177/0165025412439967 [Google Scholar]
- 38. Engberg H, Christensen K, Andersen-Ranberg K, et al. Cohort changes in cognitive function among Danish centenarians. Dement Geriatr Cogn Disord. 2008;26:153–160. :10.1159/000149819 [DOI] [PMC free article] [PubMed] [Google Scholar]