

A small pool of putative switch genes, whose expression is negatively correlated with that of genes outside their community in the network, appear to mark the shift from immature to mature growth.
Abstract
We developed an approach that integrates different network-based methods to analyze the correlation network arising from large-scale gene expression data. By studying grapevine (Vitis vinifera) and tomato (Solanum lycopersicum) gene expression atlases and a grapevine berry transcriptomic data set during the transition from immature to mature growth, we identified a category named “fight-club hubs” characterized by a marked negative correlation with the expression profiles of neighboring genes in the network. A special subset named “switch genes” was identified, with the additional property of many significant negative correlations outside their own group in the network. Switch genes are involved in multiple processes and include transcription factors that may be considered master regulators of the previously reported transcriptome remodeling that marks the developmental shift from immature to mature growth. All switch genes, expressed at low levels in vegetative/green tissues, showed a significant increase in mature/woody organs, suggesting a potential regulatory role during the developmental transition. Finally, our analysis of tomato gene expression data sets showed that wild-type switch genes are downregulated in ripening-deficient mutants. The identification of known master regulators of tomato fruit maturation suggests our method is suitable for the detection of key regulators of organ development in different fleshy fruit crops.
INTRODUCTION
Grapevine (Vitis vinifera) is one of the most important perennial fruit crops, reflecting its commercial value in the wine-making and vinegar industries and the nutritional benefits of table grapes and raisins (McGovern et al., 1997). The vines alternate between the growing and dormant seasons; thus, many developmental events are reiterated. The annual growth cycle involves developmental processes such as shoot elongation, flower cluster initiation, flower development, fruit development, and ripening. During the dormant season, the organs undergo an acclimation process involving a shift from immature to mature growth that allows them to survive freezing temperatures.
Fruit development and ripening occur during the growing season, which involves a double-sigmoid pattern of growth featuring unique developmental, physiological, and biochemical processes that influence the color, texture, flavor, and aroma of the berries (Coombe and Hale, 1973). The onset of ripening is called veraison, and it represents a striking metabolic transition phase, not only for the berry but also for other clustered organs such as the rachis and seeds. Harvest usually marks the end of ripening, but in some cultivars, this is followed by a period of postharvest withering for the production of particular styles of wine.
The economic importance of grapevine has prompted the investigation of molecular factors that regulate growth, development, berry ripening, and particularly the impact of gene expression on quality traits (Tornielli et al., 2011). Recent analysis of the grapevine global gene expression atlas (Fasoli et al., 2012) revealed a clear distinction between vegetative/green and mature/woody sample transcriptomes, suggesting a fundamental shift in global gene expression as the plant switches from the immature to the mature developmental program. Elucidating this global transcriptomic reprogramming, which can be considered a characteristic feature of perennial fruit crops, represents a significant step toward the large-scale characterization of genes governing the key developmental and metabolic processes in grapevine.
Tomato (Solanum lycopersicum) is another valuable fruit crop due to the nutritional properties of the ripe berries (Weier et al., 1982). Like grape berries, tomato fruits become edible after a complex ripening process involving changes in physical and biochemical properties, characterized by a clear transition from a vegetative to a mature phase. However, unlike grapevine, tomato produces fruits that can be used as a model system to study the molecular basis of fruit development and ripening thanks to the availability of efficient transformation methods (Gupta et al., 2009) and well-characterized ripening mutants (Moore et al., 2002; Vrebalov et al., 2002; Manning et al., 2006). The characterization of tomato development has been facilitated by the recently completed genome sequence and transcriptome map (Kumar et al., 2012; Tomato Genome Consortium, 2012).
Ripening in fleshy fruit involves profound changes in metabolism of the tissue surrounding the seed, and both the tomato and grapevine transcriptomes are characterized by a transition from immature to mature development (Karlova et al., 2014). A few genes induce this overall transcriptome reprogramming at the onset of ripening, and gene network analysis offers a powerful tool to unveil the key players. Unlike statistical approaches that focus on global properties of groups of genes as separate entities (clustering methods, principal component analysis, t test, F-test, or nonparametric versions of the Wilcoxon test and Kruskal-Wallis test), network analysis is a global approach that also takes into account relationships among genes.
There are two primary methods used to infer gene networks: Bayesian networks (Pearl, 1988, 2000) and gene coexpression networks (weighted or unweighted) (Zhang and Horvath, 2005). Bayesian networks are created by finding all of the causal relationships among gene expression levels, whereas coexpression networks assume all genes are connected and their strength of connection is quantified by the correlation between expression profiles of gene pairs. Unlike Bayesian networks, gene coexpression networks are undirected. Gene coexpression network analysis is based on the concept of scale-free networks that are in turn founded on connectivity, which describes the relative importance of each gene in the network and reflects how frequently a node interacts with other nodes (for a weighted network, connectivity is defined as the sum of the weights across all edges of a node).
According to node connectivity, genes can be further classified as hub genes (with an extremely high level of connectivity) and non-hub genes. Hubs have proven useful for the characterization of key biological properties such as lethality, modularity, hierarchical organization, and robustness (Albert et al., 2000; Pearl, 2000). Because protein interactions are regulated dynamically both in time and space, two fundamental types of hubs have been identified in protein-protein interaction (PPI) networks (Han et al., 2004): “party hubs,” which interact with most of their partners simultaneously, and “date hubs,” which bind their different partners at different times or locations.
Another important aspect of gene coexpression networks is modularity: highly connected genes in the network are usually involved in the same biological modules or pathways (Stuart et al., 2003; Han et al., 2004). In order to study modularity in complex networks, a new approach known as cartography methodology (Guimerà and Amaral, 2005) has been developed recently, in which nodes are classified into sets of predefined roles depending on their between/within-module connections.
Here, we integrated the cartography (Guimerà and Amaral, 2005) and date/party (Han et al., 2004) approaches in a single method used to analyze coexpression networks. We investigated the deep transcriptome shift that occurs in grapevine, corresponding to the immature-to-mature transition in most organs and tissues (Fasoli et al., 2012). This method allowed us to classify genes according to the extent of correlation with interaction partners. We also identified a class of genes that we termed “fight-club genes,” reflecting their predominantly negatively correlated profile, and within this group a subclass that we termed “switch genes,” which are likely to be key players in large-scale transcriptomic transitions.
The same procedure was also applied to a new RNA-Seq data set representing the preveraison and postveraison developmental phases of five red-berry grapevine varieties, in order to identify switch genes potentially involved in the transition from immature to mature berry development. To demonstrate proof of concept, we also applied the same procedure to two different tomato expression data sets representing different organs (Tomato Genome Consortium, 2012) and a ripening-deficient mutant (Kumar et al., 2012). The identification of known tomato master regulators of fruit maturation allowed us to predict the efficiency with which our method can help to identify key regulators of organ development in fleshy fruit crops.
As a final comment, we note that our methodology is quite general, and it can be used to analyze, in principle, any gene expression data set. We speculate that it can also be used to identify key regulators in different conditions and organisms.
RESULTS
Network Analysis of Genes Involved in the Immature-to-Mature Transition during Grapevine Development Reveals an Important Type of Hub
A previous correlation analysis covering the comprehensive grapevine transcriptome map, which represents the expression of 29,549 genes in 54 different samples, revealed a clear separation between samples representing vegetative/green and mature/woody tissues (Fasoli et al., 2012). This indicated the existence of a major regulatory switch that promotes the transition from the immature to the mature developmental phase. Key players in this transcriptome reprogramming event were sought by analyzing two groups of samples, 25 from mature/woody organs and 27 from green/vegetative organs (Supplemental Data Set 1). Two further samples (pollen and leaves undergoing senescence) were excluded due to their atypical transcriptomes.
We identified 1686 genes showing significant differential expression between vegetative/green and mature/woody samples (Supplemental Figure 1 and Supplemental Data Set 2). Among them, 1220 genes were downregulated but only 466 were upregulated during the developmental transition.
To provide an overview of their roles, the differentially expressed genes (DEGs) were classified on the basis of a manually improved functional annotation (Grimplet et al., 2012; Supplemental Data Set 2). The significantly overrepresented (P < 0.05) functional categories identified for downregulated and upregulated genes (Supplemental Figure 2 and Supplemental Data Set 2) showed that maturation involves the suppression of diverse metabolic processes, including photosynthesis, energy metabolism, carbohydrate metabolism, cellular component organization, and the cell cycle, which are related to vegetative growth. In contrast, only a few pathways were specifically induced, including secondary metabolic processes and responses to biotic stimuli (Supplemental Figure 2 and Supplemental Data Set 2 e). This evidence suggests that the transition to mature growth predominantly involves the suppression of vegetative pathways rather than the activation of mature pathways.
Any of the DEGs discussed above could be directly involved in the regulation of transcriptome reprogramming during the developmental transition to mature growth or the veraison step in berry development. In order to identify potential master regulators of this phase transition, we generated a coexpression network using Pearson correlation as a distance metric. Nodes in the coexpression network represent genes, and the presence of an edge linking two genes means that the correlation between their expression profiles exceeds a given threshold in terms of absolute value. The coexpression network comprised 1660 nodes and 118,784 edges (Figure 1A; Supplemental Data Set 3). We estimated the number of strongly connected components for different correlation values and predicted that the Pearson correlation threshold of 0.8 would largely maintain network integrity (Figure 1B). The Pearson correlation distribution of all mRNA profile pairs revealed a clear bimodal profile (Figure 1C). This supported the presence of a large group of inversely correlated profiles, contrasting with the typical unimodal distribution but in agreement with the gene/tissue bicluster that was found to mirror the transcriptome reprogramming that occurs during the developmental transition (Fasoli et al., 2012).
Figure 1.

Grapevine Coexpression Network.
(A) The correlation network obtained using the grapevine gene expression atlas (Fasoli et al., 2012). Nodes are mRNAs, and a link is present when the absolute value of the Pearson correlation between the expression profiles of two mRNAs is greater than 0.8.
(B) The inverse of the number N of network-connected components is plotted against the correlation threshold. The value 0.8 is the largest threshold value that maintains network integrity.
(C) Pearson correlation distribution of all mRNA profile pairs. Red regions correspond to the most correlated pairs in the network.
We next searched for specific topological properties of the coexpression network using the date/party hub classification system based on the average Pearson correlation coefficients (APCCs) between the expression profiles of each hub and its nearest neighbors (Han et al., 2004). The extent to which hubs are coexpressed with their interaction partners leads to two classifications with characteristic topological properties, i.e., date hubs (low APCC) and party hubs (high APCC). Date hubs have a coordinating role within the network, whereas party hubs act as local hubs (Han et al., 2004). Interestingly, we found that the distribution of APCCs was trimodal, with two peaks representing low and high positive APCC values (mirroring the date and party hub distributions in PPI networks; Han et al., 2004) and a third peak representing negative APCC values (Figure 2). This third peak revealed the presence of a class of hubs that we named fight-club hubs because they are characterized by an average inversely correlated profile with their partner genes. We identified 517 party hubs, 797 date hubs, and 234 fight-club hubs in the grapevine transcriptome (Supplemental Data Set 4, second column). In order to show that the data/party dichotomy is also observed in coexpression networks and in particular that the trimodal behavior of the APCCs was not obtained by chance but is a peculiar feature of these coexpression networks, we calculated the distribution of APCCs in a randomized network generated by keeping node labels constant while shuffling their edges but preserving the degree of each node (Han et al., 2004). The resulting distribution was unimodal with a peak equivalent to a moderate positive APCC value of ∼0.4 (Figure 2). This positive value reflects the predominance of positive compared with negative correlations in the network.
Figure 2.

Average Pearson Correlation Coefficient in Grapevine.
The blue curve is the estimated probability density using a smoothing algorithm with a Gaussian kernel of the APCC for each hub (i.e., node with degree greater than 5) in the correlation network. The distribution of APCCs is trimodal, with two peaks representing low and high positive APCC values (mirroring the date and party hub distributions in PPI networks; Han et al., 2004) and a third peak representing negative APCC values (fight-club hubs). Circular insets illustrate schematic hub interactions: Party hubs are highly correlated with the expression of their partners (i.e., they are colored as their partners), date hubs show more limited coexpression (i.e., they are mostly colored as their partners), and fight-club hubs show mostly negative correlation with their partners (i.e., if the fight-club hub is upregulated [magenta], then most of its partners are downregulated [green] or vice versa). The dashed gray curve represents the APCC for the hubs in a randomized network generated by keeping node labels constant while shuffling their edges but preserving the degree of each node.
Heat Cartography in Grapevine Reveals Switch Genes as Network Bottlenecks
The bimodal correlation distribution for grapevine genes that are differentially expressed between vegetative/green and mature/woody tissues reveals the intrinsic modular structure of the coexpression network, wherein each module can be regarded as a subnetwork with a distinct structure and function. The relationship between structure and function within this coexpression network was investigated by k-means clustering (Steinhaus, 1957; Forgy, 1965; MacQueen, 1967; Hartigan, 1975; Hartigan and Wong, 1979; Lloyd, 1982) leading to the identification of five modules. Node classification can also be reconsidered in terms of topological roles defined by intramodule and intermodule connections (Guimerà and Amaral, 2005). Usually, topological role assignment is based on the computation of two parameters for each node: the within-module degree z and the participation coefficient P (Guimerà and Amaral, 2005). We modified these parameters (renamed zg and Kπ, respectively) to identify genes representing the immature-to-mature transition. The first parameter is a normalized measure of intramodule communication, whereas the second characterizes the mode of communication between nodes in different modules. As previously discussed (Guimerà and Amaral, 2005), the plane is divided into seven regions each defining a specific node role (Figure 3; Supplemental Data Set 4). High zg values correspond to nodes that are hubs within their module (local hubs), whereas low zg values correspond to nodes with few connections within their module. Nodes characterized not only by low zg values but also by high Kπ values show many connections outside their module and, thus, a high node degree. According to a hub definition based on the node degree, these nodes can be classified as global hubs.
Figure 3.

Grapevine Atlas Heat Cartography Map.
The parameters zg and Kπ represent a normalized measure of intramodule communication and the mode of communication between nodes in different modules, respectively. The plane identified by these two parameters is divided into seven regions each defining a specific node role. Each point represents a node in the correlation network of Figure 1A, and the color of the each node corresponds to its APCC value. Roles have been assigned to each node of the correlation network of Figure 1A, according to the heat cartography (each circle corresponds to a node in the network which has been colored according to its APCC value).
These nodes fall into the so-called R4 region of the plot (Figure 3), showing that even crucial nodes can populate this region. By assigning a color proportional to the APCC value of each node (Agarwal et al., 2010), we obtained a heat cartography map of the modular network in which party, date, and fight-club hubs were easily identified by red, orange, and blue coloring, respectively (Figure 3). This map revealed that many fight-club hubs form a small and tightly localized group in the R4 region, characterized by zg values lower than –2 and high Kπ values, describing nodes that are highly connected outside their module (Supplemental Data Set 4). This group comprises 113 genes that we classified as switch genes because they are more strongly linked to inversely correlated rather than positively correlated genes in the network. By drawing the heat cartography for the nodes of the grapevine randomized network, we found a less populated R4 region. However, we observed a predominance of positive correlation and an absolute absence of switch genes (Supplemental Figure 3).
The importance of nodes within a complex network can be determined by evaluating their topological resilience to random breakdown (failure) and to the removal of key hubs (attack) (Albert et al., 2000). Resilience can be evaluated by observing the effect of failure or attack on the characteristic path length (CPL), which is the shortest path connecting each node to other nodes in the network. The removal was implemented by ranking nodes with decreasing degree values and then deleting the first N nodes, where N is the number of the switch genes. In this way, we evaluated how the removal of N switch genes and N hubs affects the CPL. Removing a crucial node (such as a hub) in a scale-free network may cause fundamental edges to break down, thus increasing the CPL.
A scale-free network is characterized by a power law distribution of nodal connectivity, p(k) = k−γ, where γ is a parameter whose value is typically in the range 2 < γ < 3 (Barabasi and Albert, 1999). Thus, the main peculiar feature of a scale-free network is the existence of a few highly connected nodes (hubs) and a lot of poorly connected nodes (non-hubs). In such networks, the removal of standard nodes does not increase the CPL, whereas the removal of one of the few key hubs results in a net increase of the network diameter. Scale-free networks therefore appear to be robust against accidental failures but vulnerable to coordinated attacks (i.e., against hubs) (Albert et al., 2000). After verifying that the grapevine coexpression network is scale-free, we evaluated its resilience in the face of attack, failure, and the breakdown of the key nodes (switch genes). The removal of switch genes had a profound impact on network connectivity by substantially increasing the CPL (Figure 4). This suggests that switch genes are key players in the transcriptional network and play a critical role in plant development.
Figure 4.

Error and Attack Tolerance of the Grapevine Atlas Coexpression Network.
Both panels show changes in the CPL, which is the shortest path connecting each node to other nodes in the network, as a function of the fraction of removed nodes. The total number of removed nodes is 113, which is the number of switches.
(A) Comparison of hub removal (attack) and random removal (failure) on party, date, and fight-club hubs.
(B) Comparison of hub removal that are non-switch genes, random removal (failure) on switch genes. Removing a crucial node (such as a hub) may cause fundamental edges to break down, thus increasing the CPL. The removal of switch genes (red curve) appears to be comparable with the removal of hubs (not including switch genes), highlighting their importance in the network.
Switch Genes Are Negatively Correlated to Vegetative Genes and May Represent Putative MicroRNA Targets
We found that all 113 switch genes were expressed at a low level in vegetative/green tissues but at significantly higher levels in mature/woody organs, suggesting they participate in the regulation of the transition from immature to mature development. We assigned functional annotations to 86 of the switch genes and found that they covered diverse functions, with only secondary metabolism significantly overrepresented, accounting for 14 of the genes (P < 0.05) (Supplemental Data Set 5). Fifteen other genes encoded transcription factors, and nine were assigned a role in carbohydrate metabolism, suggesting these functions are particularly important during the developmental transition. Transcription factors often regulate developmental processes and would be expected to account for many switch genes, so it is surprising that many switch genes encode enzymes.
The switch genes were also connected to 921 other genes, representing more than the 50% of the entire coexpression network. The most connected switch gene was linked to 469 other genes, whereas the least connected was linked to 53 others (Supplemental Data Set 5). All 921 of the neighboring genes showed the opposite expression profile to that of the switch genes. The overrepresented functional categories (P < 0.05) of neighboring genes were identical to those revealed for downregulated genes during the immature-to-mature developmental transition (Supplemental Data Set 5 and Supplemental Figure 4). These processes are typically associated with vegetative growth, suggesting the genes are required during the immature phase and are switched off during the transition to mature growth.
The well-established role of microRNAs (miRNAs) in the regulation of plant development suggested that the switch genes might include potential miRNA targets. To test this hypothesis, we screened the switch genes with the psRNAtarget tool (http://plantgrn.noble.org/psRNATarget/) and duly identified 49 switch genes that may be regulated by miRNAs (Supplemental Data Set 6). We also identified that in the entire grapevine predicted transcriptome, 540 transcripts may be miRNA targets. By applying a hypergeometric test, we found that the list of switch genes was statistically significant enriched in miRNA targets (P < 0.001).
The 49 switches that are regulated by miRNAs belong to diverse functional categories. Interestingly, among the putative miRNA:mRNA pairs, we identified Vv-miR164:NAC33, whose interaction has already been experimentally validated in grapevine (Sun et al., 2012).
Identification of Switch Genes Representing the Immature-to-Mature Transition in Grapevine Berry Development
We applied our pipeline, which consists of identifying fight-club hubs and then applying the heat cartography approach to highlight switch genes, to a new transcriptomic data set, focusing on the berry. In order to identify key genes in the transition from immature to mature development, we used RNA-Seq analysis to generate berry transcriptome profiles from five grapevine red-berry varieties during the two growth phases. Berries were collected at four phenological stages: two representing the immature phase and two representing the maturation phase (Supplemental Data Set 7).
By comparing transcriptomic profiles of berries during the immature and maturation phases, we identified 1883 genes showing significant differential expression (Supplemental Figure 5 and Supplemental Data Set 8). Among them, 1464 genes were downregulated but only 419 were upregulated after the developmental transition. Significantly overrepresented categories (P < 0.05) among the downregulated and upregulated genes showed that the transition from green/immature to ripe/mature berry development involved the modulation of different metabolic processes from those described in the atlas. In particular, photosynthesis, energy metabolism, lipid metabolism, transcriptional regulation, responses to endogenous stimuli, and responses to abiotic stress were downregulated after veraison, whereas only stress response pathways (particularly the response to biotic stress), secondary metabolism, and carbohydrate metabolism were upregulated (Supplemental Figure 6 and Supplemental Data Set 8). These data suggest again that the shift to maturation in the berry predominantly involves the suppression of vegetative pathways rather than the activation of maturation-specific pathways.
In order to identify key genes regulating the metabolic shift in berry development, we generated a coexpression network comprising 1792 nodes and 333,700 edges (Supplemental Figure 7A and Supplemental Data Set 9). The threshold correlation was chosen as a balance between network integrity and the smallest number of links (Supplemental Figure 7B). As observed for the atlas data set, the Pearson correlation distribution of all mRNA profile pairs revealed a clear bimodal profile (Supplemental Figure 7C), supporting the existence of a large group of inversely correlated profiles.
We next searched for specific topological properties of the coexpression network, and again we identified three types of hubs, specifically 1344 party hubs, 80 date hubs, and 251 fight-club hubs (Supplemental Data Set 10, second column). We used k-means clustering to identify three modules, and by assigning a color proportional to the APCC value of each node, we obtained a heat cartography map of the modular network in which the switch genes were easily identified (Figure 5). Switch genes disappear in the randomized network (Supplemental Figure 8). In this case, we identified 190 switch genes that are likely to be involved in the regulation of the grape berry developmental transition.
Figure 5.

Heat Cartography Map for the Grapevine Berry Transcriptome of Five Red-Berry Varieties.
The parameters zg and Kπ represent a normalized measure of intramodule communication and the mode of communication between nodes in different modules, respectively. The plane identified by these two parameters is divided into seven regions each defining a specific node role. Each point represents a node in the correlation network of Supplemental Figure 7A, and the color of each node corresponds to its APCC value. Roles have been assigned to each node, according to the heat cartography described in Methods.
There Are Many Common Switch Genes in the Grapevine Atlas and Berry Transcriptomes
All 190 switch genes in the berry transcriptome were expressed at a low level during the immature phase and were significantly induced at veraison. By assigning functional annotations to 156 of the switch genes, we found they covered diverse functions but that transcription factor activity, cell wall metabolism, and developmental process were significantly overrepresented (P < 0.05) (Supplemental Data Set 11).
The berry developmental switch genes included many that have already been characterized for their major role during berry ripening (Supplemental Data Set 11). For example, we identified switch genes encoding the transcription factors MYBA1, MYBA2, and MYBA3, which induce anthocyanin synthesis at the onset of the ripening by activating the UDP-glucose:flavonoid-3-O-glucosyltransferase gene UFGT (Kobayashi et al., 2004; Lijavetzky et al., 2006; This et al., 2007; Walker et al., 2007). We also identified GST4 (glutathione S-transferase 4), which is also induced by the transcription factors listed above and which contributes to anthocyanin transport to the vacuole (Cutanda-Perez et al., 2009; Gomez et al., 2011). Further switch genes encoded thaumatin and a major latex-like ripening protein (grip61) involved in stress responses, which are both considered to be markers of the onset of the ripening process (Robinson and Davies, 2000). The switch genes also included ethylene responsive factors (ERFs), such as ERF019 and ERF045, the latter of which is known to be upregulated during berry ripening (Licausi et al., 2010). EXPB4 (expansin-like B4) was also classified as switch gene, confirming previous reports of its specific transcriptional activation at the onset of ripening and its putative role in berry softening caused by cell wall modifications (Dal Santo et al., 2013). The identification of transcription factors and enzymes with fundamental roles in berry development at the onset of ripening strongly support the suitability of our approach and indicates that switch genes represent master regulators of development and their direct targets, thus comprising a core function that allows plant organs to complete developmental transition. The berry switch genes were also connected to 1266 other genes, representing ∼70% of the entire coexpression network. As for the grapevine atlas, the overrepresented functional categories of neighboring genes (P < 0.05) were identical to those of downregulated genes after veraison (Supplemental Figure 9 and Supplemental Data Set 11).
Next, we compared the grapevine berry and atlas data sets to compile a list of shared switch genes, revealing 40 switch genes present in both transcriptomes (Table 1). This list included important transcription factors, such as two NAC-domain proteins (NAC33 and NAC60) (Wang et al., 2013), three zinc fingers, one Myb protein, and the lateral organ boundaries domain proteins LOB15 and LOB18, which are required for organ shape determination. These genes are likely to represent the master regulators of the developmental phase transition between vegetative and mature metabolism.
Table 1. List of Switch Genes Shared between the Grapevine Atlas and Berry Transcriptome.
| Switch Gene ID | Annotation | Biological Process | Putative miRNA |
|---|---|---|---|
| VIT_14s0068g01760 | Alcohol dehydrogenase | Carbohydrate metabolic process | |
| VIT_09s0002g06420 | Lactoylglutathione lyase | Carbohydrate metabolic process | |
| VIT_14s0060g00420 | Pyruvate dehydrogenase kinase | Carbohydrate metabolic process | Vv-miR156b/Vv-miR156c/Vv-miR156d/Vv-miR156e/Vv-miR156h/Vv-miR394a/Vv-miR394c/Vv-miR845a/Vv-miR845b |
| VIT_07s0005g01680 | Stachyose synthase | Carbohydrate metabolic process | Vv-miR390 |
| VIT_00s0323g00070 | Pectin methylesterase inhibitor | Cell wall metabolism | |
| VIT_08s0040g01200 | Short-chain-type alcohol dehydrogenase | Cellular process | |
| VIT_14s0066g01710 | Leaf senescence protein | Developmental process | Vv-miR156f/Vv-miR156g/Vv-miR156h/Vv-miR156i/Vv-miR398a/Vv-miR398c |
| VIT_07s0005g02730 | Myb Radialis | Developmental process | Vv-miR2111-5p |
| VIT_01s0011g03670 | Bifunctional nuclease | DNA/RNA metabolic process | Vv-miR3629a-3p/Vv-miR3629b/Vv-miR3629c |
| VIT_18s0072g01010 | Peptide chain release factor eRF subunit 1 | DNA/RNA metabolic process | |
| VIT_08s0058g00410 | Ferritin 1 (FER1) | Generation of energy | Vv-miR3631b-3p |
| VIT_08s0058g00440 | Ferritin | Generation of energy | Vv-miR3631b-3p |
| VIT_16s0098g01150 | Auxin-responsive SAUR29 | Response to hormone stimulus | Vv-miR390 |
| VIT_16s0100g00570 | Dehydration-responsive protein | Response to stress | Vv-miR3633a-5p/Vv-miR482 |
| VIT_02s0025g04280 | Osmotin | Response to stress | Vv-miR408 |
| VIT_02s0025g04340 | Osmotin | Response to stress | Vv-miR3626-5p/Vv-miR479 |
| VIT_02s0087g00930 | (9,10) (9′,10′) Cleavage dioxygenase (CCD4) (VvCCD4b) | Secondary metabolic process | |
| VIT_16s0050g00390 | 4-Coumarate-CoA ligase | Secondary metabolic process | Vv-miR159a/Vv-miR159b/Vv-miR169r/Vv-miR169t/Vv-miR169u |
| VIT_02s0025g02920 | Caffeic acid 3-O-methyltransferase | Secondary metabolic process | Vv-miR172d |
| VIT_01s0127g00680 | SRO2 (similar to rcd one 2) | Secondary metabolic process | Vv-miR3634-3p |
| VIT_14s0068g01360 | GEM-like protein 5 | Signal transduction | |
| VIT_06s0004g07790 | Lateral organ boundaries domain 15 | Transcription factor activity | Vv-miR172d |
| VIT_15s0048g00830 | LOB domain-containing 18 | Transcription factor activity | |
| VIT_19s0027g00230 | NAC domain-containing protein (VvNAC33) | Transcription factor activity | Vv-miR164a/Vv-miR164b/Vv-miR164c/Vv-miR164d |
| VIT_08s0007g07670 | NAC domain-containing protein (VvNAC60) | Transcription factor activity | Vv-miR3626-5p |
| VIT_08s0040g01950 | Zinc-finger (C3HC4-type ring finger) | Transcription factor activity | Vv-miR3633b-5p/Vv-miR447b-3p |
| VIT_14s0219g00040 | Zinc-finger (C3HC4-type ring finger) | Transcription factor activity | |
| VIT_18s0001g01060 | Zinc-finger (C3HC4-type ring finger) | Transcription factor activity | |
| VIT_06s0009g01140 | Amino acid permease | Transport | Vv-miR2111-5p |
| VIT_19s0014g04790 | Organic cation/carnitine transporter4 | Transport | Vv-miR172d/Vv-miR3629a-3p/Vv-miR3629b/Vv-miR3629c |
| VIT_00s0214g00090 | F-box protein PP2-B10 | Vv-miR477 | |
| VIT_12s0057g00310 | Gamete expressed1 (GEX1) | ||
| VIT_08s0007g08840 | Glycosyl transferase HGA1 | ||
| VIT_14s0108g00450 | No hit | Vv-miR156b/Vv-miR156c/Vv-miR156d/Vv-miR408 | |
| VIT_04s0044g01230 | Unknown | ||
| VIT_11s0118g00580 | Unknown | ||
| VIT_06s0004g03910 | Unknown | ||
| VIT_14s0066g01190 | Unknown | Vv-miR3630-3p | |
| VIT_14s0219g00110 | Unknown | ||
| VIT_18s0001g10480 | Unknown |
For each gene, the functional annotation, biological process and hypothetical miRNA regulator are reported.
Other common switches were related to secondary metabolism, including those representing the carotenoid and phenylpropanoid pathways (e.g., carotenoid cleavage dioxygenase), carbohydrate metabolism (e.g., alcohol dehydrogenase, stachyose synthase, and pyruvate dehydrogenase kinase), and stress responses (e.g., two osmotins and one dehydration-responsive protein). Interestingly, we found only one gene related to hormone responses, encoding the auxin-responsive SAUR29 (SMALL AUXIN UP RNA29) protein, which suggests a key role for this hormone in the grapevine developmental transition. We also found that 23 of the common switch genes were candidates for regulation by miRNA (Table 1).
Heat Cartography in Tomato Identifies Genes That Regulate Fruit Ripening
The availability of natural ripening-deficient mutants in tomato has facilitated the identification and characterization of master regulators of ripening, allowing us to test the efficiency of our integrated network strategy. We therefore applied the heat cartography approach to a tomato (S. lycopersicum cv Heinz) transcriptomic data set obtained by next-generation sequencing (Tomato Genome Consortium, 2012).
We matched the procedure used to construct the coexpression network for the grapevine by dividing the samples into two groups: vegetative/green organs (leaf, root, flower, bud, and immature berry at 1, 2, and 3 cm) and mature organs (mature green berry, breaker fruit, and fruit after 10 d of ripening). We identified 1961 genes that were differentially expressed between vegetative/green and mature organs (Supplemental Figure 10 and Supplemental Data Set 12). As observed in the grapevine networks, we identified more downregulated than upregulated genes in mature tissue samples (1736 versus 225), indicating once again that the transition to mature development is characterized more by the suppression of vegetative genes than the induction of genes specific for the mature phase. The resulting coexpression network therefore comprised 1961 nodes and 350,958 edges. Analyzing the distribution of APCCs, we recorded the peak at negative APCC values corresponding to the fight-club hubs (Supplemental Figure 11A). In this case, the peak corresponding to low APCCs (date hubs) was less evident because the number of date hubs was much lower than the number of party hubs.
By assigning a role to each node of the correlation network and a color proportional to its APCC value, we built the heat cartography (Figure 6A) and identified a group of 217 switch genes (corresponding to ∼11% of all DEGs). These were all upregulated during tomato fruit ripening and included many genes with a known direct role in fruit ripening and its regulation (Figure 6B; Supplemental Data Set 13). In particular, we identified the MADS box master regulator RIPENING INHIBITOR (RIN), the FRUITFULL1 (FUL1), the NAC factor NON-RIPENING (NOR), and the SQUAMOSA promoter binding protein COLORLESS NON-RIPENING (CNR) that, together with FUL2 and the AGAMOUS-LIKE TAGL1, constitute the transcription factor network that directly regulate tomato fruit ripening (Roberts et al., 2011). Interestingly, the number of master regulators found among the switch genes was tested for statistical significance using a hypergeometric test. The resulting P value (P < 0.001) shows that the number of master regulator switches we identified is more than would be obtained by chance, validating our network integration approach.
Figure 6.

Heat Cartography Map for Tomato.
(A) Heat cartography map for wild-type tomato fruit.
(B) Heat map for some switch genes that regulate fruit ripening in wild-type tomato plants. Blue shows genes expressed at low levels, and yellow shows genes expressed at high levels. Switch genes are all upregulated during tomato fruit ripening. RIN, RIPENING INHIBITOR; NOR, NON-RIPENING; FUL1, FRUITFULL1; CNR, COLORLESS NON-RIPENING; ACS2 and ACS4, genes for ACC synthase; ACO1, gene for ACC oxidase; E8 and E8-6, genes for ACC oxidase homologs; CBF, C-repeat binding factor; EXP1, expansin; PG2A, polygalacturonase; MAN4, mannan endo-1,4-β-mannosidase; PSY1, phytoene synthase.
Tomato ripening mutants can be used as models to test the roles of switch genes identified by integrated network analysis and to characterize developmental programs that may still occur normally in the mutant. The rin mutant has a severe ripening-defective phenotype characterized by the suppression of genes involved in respiration and ethylene biosynthesis and the inability of fruits to soften and accumulate lycopene (Vrebalov et al., 2002). Recent microarray analysis has identified genes that are differentially expressed between wild-type and rin mutant fruit at three ripening stages (35, 40, and 45 d after planting), corresponding in the wild-type fruit to the immature green, breaker, and red-ripe fruit stages, respectively (Kumar et al., 2012). In this expression data set, the rin mutant is equivalent to a constitutive immature growth stage, whereas the wild-type fruits represent the switch to mature growth. We therefore tested our network integration strategy on this data set to confirm the heat cartography data described above and to determine whether RIN acts as a switch gene during ripening.
We built a coexpression network comprising 1243 nodes and 440,734 edges. A role was assigned to each of these nodes to produce a heat cartography map (Figure 7A). The distribution of APCCs was trimodal, with two peaks representing low and high positive APCC values (the date/party dichotomy) and a third peak representing negative APCC values (Supplemental Figure 11B) corresponding to the fight-club hubs.
Figure 7.

Heat Cartography Map for the Tomato rin Mutant.
(A) Heat cartography maps for rin mutant tomato fruit.
(B) Heat map for some switch genes that regulate fruit ripening in rin mutant tomato plants. Blue shows genes expressed at low levels, and yellow shows genes expressed at high levels. Switch genes were upregulated in wild-type fruits during ripening but downregulated in the rin mutant.
We found 354 switch genes corresponding to ∼30% of the DEGs, almost all of which were upregulated in wild-type fruits during ripening but downregulated in the rin mutant (Supplemental Data Set 14). Interestingly, many of the switch genes (34 genes) we identified were the same as those found in the previous experiment. Among common switches we identified RIN, as expected, and genes encoding other ripening-related transcription factors (NOR and FUL1), together with genes involved in ethylene biosynthesis, fruit softening, and lycopene metabolism, again validating our network integration approach (Figure 7B). However, among the switch genes not identified in the RIN data set were those encoding the transcription factor CNR and three proteins (E8, E8-6, and CBF) all involved in ethylene metabolism. This suggests that these genes also operate in the absence of a functional RIN allele. The parameters and thresholds used to build the heat cartography map for each data set are listed in Supplemental Data Set 15.
DISCUSSION
We developed an integrated approach based on the analysis of topological coexpression network properties to identify putative key regulators of organ phase transition during plant development. We tested our approach on the recently published grapevine global gene expression atlas, which follows the transcriptomic changes in 52 tissues/organs during development, including the transition from vegetative to mature growth (Fasoli et al., 2012). This analysis identified a category of genes, named switch genes, which are significantly upregulated during the developmental transition and inversely correlated with a large number of genes that are suppressed during the mature growth phase. The same approach was used to analyze a new grapevine berry transcriptomic data set in order to identify switch genes representing the transition from the green phase to the maturation phase of berry development. Finally, our topological network analysis was applied to two tomato transcriptomic data sets, allowing the identification of genes that are already known as master regulators of fruit ripening, thus validating the basis of our methodology.
Switch Genes in the Vegetative-to-Mature Transition May Represent the Key Mediators of Transcriptome Reprogramming during Grapevine Organ Development
One of the most important insights gained from the analysis of our grapevine coexpression network was the identification of hubs, herein described as fight-club hubs, characterized by negative average Pearson correlation coefficients with their nearest neighbors. Unlike party hubs, it is therefore likely that fight-club hubs could play a negative regulatory role in grapevine development.
The fight-club hub genes included 113 so-called switch genes, which were predominantly connected outside their module. The analysis of network robustness revealed that switch genes are crucial nodes for network integrity and their removal causes a rapid decrease in the CPL. All of the switch genes were upregulated during the transition to mature/woody development, and they showed strong inverse correlations with genes that are downregulated during the same developmental transition. We found that the transition to the mature development phase was characterized by a larger number of downregulated than upregulated genes, suggesting that many processes are inhibited rather than activated to implement this developmental program.
The switch genes encoded a number of transcription factors, including zinc-fingers, ZFWD2 proteins, and the NAC (NAM, ATAF1/2, and CUP-SHAPED COTYLEDON2 [CUC2]) family proteins NAC33 and NAC60. ZFWD proteins contain a C3H-type zinc finger and seven WD40 repeats, and a role in development has been suggested based on their structural similarity to the Arabidopsis thaliana CONSTITUTIVE PHOTOMORPHOGENESIS1 and PLEIOTROPIC REGULATORY LOCUS1 proteins, which regulate photomorphogenesis (Németh et al., 1998; Torii et al., 1998), whereas NAC transcription factors have been shown to regulate vegetative and reproductive development in Arabidopsis (Raman et al., 2008), tomato (Hendelman et al., 2013), papaya (Carica papaya) (Fabi et al., 2012), and grapevine (Sun et al., 2012; Wang et al., 2013), suggesting a broad role as master regulators of fruit ripening.
Interestingly, the linked genes that are inversely correlated with the transcription factors described above include several positive markers of vegetative/green tissues and several negative markers of mature/woody tissues (Fasoli et al., 2012). Genes involved in photosynthesis are significantly overrepresented among these neighboring genes, particularly ZFWD2, which is inversely correlated with 23 genes encoding photosystem I and II light-harvesting complex and reaction center components. This suggests that ZFWD2 represses photosynthesis-related genes during the transition to mature growth. This transition also involves the downregulation cell cycle regulators, such as the NIMA-related serine/threonine kinases (NEKS). In particular, NEK6 (whose expression is inversely correlated with ZFWD2) is involved in growth, development, and stress responses in Arabidopsis (Zhang et al., 2011). Other examples include cyclins, mitotic proteins, kinesin-related proteins, fibrins, tubulins, and Rho (ROP) family proteins, indicating that the network of regulators and effectors modulate key signaling pathways affecting cell proliferation, apoptosis and gene expression (Berken and Wittinghofer, 2008).
Many switch genes were inversely correlated with members of the transcription factor family SQUAMOSA PROMOTER BINDING PROTEIN (SBP) (Hou et al., 2013). In particular, SBP11 and the high-similarity pair SBP2/SBP15 (nearest neighbors to NAC33) play diverse roles in vegetative development and early-stage berry development, but their expression declines during fruit maturation (Hou et al., 2013). Furthermore, At-SPL9 and At-SPL15 are homologs of Vv-SBP8, and these are expressed in the vegetative shoot apex where they facilitate the juvenile-to-adult phase transition in Arabidopsis (Schwarz et al., 2008).
In addition to the transcription factors discussed above, many switch genes also represented metabolic functions (principally carbohydrate and secondary product metabolism) as well as stress responses during the major shift from vegetative to mature development. The presence of an alcohol dehydrogenase switch gene is one of the most interesting metabolic features of the network because the upregulation of ADH genes is thought to represent the oxidative burst that occurs at the onset of berry ripening (Tesniere et al., 2004). The secondary metabolic processes represented by switch genes include phenylpropanoid biosynthesis (two flavonol synthases) and modification (three caffeic acid O-3-methyltransferases), reflecting the developmental shift toward the production of aromatic compounds. Another metabolic switch gene encoded (9,10) (9ʹ,10ʹ) carotenoid cleavage dioxygenase (CCD4b), whose expression increases dramatically during berry development, proportional to the loss of carotenoids (Young et al., 2012). CCD4b may protect plants against oxidative stress during fruit maturation by promoting the biosynthesis of abscisic acid (Cakir et al., 2003). Another switch gene encodes ALTERNATIVE OXIDASE 1A, which mediates abscisic acid signaling in response to oxidative stress. Additional switch genes involved in stress responses include those encoding thaumatins and osmotins, also known as grape ripening-induced proteins, which protect plants against changes in osmotic potential (Davies and Robinson, 2000).
Taken together, these results suggest that the 113 switch genes represent key metabolic components of the major transcriptome reprogramming during the developmental transition to mature growth. The switch genes seem to act mainly as negative regulators of vegetative metabolic processes such as photosynthesis and cell proliferation.
miRNAs Are Potential Regulators of Grapevine Switch Genes: NAC33:miR164 as a Case Study
MicroRNAs play important roles in plant development and responses to abiotic and biotic stress by pairing with specific mRNAs and causing their cleavage and degradation or blocking protein synthesis (Achard et al., 2004; Jones-Rhoades and Bartel, 2004; Sunkar and Zhu, 2004; Zhang et al., 2005). They are often expressed in a developmentally regulated or tissue-specific manner (Llave et al., 2002a, 2002b; Park et al., 2002; Reinhart et al., 2002; Aukerman and Sakai, 2003; Carrington and Ambros, 2003; Hunter and Poethig, 2003; Palatnik et al., 2003; Chen, 2004; Jones-Rhoades and Bartel, 2004; Juarez et al., 2004; Llave, 2004; Mallory and Vaucheret, 2004; Sunkar and Zhu, 2004; Wang et al., 2004), and their target genes include those encoding other regulators such as transcription factors (Jones-Rhoades et al., 2006). This suggests that plant miRNAs are master regulators of the regulatory hierarchy (Llave et al., 2002a; Mette et al., 2002; Park et al., 2002; Reinhart et al., 2002; Emery et al., 2003; Palatnik et al., 2003; Bao et al., 2004; Chen, 2004; Floyd and Bowman, 2004; Laufs et al., 2004; Mallory and Vaucheret, 2004; Sunkar and Zhu, 2004; Baker et al., 2005; Williams et al., 2005; Jones-Rhoades et al., 2006; Axtell et al., 2011), so we hypothesized that specific miRNAs are likely to act as posttranscriptional regulators of the switch genes.
The 49 switch genes of the vegetative-to-mature transition that were predicted as miRNA targets included the NAC-domain gene NAC33 as a putative target of miR164. Interactions involving miR164 and NAC-domain genes have been experimentally validated and appear to be conserved among many plants. For example, Arabidopsis miR164 targets five NAC-domain mRNAs, including NAC1 (which is directly involved in lateral root emergence), CUC1 and CUC2 (functionally redundant genes that promote boundary formation and maintenance throughout vegetative and reproductive development), and At5g07680 and At5g61430 (Aida et al., 1997; Takada et al., 2001; Mallory et al., 2004). Furthermore, the tomato sly-miR164 spatially and temporally regulates the expression of the CUC2 homolog GOBLET (Blein et al., 2008; Berger et al., 2009) and uncharacterized NAM genes such as Sl-NAM2, which are involved in the establishment of floral boundaries (Hendelman et al., 2013). Finally, maize (Zea mays) miR164 is one of the trans-acting factors that inhibit NAC1, which is involved in lateral root development.
The interaction between miR164 and NAC-domain mRNAs has been experimentally validated in grapevine (Sun et al., 2012), revealing that Vv-miR164 is expressed strongly in leaves (vegetative/green tissues) but only weakly in fruits (mature tissues). The NAC33 expression profile is generally inversely correlated with that of Vv-miR164, which would be expected for a miRNA target (Sun et al., 2012). The recent transcriptome-wide analysis of grapevine miRNAs in six different organs during development revealed the spatiotemporal expression profile of the miRNAs involved in the predicted miRNA/switch gene pairs (Wang et al., 2014). We were therefore able to confirm that 26 switch genes showed the opposite expression profiles to those of their putative miRNA regulators, e.g., Vv-miR166 and ZFWD2 (VIT_13s0047g01130), Vv-miR172d and caffeic acid 3-O-methyltransferase (VIT_02s0025g02920), and Vv-miR482 and dehydration-responsive protein (VIT_16s0100g00570). On the basis of these data, we propose a transcriptional regulatory network in which tissue-specific and stage-specific miRNAs regulate the expression of several switch genes identified by our integrated network analysis (Figure 8). In particular, during the vegetative/green phase of organ development, switch genes are negatively regulated by miRNAs and vegetative genes are expressed. During the switch to the maturation phase, these miRNAs are deactivated, the switch genes are expressed and vegetative genes that are negatively correlated with the switches are suppressed (Figure 8). This hypothesis provides an additional and more immediate level of regulation in the transition from vegetative to mature development.
Figure 8.

Proposed Switch Gene Regulation by miRNAs.
The electric switch on the left side is a schematic representation of the regulation of the switch genes by miRNAs. The analysis of grapevine expression revealed the downregulation of switch genes in vegetative/green tissues and their upregulation in mature/woody tissues. Such genes therefore seem to act as switches in the green/mature transition by changing their state from off to on. Because target cleavage seems to be the dominant mode of action of miRNAs in plants, we hypothesize that the presence of specific miRNAs silences the switch mRNAs (negatively correlated mRNAs), but when the miRNA is downregulated (or absent) the switch gene mRNA accumulates (mature/woody tissues) and as consequence its targets are downregulated. The heat map shows the transcription level of positively and negatively correlated mRNAs with a typical switch. The number of inversely correlated genes far outnumbers the correlated ones, which is consistent with the strong negative value of the APCC, a unique feature of the switch genes.
The Grapevine Berry Switch Genes Mainly Encode Transcription Factors
We applied our method to a new berry transcriptomic data set following the expression profiles of five red-berry varieties during the transition from the green phase to the maturation phase. We identified 190 switch genes, all upregulated during maturation and connected to 1266 negatively correlated genes related to green/vegetative metabolism. Interestingly, transcription factors were significantly overrepresented as a functional category of the berry switch genes. The identification of MYBA1, MYBA2, and MYBA3, already well characterized for their direct and crucial role during the transition to berry ripening (Kobayashi et al., 2004; Walker et al., 2007), strongly supports the robustness of our approach and allows us to propose other transcription factors as potential regulators of the metabolic shift during berry development. Interestingly, we identified four NAC proteins (NAC33 and NAC60, also identified as switch genes in the atlas transcriptome, and NAC11 and NAC13) whose regulatory role in organ development has been proposed in many plant species (Raman et al., 2008; Fabi et al., 2012; Hendelman et al., 2013), including grapevine (Sun et al., 2012; Wang et al., 2013). We also identified two MYB proteins, eight zing-finger proteins (three shared with the atlas switch genes), two WRKY proteins, one bHLH protein, one Agamous-like MADS box protein, and three LATERAL ORGAN BOUNDARIES (LOB) proteins (two shared with the atlas switch genes). All these transcription factors are likely to represent master regulators of the phase transition during berry development.
Several switch genes were found to be known targets of MYB transcription factors, including UFGT, which is a master regulator of berry color (Kobayashi et al., 2004; Lijavetzky et al., 2006; This et al., 2007; Walker et al., 2007), and the anthocyanin transporter GST4 (Cutanda-Perez et al., 2009; Gomez et al., 2011). These findings show that the switch genes include not only putative master regulators of the developmental phase transition but also the direct targets of these regulators. Another 12 switch genes encoded transporters, including the anthoMATE transporter AM2, which was recently shown to regulate the malvidin content of Malbec berries (Muñoz et al., 2014). Further switch genes were found to encode enzymes catalyzing early steps in the phenylpropanoid pathway, e.g., caffeic acid 3-O-methyltransferase and 4-coumarate-CoA ligase, or components of terpenoid and carotenoid metabolism, e.g., CCD4b encoding a carotenoid cleavage dioxygenase that generates typical grape berry aromatic compounds (Young et al., 2012). All three enzymes were also represented by switch genes in the atlas data set.
The berry switch genes also include several encoding proteins involved in auxin and abscisic acid biosynthesis and signaling pathways, which induce berry ripening and color development (Castellarin et al., 2007). Three ethylene response factors were also identified, two of which have already been described (Licausi et al., 2010). Other switch genes encoded proteins involved in cell wall metabolism, which is consistent with the tissue softening and cell expansion that marks the onset of ripening (Coombe and Hale, 1973). These included genes encoding a cellulase, three xyloglucan endotransglucosylase/hydrolases, three korrigan-like endo-1,4-β-glucanases, and five pectin-modifying enzymes such as polygalacturonase, which is involved in fruit softening during apple and tomato maturation (Powell et al., 2003; Atkinson et al., 2012). Another switch gene encoded expansin B4 (EXPB4), which is known to be upregulated in berry flesh and skin during maturation (Dal Santo et al., 2013). Finally, we identified several genes involved in carbohydrate metabolism (glycolysis and sucrose biosynthesis), including an alcohol dehydrogenase, lactoylgluthatione lyase, pyruvate dehydrogenase kinase, and stachiose synthase shared with the atlas switch genes, suggesting that sugar accumulation may promote the maturation phase of development.
Functional annotation of the 1266 neighbors of switch genes showed that, as for the atlas, they include several positive markers of the immature berry, such as photosynthesis-related genes, genes involved in the cell cycle, the generation of energy, and the synthesis of secondary metabolites associated with green berries. Taken together, these data revealed that genes expressed during the immature green phase of development are inhibited after veraison, whereas genes related to sugar accumulation and secondary metabolism are induced. As in the atlas data set, the switch genes appear to regulate the immature-to-mature phase transition by the mass downregulation of target genes rather than the activation of new pathways (Lijavetzky et al., 2006; Deluc et al., 2007; Pilati et al., 2007; Lund et al., 2008; Agudelo-Romero et al., 2013).
The common switch genes in the atlas and berry transcriptomes reveal a core set of regulators of the transition from vegetative to mature organ development. We found that more than half of these common switch genes are putative targets for miRNAs, thus providing a hypothetical higher level of regulation of the grapevine transcriptome during development and suggesting that the transcriptional reprogramming during development is fine-tuned by a relatively small number of miRNAs.
Analysis of Topological Coexpression Networks in Tomato Reveals Master Regulators of Fruit Ripening and Their Hierarchical Relationship
The efficiency of the integrated network analysis approach was difficult to judge in grapevine because little is known about the overall regulation of the developmental transition from vegetative to mature growth. This is not the case in tomato, where many of the key regulators of ripening have already been identified through the analysis of mutants and transgenic lines (Vrebalov et al., 2002; Fujisawa et al., 2013; Karlova et al., 2014). Therefore, the efficiency of our integrated network analysis approach in tomato can be validated externally against existing benchmarks.
The topological coexpression network derived from a tomato transcriptomic data set representing different vegetative organs and ripening fruit revealed the presence of 217 switch genes, including several with known roles in the regulation of fruit ripening (Vrebalov et al., 2002; Bemer et al., 2012; Fujisawa et al., 2013). In particular, we found the MADS box protein RIN, which is one of the earliest regulatory factors involved in ethylene-dependent and ethylene-independent fruit ripening (Vrebalov et al., 2002), the NAC family protein NOR, the MADS box protein FUL1, and the squamosal binding protein-like transcription factor CNR (Bemer et al., 2012; Fujisawa et al., 2013). All these transcription factors are involved in a transcriptional network that promotes ripening by activating many ripening-related genes (Fujisawa et al., 2014; Karlova et al., 2014).
Typical tomato ripening-associated categories are represented by ethylene biosynthesis and perception, carotenoid accumulation, and cell wall metabolism. Tomato produces climacteric fruits because respiration and ethylene production are rapidly induced at the onset of ripening (Alexander and Grierson, 2002). Accordingly, we identified genes directly involved in ethylene perception and metabolism, including two 1-aminocyclopropane-1-carboxylate synthases (ACS2 and ACS4), both directly activated by RIN (Fujisawa et al., 2013), three 1-aminocyclopropane-1-carboxylate oxidases (ACO1, E8, and E8-6), and members of the ERF/AP2 transcription factor family such as LeCBF1 (Zhao et al., 2009). Lycopene metabolism was represented by a switch gene encoding the enzyme phytoene synthase 1 (PSY1), which is the first committed step in carotenoid biosynthesis and represents a well-characterized tomato ripening-related gene regulated by RIN and FUL1 (Fujisawa et al., 2014). Cell wall metabolism was also strongly represented because of its role in fruit softening, with switch genes encoding cell-wall-degrading proteins such as expansin A1 (EXP1), mannan-endo-1-4-β-mannosidase (MAN4), and polygalacturonase (PG2A).
The availably of well-characterized tomato ripening mutants provides an excellent opportunity for the analysis of fleshy fruit development (Gupta et al., 2009). In particular, the ripening-deficient mutant rin provides insights into the transcriptional network that regulates ripening (Vrebalov et al., 2002; Kumar et al., 2012; Fujisawa et al., 2013). We applied our integrated network analysis method to the comparative transcriptome data set obtained from wild-type and rin mutant tomato fruits during ripening, generating a list of switch genes including most of the key regulators and of their direct targets as discussed above. The upregulation of these switch genes during the ripening of wild-type fruit and their concurrent downregulation in never-ripe rin mutant fruits demonstrated once again that our approach can identify putative switch genes that in some cases promote ripening directly but in most cases promote ripening indirectly by suppressing the vegetative development program. Interestingly, the CNR transcription factor gene and the E8, E8-6, and CBF genes involved in ethylene synthesis were not found among switch genes, suggesting they are not direct targets of RIN. Interestingly, although in previous studies RIN was proposed to interact with the CNR promoter (Martel et al., 2011), it was recently demonstrated that RIN did not directly bind the CNR regulative region (Roberts et al., 2011), strongly supporting our findings. Moreover, the inability of RIN to bind to its targets in the absence of CNR hints at a more complex relationship between these two ripening regulators.
The integration of different network methods allowed us to classify genes according to the extent of correlation with interaction partners in the same coexpression network, revealing hubs demonstrating predominantly negative correlations with neighboring genes. Within this classification, we identified a subclass of so-called switch genes that appear to encode key regulators of large-scale transcriptomic transitions, which may in turn be regulated by a small number of miRNAs. The integrated method was applied de novo in grapevine, providing insight into the overall regulation of the recently discovered major developmental transcriptome reprogramming, and specifically to the regulation of phase transition during berry ripening, but the basis of the method was also validated in tomato, resulting in the identification of known master regulators of fruit maturation. The integrated networking method therefore appears to be an ideal strategy to identify key regulators of organ development in fleshy fruit crops.
METHODS
Analyzing Gene Expression Data
Grapevine Atlas
The grapevine gene expression data set was obtained from the NCBI Gene Expression Omnibus (http://www.ncbi.nlm.nih.gov/geo/) series entry GSE36128. It comprises 29,549 grapevine genes (Supplemental Data Set 15) whose expression was quantified using microarrays from 54 samples taken from different tissues and stages. Two outlying samples (pollen and leaves undergoing senescence) were excluded, whereas the other 52 samples were divided into two groups: 25 vegetative/green tissues and 27 mature/woody tissues.
We used a t test and a log2-change filter to select DEGs between the vegetative/green group and the mature/woody group. The log2-change filter corresponds to the 95th percentile of the entire fold-change distribution. Supplemental Data Set 15 shows the value of the threshold corresponding to the log2-change filter we used. Finally, we selected 1686 statistically significant DEGs after a t test corrected for multiple testing using the Benjamini-Hochberg method with a false discovery rate threshold of 0.001 (Klipper-Aurbach et al., 1995).
All grapevine transcripts were annotated against the V1 version of the 12x draft annotation of the grapevine genome (http://genomes.cribi.unipd.it/DATA). Gene Ontology annotations were assigned to switch genes and their neighboring genes using the BiNGO v2.3 plug-in tool in Cytoscape (http://www.cytoscape.org/) v2.6 with PlantGOslim categories. Overrepresented PlantGOslim categories were identified using a hypergeometric test with a significance threshold of 0.05, after Benjamini and Hochberg correction with a false discovery rate of 0.001 (Klipper-Aurbach et al., 1995).
Berry Sampling
Grape berries were collected from five red-skin grapevine (Vitis vinifera) cultivars: Sangiovese, Barbera, Negro amaro, Refosco, and Primitivo, all cultivated during 2011 in the same experimental vineyard (Conegliano, Veneto region, Italy). Samples of berries were harvested at four phenological stages: pea-sized berries (Bbch 75) at ∼20 d after flowering (Pea), berries beginning to touch (Bbch77) just prior to veraison (Touch), softening berries (Bbch 85) at the end of veraison (Soft), and berries ripe for harvest (Bbch 89) (Harv). From each berry sample, three biological replicates were created by pooling three samples of ∼50 berries from different clusters on different plants located in different parts of the vineyard.
Total RNA was extracted from ∼400 mg of berry pericarp tissue (entire berries without seeds) ground in liquid nitrogen, using the Spectrum Plant Total RNA kit (Sigma-Aldrich) with some modifications (Fasoli et al., 2012). Then, all 60 nondirectional cDNA libraries were prepared from 2.5 µg of total RNA using the Illumina TruSeq RNA Sample preparation protocol (Illumina). Single-ended reads of 100 nucleotides were obtained using an Illumina HiSeq 1000 sequencer (average value per sample ± sd: 33,438,747 ± 5,610,087).
The reads were aligned onto the grapevine 12x reference genome PN40024 (Jaillon et al., 2007) using TopHat v2.0.6 with default parameters (Kim et al., 2013). An average of 85.55% of reads was mapped for each sample (Supplemental Data Set 16). Mapped reads were used to reconstruct the transcripts using Cufflinks v2.0.2 (Roberts et al., 2011) and the reference genome annotation V1 (http://genomes.cribi.unipd.it/DATA). All reconstructed transcripts were merged into a single nonredundant list of 29,287 transcripts, using Cuffmerge from the Cufflinks package, which merges transcripts whose reads overlap and share a similar exon structure (or splicing structure) and generates a longer chain of connected exons. Using this novel list of transcripts, the normalized mean expression of each transcript was calculated in fragments per kilobase of mapped reads for each triplicate using the geometric normalization method.
The samples were divided into two groups comprising immature berries (Pea and Touch) and mature berries (Soft and Harvest). The log2-fold changes were computed as the difference between the averages of the log2-scale expression data of the first group and the averages of the log2-scale data of the second group. We used a log2-change filter to select DEGs between the two groups. The log2-change filter corresponds to the 95th percentile of the entire fold-change distribution. We identified 1883 DEGs. Supplemental Data Set 15 shows the value of the threshold corresponding to the log2-change filter we used.
Tomato
The processed and normalized tomato RNA-Seq collection (Tomato Genome Consortium, 2012) was downloaded from the NexGenEx database. The NexGenEx database collection consisted of cleaned and processed reads (H. Bostan and M.L. Chiusano, unpublished data). The data set comprises the genome-wide expression analysis of 20 samples representing 10 stages in duplicate. The stages correspond to the vegetative and reproductive organs at different developmental stages. Each sample was analyzed as two biological replicates, and expression profiles were obtained for 34,727 genes. The samples were divided into two groups comprising vegetative/green tissues (leaf, root, flower, bud, 1-cm fruit, 2-cm fruit, and 3-cm fruit) and three stages of ripening fruit (mature green, breaker fruit, and fruit at 10 d). The log2-fold changes were computed as the difference between the averages of the log2-scale expression data of the first group and the averages of the log2-scale data of the second group. We used a log2-change filter to select DEGs between the two groups. The log2-change filter corresponds to the 95th percentile of the entire fold-change distribution. We identified 1961 differentially expressed genes. Supplemental Data Set 15 shows the value of the threshold corresponding to the log2-change filter we used.
Tomato rin Mutant
The tomato rin mutant microarray expression data (Kumar et al., 2012) were sourced from the NCBI Gene Expression Omnibus data repository (http://www.ncbi.nlm.nih.gov/geo/) under series entry GSE20720. Data represent a fruit stage-specific comparison between different stages of wild-type and rin mutant fruits (18 conditions in total), including three stages of tomato fruit ripening: immature green, breaker, and red-ripe fruit and the chronologically equivalent stages of the nonripened rin mutant fruit. Three biological replicates were available for each stage. The log2-fold changes were computed as the difference between the averages of the log2-scale expression data of the rin mutant samples and the averages of the log2-scale data of the wild-type samples. We used a log2-change filter to select DEGs between the rin mutant and wild-type samples. The log2-change filter corresponds to the 95th percentile of the entire fold-change distribution. Supplemental Data Set 15 shows the value of the threshold corresponding to the log2-change filter we used. We identified 1259 genes that were differentially expressed between the wild-type fruits and the rin mutant.
Building Gene Coexpression Networks
For each data set, we built a gene coexpression network of the DEGs using the Pearson correlation between gene expression profiles as the distance metric: two nodes/genes were connected if the absolute value of the Pearson correlation between their corresponding expression profiles was greater than a given threshold. The choice of the threshold was not trivial: the higher the threshold (i.e., the greater the correlation and the smaller the distance between gene expression profiles), the lower the number of links. Thus, increasing the threshold increases the number of connected components in the network. As a consequence, a reasonable threshold should reflect an appropriate balance between the number of connected components and the distances between gene expression profiles. Thus, we chose as a threshold the 85th percentile of the distribution of the Pearson correlation coefficients. Supplemental Data Set 15 shows the value of the threshold we used for each data set and the number of nodes in each gene coexpression network.
Finding the Community Structure of a Network
A traditional method for detecting community structure in networks is a k-means clustering algorithm (Steinhaus, 1957; Forgy, 1965; MacQueen, 1967; Hartigan, 1975; Hartigan and Wong, 1979; Lloyd, 1982), which partitions n observations/objects (corresponding, in our case, to the genes/nodes of the coexpression network) into N clusters, where N must be decided a priori. The goal of clustering is typically expressed by an objective function that depends on the proximities of the objects to each other or to the cluster centroids, e.g., by minimizing the squared distance of each object to its closest centroid. We used the following definition for our distance measurement:
 |
where  is the Pearson correlation between expression profiles of nodes x and y. Two nodes are close in the network (
 ) if they are highly correlated (
 ), whereas two nodes are far apart in the network (
 ) if they are highly anticorrelated (
 ). As the objective function, which measures the quality of clustering, we used the sum of the squared error (SSE). This is formally defined as follows:
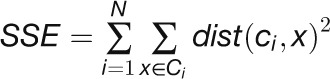 |
where N is the number of the clusters, Ci is the ith cluster,  is an object in the
  cluster, and is the centroid of the cluster given by
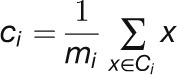 |
where mi is the number of objects in the ith cluster. Given two different sets of clusters produced by two different runs of k-means, the one with the smallest SSE was preferred. Finally, the position of the elbow in the SSE plot as function of N suggests the correct number of clusters (i.e., the value of N). Table 1 shows the number of clusters that we found for each data set.
Building the Heat Cartography Map
Using a cartographic representation of a network (Guimerà and Amaral, 2005), nodes were classified into a small number of system-independent universal roles on the basis of their intercluster and intracluster connectivity. Nodes with similar roles are expected to have similar relative within-module connectivities.
We used modified z and P parameters (Guimerà and Amaral, 2005), renamed  and
and  , respectively, to allow the identification of genes characterizing the immature-to-mature transition. These genes appear to interact mainly outside their community; thus, they will populate the R4 region, which is characterized by nodes with fewer than 35% of their links within the module (P > 0.8). However, the original definition of P appears to approach to a maximum value when links are uniformly distributed among modules (i.e.,
  , where N is the number of modules). In all our data sets, the maximum number of clusters was 5; thus, Pmax = 0.8, corresponding to the lower bound of the R4 region. As a consequence, if we used the original approach, we would have obtained an empty R4 region.
We defined the within-module degree , which measures the connectivity of a node i to other nodes in the module, as follows:
 |
where  is the number of links of node i to other nodes in its module
  ,
,  , and
, and  are the average and sd of the degree distribution of all nodes in the module
  .
.
Different roles can also arise because of the connections of a node to modules other than its own: two nodes with the same  can play different roles if one of them is connected to several nodes in other modules when the other is not. We defined the clusterphobic coefficient
 of node i as follows:
 |
where  is the number of links of node i to nodes in module
  , and
, and  is the total degree of node i in the network. The clusterphobic coefficient of a node is ∼1 if its links are mostly outside its module and 0 if its links are only within its own module. The role of a node can be determined by its within-module degree and its clusterphobic coefficient, which define how the node is positioned in its own module and in the context of other modules. Nodes having a
  are identified as “module hubs,” whereas nodes with
 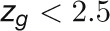 are considered as “module non-hubs.”
Taking into account the clusterphobic coefficient, the module non-hubs can be divided into four regions and, thus, into four roles: (1) ultraperipheral nodes (region R1), if a node has all links within its module  ; (2) peripheral nodes (region R2), if a node has at least 60% of its links within the module
  ; (3) non-hub connectors (region R3), if a node has 45 to 60% of its links within the module
  ; (4) non-hub kinless nodes (R4), if a node has fewer than 45% of its links within the module
  . Non-hub kinless nodes cannot be clearly assigned to a single module, hence their name.
Taking into account the clusterphobic coefficient, the module hub nodes can be divided into three regions and, thus, into three roles: (1) provincial hubs (region R5), if a hub has at least five-sixths of its links within the module  ; (2) connector hubs (region R6), if a hub has at least half of its links within the module
  ; (3) kinless hubs (region R7), if a hub has fewer than half of its links within the module
  and it cannot be clearly associated with a single module. To build the heat cartography map, we considered only those nodes with a local degree not equal to zero. This slightly reduces the number of nodes shown in the heat cartography map with respect to the number of nodes in the original coexpression network.
The definition of module hubs reflects the definition of the within-module degree  , which is a local feature. In contrast, the common definition of hubs as nodes with an extremely high level of connectivity represents a topological property on a global scale. In order to distinguish hubs from module hubs, we defined them as “global hubs.”
To classify global hubs, we extended the original date/party dichotomy used for PPI networks (Han et al., 2004) to the gene coexpression networks, and similarly we defined global hubs as nodes with five or more connections. For each global hub, we computed the APCCs between the expression profiles of the global hub and of its nearest neighbors. These APCCs followed a trimodal distribution, which allowed us to identify fight-club hubs in addition to the previously described date and party hubs (Figure 2).
In order to build the cartographic heat map, we evaluated the APCC value for each node of the coexpression network and colored each node in the plane identified by  and
and  according to the APCCs (Figure 3). Fight-club hubs in the heat cartography map are nodes with negative APCC values but a degree of at least five.
Accession Numbers
The grapevine berry RNA-Seq data are MIAME compliant and have been deposited in a MIAME-compliant database (Gene Expression Omnibus [http://www.ncbi.nlm.nih.gov/geo/] accession number GSE62744) at the National Center for Biotechnology Information. The reference tomato raw collection is stored on the NCBI DRA archive (trace.ddbj.nig.ac.jp/DRASearch/) under accession number SRP010775.
Supplemental Data
The following materials are available in the online version of this article.
Supplemental Figure 1. Heat Map of the 1686 Genes with Significant Differential Expression between Vegetative/Green and Mature/Woody Tissues in Grapevine Plants (Atlas Data Set).
Supplemental Figure 2. The Significantly Overrepresented Functional Categories of the 1220 Differentially Expressed Genes during the Grapevine Developmental Transition (Atlas Data Set).
Supplemental Figure 3. Heat Cartography Map for the Grapevine Atlas (Randomized Network).
Supplemental Figure 4. The Significantly Overrepresented Functional Categories of the 921 Neighbors of Grapevine Switch Genes (Atlas Data Set).
Supplemental Figure 5. Heat Map of the 1883 Genes with Significant Differential Expression between the Green and Maturation Phases during Berry Development in Five Red-Berry Grapevine Varieties.
Supplemental Figure 6. The Significantly Overrepresented Functional Categories of Differentially Expressed Genes during the Grapevine Berry Developmental Transition.
Supplemental Figure 7. Grapevine Berry Coexpression Network.
Supplemental Figure 8. Heat Cartography Map for the Berry Transcriptome of Five Red-Berry Grapevine Varieties (Randomized Network).
Supplemental Figure 9. The Significantly Overrepresented Functional Categories of the 1266 Neighbors of Grapevine Berry Switch Genes.
Supplemental Figure 10. Heat Map of the 1961 Genes with Significant Differential Expression between Vegetative/Green and Mature/Woody Tissues in Wild-Type Tomato Plants.
Supplemental Figure 11. Distribution of Average Pearson Correlation Coefficients in Wild-Type Tomato and the rin Mutant.
The following materials have been deposited in the DRYAD repository under accession number http://dx.doi.org/10.5061/dryad.5h979.
Supplemental Data Set 1. List of the 25 Vegetative/Green Tissues and the 27 Mature/Woody Tissues Used to Create the Grapevine Expression Atlas.
Supplemental Data Set 2. List of the 1686 Genes with Significant Differential Expression between Vegetative/Green and Mature/Woody Tissues in Grapevine Plants (Atlas Data Set), Their Fold Changes, and Functional Annotations.
Supplemental Data Set 3. The Grapevine Coexpression Network (Atlas Data Set) Comprising 1660 Nodes and 118,784 Edges, Visually Represented in Figure 1A.
Supplemental Data Set 4. List of the Nodes Represented in the Heat Cartography Map (Figure 3) Listing All Attributes (Atlas Data Set).
Supplemental Data Set 5. List of the 113 Grapevine Switch Genes and Their 921 Neighbors (Atlas Data Set).
Supplemental Data Set 6. List of the 49 Putative miRNA Target Genes among the Grapevine Switch Genes Identified Using the psRNAtarget Tool (http://plantgrn.noble.org/psRNATarget/) (Atlas Data Set).
Supplemental Data Set 7. List of the 20 Berry Samples Used to Create the Grapevine Berry Expression RNA-Seq Data Set.
Supplemental Data Set 8 . List of the 1883 Genes with Significant Differential Expression between the Green and Mature Berry Phases, Their Fold Changes, and Functional Annotations.
Supplemental Data Set 9. The Grapevine Berry Coexpression Network Comprising 1792 Nodes and 333,700 Edges, Visually Represented in Supplemental Figure 7A.
Supplemental Data Set 10. List of the Nodes Represented in the Heat Cartography Map (Figure 5) Listing All Attributes (Berry Data Set).
Supplemental Data Set 11. List of the 190 Grapevine Switch Genes and Their 1265 Neighbors (Berry Data Set).
Supplemental Data Set 12. List of the 1961 Genes Differentially Expressed between Vegetative/Green and Mature Tomato Organs, Their Fold Changes, and Functional Annotations.
Supplemental Data Set 13. Annotated List of the 217 Switch Genes in the Processed and Normalized Tomato RNA-Seq Collection.
Supplemental Data Set 14. List of the 354 Switch Genes Identified in the Tomato rin Mutant Data Set and Their Functional Annotations.
Supplemental Data Set 15. Parameters and Thresholds Used to Build the Heat Cartography Maps for Each Data Set.
Supplemental Data Set 16. Postsequencing Analysis of Raw Reads Obtained from RNA-Seq Data Representing Five Red-Berry Grapevine Varieties.
Supplementary Material
Acknowledgments
We thank Mario Altieri for help with RNA-Seq data processing. This work was supported by SysBioNet, Italian Roadmap Research Infrastructures 2012, and by The Epigenomics Flagship Project (Progetto Bandiera Epigenomica), EPIGEN, funded by the Italian Ministry of Education, University and Research (MIUR), and the National Research Council (CNR). This work benefited from the networking activities within the European-funded COST ACTION FA1106 “An integrated systems approach to determine the developmental mechanisms influencing fleshy fruit quality in tomato and grapevine.” Finally, this work was supported by the Completamento del Centro di Genomica Funzionale Vegetale project funded by the CARIVERONA Bank Foundation, by the Valorizzazione dei Principali Vitigni Autoctoni Italiani e dei loro Terroir (Vigneto) project funded by the Italian Ministry of Agricultural and Forestry Policies, and by Joint Project 2012 between Pasqua Vigneti e Cantine and the Biotechnology Department of the University of Verona.
AUTHOR CONTRIBUTIONS
P.P. conceived and designed the research. M.C.P., L.F., F.C., and P.P. performed computational data analysis. M.F., S.Z., M.M., and M.P. performed the biological analysis. All authors wrote the article. P.P. and L.F. made the figures.
Glossary
- PPI
protein-protein interaction
- DEG
differentially expressed gene
- APCC
average Pearson correlation coefficient
- CPL
characteristic path length
- miRNA
microRNA
- SSE
sum of the squared error
Footnotes
Online version contains Web-only data.
Articles can be viewed online without a subscription.
References
- Achard P., Herr A., Baulcombe D.C., Harberd N.P. (2004). Modulation of floral development by a gibberellin-regulated microRNA. Development 131: 3357–3365. [DOI] [PubMed] [Google Scholar]
- Agarwal S., Deane C.M., Porter M.A., Jones N.S. (2010). Revisiting date and party hubs: novel approaches to role assignment in protein interaction networks. PLOS Comput. Biol. 6: e1000817. [DOI] [PMC free article] [PubMed] [Google Scholar]
- Agudelo-Romero P., Erban A., Sousa L., Pais M.S., Kopka J., Fortes A.M. (2013). Search for transcriptional and metabolic markers of grape pre-ripening and ripening and insights into specific aroma development in three Portuguese cultivars. PLoS ONE 8: e60422. [DOI] [PMC free article] [PubMed] [Google Scholar]
- Aida M., Ishida T., Fukaki H., Fujisawa H., Tasaka M. (1997). Genes involved in organ separation in Arabidopsis: an analysis of the cup-shaped cotyledon mutant. Plant Cell 9: 841–857. [DOI] [PMC free article] [PubMed] [Google Scholar]
- Albert R., Jeong H., Barabasi A.-L. (2000). Error and attack tolerance of complex networks. Nature 406: 378–382. [DOI] [PubMed] [Google Scholar]
- Alexander L., Grierson D. (2002). Ethylene biosynthesis and action in tomato: a model for climacteric fruit ripening. J. Exp. Bot. 53: 2039–2055. [DOI] [PubMed] [Google Scholar]
- Atkinson R.G., Sutherland P.W., Johnston S.L., Gunaseelan K., Hallett I.C., Mitra D., Brummell D.A., Schröder R., Johnston J.W., Schaffer R.J. (2012). Down-regulation of POLYGALACTURONASE1 alters firmness, tensile strength and water loss in apple (Malus x domestica) fruit. BMC Plant Biol. 12: 129. [DOI] [PMC free article] [PubMed] [Google Scholar]
- Aukerman M.J., Sakai H. (2003). Regulation of flowering time and floral organ identity by a microRNA and its APETALA2-like target genes. Plant Cell 15: 2730–2741. [DOI] [PMC free article] [PubMed] [Google Scholar]
- Axtell M.J., Westholm J.O., Lai E.C. (2011). Vive la différence: biogenesis and evolution of microRNAs in plants and animals. Genome Biol. 12: 221–234. [DOI] [PMC free article] [PubMed] [Google Scholar]
- Baker C.C., Sieber P., Wellmer F., Meyerowitz E.M. (2005). The early extra petals1 mutant uncovers a role for microRNA miR164c in regulating petal number in Arabidopsis. Curr. Biol. 15: 303–315. [DOI] [PubMed] [Google Scholar]
- Bao N., Lye K.W., Barton M.K. (2004). MicroRNA binding sites in Arabidopsis class III HD-ZIP mRNAs are required for methylation of the template chromosome. Dev. Cell 7: 653–662. [DOI] [PubMed] [Google Scholar]
- Barabasi A.-L., Albert R. (1999). Emergence of scaling in random networks. Science 286: 509–512. [DOI] [PubMed] [Google Scholar]
- Bemer M., Karlova R., Ballester A.R., Tikunov Y.M., Bovy A.G., Wolters-Arts M., Rossetto Pde.B., Angenent G.C., de Maagd R.A. (2012). The tomato FRUITFULL homologs TDR4/FUL1 and MBP7/FUL2 regulate ethylene-independent aspects of fruit ripening. Plant Cell 24: 4437–4451. [DOI] [PMC free article] [PubMed] [Google Scholar]
- Berger Y., Harpaz-Saad S., Brand A., Melnik H., Sirding N., Alvarez J.P., Zinder M., Samach A., Eshed Y., Ori N. (2009). The NAC-domain transcription factor GOBLET specifies leaflet boundaries in compound tomato leaves. Development 136: 823–832. [DOI] [PubMed] [Google Scholar]
- Berken A., Wittinghofer A. (2008). Structure and function of Rho-type molecular switches in plants 46: 380–393. [DOI] [PubMed] [Google Scholar]
- Blein T., Pulido A., Vialette-Guiraud A., Nikovics K., Morin H., Hay A., Johansen I.E., Tsiantis M., Laufs P. (2008). A conserved molecular framework for compound leaf development. Science 322: 1835–1839. [DOI] [PubMed] [Google Scholar]
- Cakir B., Agasse A., Gaillard C., Saumonneau A., Delrot S., Atanassova R. (2003). A grape ASR protein involved in sugar and abscisic acid signaling. Plant Cell 15: 2165–2180. [DOI] [PMC free article] [PubMed] [Google Scholar]
- Carrington J.C., Ambros V. (2003). Role of microRNAs in plant and animal development. Science 301: 336–338. [DOI] [PubMed] [Google Scholar]
- Castellarin S.D., Pfeiffer A., Sivilotti P., Degan M., Peterlunger E., DI Gaspero G. (2007). Transcriptional regulation of anthocyanin biosynthesis in ripening fruits of grapevine under seasonal water deficit. Plant Cell Environ. 30: 1381–1399. [DOI] [PubMed] [Google Scholar]
- Chen X. (2004). A microRNA as a translational repressor of APETALA2 in Arabidopsis flower development. Science 303: 2022–2025. [DOI] [PMC free article] [PubMed] [Google Scholar]
- Coombe B.G., Hale C.R. (1973). The hormone content of ripening grape berries and the effects of growth substance treatments. Plant Physiol. 51: 629–634. [DOI] [PMC free article] [PubMed] [Google Scholar]
- Cutanda-Perez M.C., Ageorges A., Gomez C., Vialet S., Terrier N., Romieu C., Torregrosa L. (2009). Ectopic expression of VlmybA1 in grapevine activates a narrow set of genes involved in anthocyanin synthesis and transport. Plant Mol. Biol. 69: 633–648. [DOI] [PubMed] [Google Scholar]
- Dal Santo S., Tornielli G.B., Zenoni S., Fasoli M., Farina L., Anesi A., Guzzo F., Delledonne M., Pezzotti M. (2013). The plasticity of the grapevine berry transcriptome. Genome Biol. 14: r54. [DOI] [PMC free article] [PubMed] [Google Scholar]
- Davies C., Robinson S.P. (2000). Differential screening indicates a dramatic change in mRNA profiles during grape berry ripening. Cloning and characterization of cDNAs encoding putative cell wall and stress response proteins. Plant Physiol. 122: 803–812. [DOI] [PMC free article] [PubMed] [Google Scholar]
- Deluc L.G., Grimplet J., Wheatley M.D., Tillett R.L., Quilici D.R., Osborne C., Schooley D.A., Schlauch K.A., Cushman J.C., Cramer G.R. (2007). Transcriptomic and metabolite analyses of Cabernet Sauvignon grape berry development. BMC Genomics 8: 429. [DOI] [PMC free article] [PubMed] [Google Scholar]
- Emery J.F., Floyd S.K., Alvarez J., Eshed Y., Hawker N.P., Izhaki A., Baum S.F., Bowman J.L. (2003). Radial patterning of Arabidopsis shoots by class III HD-ZIP and KANADI genes. Curr. Biol. 13: 1768–1774. [DOI] [PubMed] [Google Scholar]
- Fabi J.P., Seymour G.B., Graham N.S., Broadley M.R., May S.T., Lajolo F.M., Cordenunsi B.R., Oliveira do Nascimento J.R. (2012). Analysis of ripening-related gene expression in papaya using an Arabidopsis-based microarray. BMC Plant Biol. 12: 242. [DOI] [PMC free article] [PubMed] [Google Scholar]
- Fasoli M., et al. (2012). The grapevine expression atlas reveals a deep transcriptome shift driving the entire plant into a maturation program. Plant Cell 24: 3489–3505. [DOI] [PMC free article] [PubMed] [Google Scholar]
- Floyd S.K., Bowman J.L. (2004). Gene regulation: ancient microRNA target sequences in plants. Nature 428: 485–486. [DOI] [PubMed] [Google Scholar]
- Forgy E.W. (1965). Cluster analysis of multivariate data: efficiency versus interpretability of classifications. Biometrics 2: 768–769. [Google Scholar]
- Fujisawa M., Nakano T., Shima Y., Ito Y. (2013). A large-scale identification of direct targets of the tomato MADS box transcription factor RIPENING INHIBITOR reveals the regulation of fruit ripening. Plant Cell 25: 371–386. [DOI] [PMC free article] [PubMed] [Google Scholar]
- Fujisawa M., Shima Y., Nakagawa H., Kitagawa M., Kimbara J., Nakano T., Kasumi T., Ito Y. (2014). Transcriptional regulation of fruit ripening by tomato FRUITFULL homologs and associated MADS box proteins. Plant Cell 26: 89–101. [DOI] [PMC free article] [PubMed] [Google Scholar]
- Gomez C., Conejero G., Torregrosa L., Cheynier V., Terrier N., Ageorges A. (2011). In vivo grapevine anthocyanin transport involves vesicle-mediated trafficking and the contribution of anthoMATE transporters and GST. Plant J. 67: 960–970. [DOI] [PubMed] [Google Scholar]
- Grimplet J., Van Hemert J., Carbonell-Bejerano P., Díaz-Riquelme J., Dickerson J., Fennell A., Pezzotti M., Martínez-Zapater J.M. (2012). Comparative analysis of grapevine whole-genome gene predictions, functional annotation, categorization and integration of the predicted gene sequences. BMC Res. Notes 5: 213. [DOI] [PMC free article] [PubMed] [Google Scholar]
- Guimerà R., Amaral L.A.N. (2005). Cartography of complex networks: modules and universal roles. J. Stat. Mech. 2005: a35573. [DOI] [PMC free article] [PubMed] [Google Scholar]
- Gupta V., Mathur S., Solanke A.U., Sharma M.K., Kumar R., Vyas S., Khurana P., Khurana J.P., Tyagi A.K., Sharma A.K. (2009). Genome analysis and genetic enhancement of tomato. Crit. Rev. Biotechnol. 29: 152–181. [DOI] [PubMed] [Google Scholar]
- Han J.-D.J., Bertin N., Hao T., Goldberg D.S., Berriz G.F., Zhang L.V., Dupuy D., Walhout A.J.M., Cusick M.E., Roth F.P., Vidal M. (2004). Evidence for dynamically organized modularity in the yeast protein-protein interaction network. Nature 430: 88–93. [DOI] [PubMed] [Google Scholar]
- Hartigan J.A. (1975). Clustering Algorithms. (New York: John Wiley & Sons; ). [Google Scholar]
- Hartigan J.A., Wong M.A. (1979). Algorithm AS 136: A K-Means Clustering Algorithm. J. R. Stat. Soc. Ser. C Appl. Stat. 28: 100–108. [Google Scholar]
- Hendelman A., Stav R., Zemach H., Arazi T. (2013). The tomato NAC transcription factor SlNAM2 is involved in flower-boundary morphogenesis. J. Exp. Bot. 64: 5497–5507. [DOI] [PMC free article] [PubMed] [Google Scholar]
- Hou H., Li J., Gao M., Singer S.D., Wang H., Mao L., Fei Z., Wang X. (2013). Genomic organization, phylogenetic comparison and differential expression of the SBP-box family genes in grape. PLoS ONE 8: e59358. [DOI] [PMC free article] [PubMed] [Google Scholar]
- Hunter C., Poethig R.S. (2003). miSSING LINKS: miRNAs and plant development. Curr. Opin. Genet. Dev. 13: 372–378. [DOI] [PubMed] [Google Scholar]
- Jaillon O., et al. ; French-Italian Public Consortium for Grapevine Genome Characterization (2007). The grapevine genome sequence suggests ancestral hexaploidization in major angiosperm phyla. Nature 449: 463–467. [DOI] [PubMed] [Google Scholar]
- Jones-Rhoades M.W., Bartel D.P. (2004). Computational identification of plant microRNAs and their targets, including a stress-induced miRNA. Mol. Cell 14: 787–799. [DOI] [PubMed] [Google Scholar]
- Jones-Rhoades M.W., Bartel D.P., Bartel B. (2006). MicroRNAS and their regulatory roles in plants. Annu. Rev. Plant Biol. 57: 19–53. [DOI] [PubMed] [Google Scholar]
- Juarez M.T., Kui J.S., Thomas J., Heller B.A., Timmermans M.C.P. (2004). MicroRNA-mediated repression of rolled leaf1 specifies maize leaf polarity. Nature 428: 84–88. [DOI] [PubMed] [Google Scholar]
- Karlova R., Chapman N., David K., Angenent G.C., Seymour G.B., de Maagd R.A. (2014). Transcriptional control of fleshy fruit development and ripening. J. Exp. Bot. 65: 4527–4541. [DOI] [PubMed] [Google Scholar]
- Kim D., Pertea G., Trapnell C., Pimentel H., Kelley R., Salzberg S.L. (2013). TopHat2: accurate alignment of transcriptomes in the presence of insertions, deletions and gene fusions. Genome Biol. 14: R36. [DOI] [PMC free article] [PubMed] [Google Scholar]
- Klipper-Aurbach Y., Wasserman M., Braunspiegel-Weintrob N., Borstein D., Peleg S., Assa S., Karp M., Benjamini Y., Hochberg Y., Laron Z. (1995). Mathematical formulae for the prediction of the residual beta cell function during the first two years of disease in children and adolescents with insulin-dependent diabetes mellitus. Med. Hypotheses 45: 486–490. [DOI] [PubMed] [Google Scholar]
- Kobayashi S., Goto-Yamamoto N., Hirochika H. (2004). Retrotransposon-induced mutations in grape skin color. Science 304: 982. [DOI] [PubMed] [Google Scholar]
- Kumar R., Sharma M.K., Kapoor S., Tyagi A.K., Sharma A.K. (2012). Transcriptome analysis of rin mutant fruit and in silico analysis of promoters of differentially regulated genes provides insight into LeMADS-RIN-regulated ethylene-dependent as well as ethylene-independent aspects of ripening in tomato. Mol. Genet. Genomics 287: 189–203. [DOI] [PubMed] [Google Scholar]
- Laufs P., Peaucelle A., Morin H., Traas J. (2004). MicroRNA regulation of the CUC genes is required for boundary size control in Arabidopsis meristems. Development 131: 4311–4322. [DOI] [PubMed] [Google Scholar]
- Licausi F., Giorgi F.M., Zenoni S., Osti F., Pezzotti M., Perata P. (2010). Genomic and transcriptomic analysis of the AP2/ERF superfamily in Vitis vinifera. BMC Genomics 11: 719. [DOI] [PMC free article] [PubMed] [Google Scholar]
- Lijavetzky D., Ruiz-García L., Cabezas J.A., De Andrés M.T., Bravo G., Ibáñez A., Carreño J., Cabello F., Ibáñez J., Martínez-Zapater J.M. (2006). Molecular genetics of berry colour variation in table grape. Mol. Genet. Genomics 276: 427–435. [DOI] [PubMed] [Google Scholar]
- Llave C. (2004). MicroRNAs: more than a role in plant development? Mol. Plant Pathol. 5: 361–366. [DOI] [PubMed] [Google Scholar]
- Llave C., Kasschau K.D., Rector M.A., Carrington J.C. (2002a). Endogenous and silencing-associated small RNAs in plants. Plant Cell 14: 1605–1619. [DOI] [PMC free article] [PubMed] [Google Scholar]
- Llave C., Xie Z., Kasschau K.D., Carrington J.C. (2002b). Cleavage of Scarecrow-like mRNA targets directed by a class of Arabidopsis miRNA. Science 297: 2053–2056. [DOI] [PubMed] [Google Scholar]
- Lloyd S.P. (1982). Least square quantization in PCM. IEEE Trans. Inf. Theory 28: 129–137. [Google Scholar]
- Lund S.T., Peng F.Y., Nayar T., Reid K.E., Schlosser J. (2008). Gene expression analyses in individual grape (Vitis vinifera L.) berries during ripening initiation reveal that pigmentation intensity is a valid indicator of developmental staging within the cluster. Plant Mol. Biol. 68: 301–315. [DOI] [PubMed] [Google Scholar]
- MacQueen, J.B. (1967). Some methods for classification and analysis of multivariate observations. In Proceedings of the 5th Berkeley Symposium on Mathematical Statistics and Probability, L.M. Le Cam and J. Neyman, eds (Englewood Cliffs, NJ: University of California Press), pp. 281–297.
- Mallory A.C., Vaucheret H. (2004). MicroRNAs: something important between the genes. Curr. Opin. Plant Biol. 7: 120–125. [DOI] [PubMed] [Google Scholar]
- Mallory A.C., Dugas D.V., Bartel D.P., Bartel B. (2004). MicroRNA regulation of NAC-domain targets is required for proper formation and separation of adjacent embryonic, vegetative, and floral organs. Curr. Biol. 14: 1035–1046. [DOI] [PubMed] [Google Scholar]
- Manning K., Tör M., Poole M., Hong Y., Thompson A.J., King G.J., Giovannoni J.J., Seymour G.B. (2006). A naturally occurring epigenetic mutation in a gene encoding an SBP-box transcription factor inhibits tomato fruit ripening. Nat. Genet. 38: 948–952. [DOI] [PubMed] [Google Scholar]
- Martel C., Vrebalov J., Tafelmeyer P., Giovannoni J.J. (2011). The tomato MADS-box transcription factor RIPENING INHIBITOR interacts with promoters involved in numerous ripening processes in a COLORLESS NONRIPENING-dependent manner. Plant Physiol. 157: 1568–1579. [DOI] [PMC free article] [PubMed] [Google Scholar]
- McGovern P.E., Hartung U., Badler V.R., Glusker D.L., Exner L.J. (1997). The beginnings of wine making and viniculture in the anciant Near East and Egypt. Expedition 39: 3–21. [Google Scholar]
- Mette M.F., van der Winden J., Matzke M., Matzke A.J. (2002). Short RNAs can identify new candidate transposable element families in Arabidopsis. Plant Physiol. 130: 6–9. [DOI] [PMC free article] [PubMed] [Google Scholar]
- Moore S., Vrebalov J., Payton P., Giovannoni J. (2002). Use of genomics tools to isolate key ripening genes and analyse fruit maturation in tomato. J. Exp. Bot. 53: 2023–2030. [DOI] [PubMed] [Google Scholar]
- Muñoz C., Gomez-Talquenca S., Chialva C., Ibáñez J., Martinez-Zapater J.M., Peña-Neira Á., Lijavetzky D. (2014). Relationships among gene expression and anthocyanin composition of Malbec grapevine clones. J. Agric. Food Chem. 62: 6716–6725. [DOI] [PubMed] [Google Scholar]
- Németh K., et al. (1998). Pleiotropic control of glucose and hormone responses by PRL1, a nuclear WD protein, in Arabidopsis. Genes Dev. 12: 3059–3073. [DOI] [PMC free article] [PubMed] [Google Scholar]
- Palatnik J.F., Allen E., Wu X., Schommer C., Schwab R., Carrington J.C., Weigel D. (2003). Control of leaf morphogenesis by microRNAs. Nature 425: 257–263. [DOI] [PubMed] [Google Scholar]
- Park W., Li J., Song R., Messing J., Chen X. (2002). CARPEL FACTORY, a Dicer homolog, and HEN1, a novel protein, act in microRNA metabolism in Arabidopsis thaliana. Curr. Biol. 12: 1484–1495. [DOI] [PMC free article] [PubMed] [Google Scholar]
- Pearl, J. (1988). Probabilistic Reasoning in Intelligent Systems: Networks of Plausible Inference. (San Francisco, CA: Morgan Kaufmann Publishers).
- Pearl, J. (2000). Causality: Models, Reasoning, and Inference. (Cambridge, UK: Cambridge University Press). [Google Scholar]
- Pilati S., Perazzolli M., Malossini A., Cestaro A., Demattè L., Fontana P., Dal Ri A., Viola R., Velasco R., Moser C. (2007). Genome-wide transcriptional analysis of grapevine berry ripening reveals a set of genes similarly modulated during three seasons and the occurrence of an oxidative burst at vèraison. BMC Genomics 8: 428. [DOI] [PMC free article] [PubMed] [Google Scholar]
- Powell A.L., Kalamaki M.S., Kurien P.A., Gurrieri S., Bennett A.B. (2003). Simultaneous transgenic suppression of LePG and LeExp1 influences fruit texture and juice viscosity in a fresh market tomato variety. J. Agric. Food Chem. 51: 7450–7455. [DOI] [PubMed] [Google Scholar]
- Raman S., Greb T., Peaucelle A., Blein T., Laufs P., Theres K. (2008). Interplay of miR164, CUP-SHAPED COTYLEDON genes and LATERAL SUPPRESSOR controls axillary meristem formation in Arabidopsis thaliana. Plant J. 55: 65–76. [DOI] [PubMed] [Google Scholar]
- Reinhart B.J., Weinstein E.G., Rhoades M.W., Bartel B., Bartel D.P. (2002). MicroRNAs in plants. Genes Dev. 16: 1616–1626. [DOI] [PMC free article] [PubMed] [Google Scholar]
- Roberts A., Pimentel H., Trapnell C., Pachter L. (2011). Identification of novel transcripts in annotated genomes using RNA-Seq. Bioinformatics 27: 2325–2329. [DOI] [PubMed] [Google Scholar]
- Robinson S.P., Davies C. (2000). Molecular Biology of grape berry ripening. Aust. J. Grape Wine Res. 6: 175–188. [Google Scholar]
- Schwarz S., Grande A.V., Bujdoso N., Saedler H., Huijser P. (2008). The microRNA regulated SBP-box genes SPL9 and SPL15 control shoot maturation in Arabidopsis. Plant Mol. Biol. 67: 183–195. [DOI] [PMC free article] [PubMed] [Google Scholar]
- Steinhaus H. (1957). Sur la division des corps matériels en parties. Bulletin de l'Académie Polonaise des Sciences 4: 801–804. [Google Scholar]
- Stuart J.M., Segal E., Koller D., Kim S.K. (2003). A gene-coexpression network for global discovery of conserved genetic modules. Science 302: 249–255. [DOI] [PubMed] [Google Scholar]
- Sun X., Korir N.K., Han J., Shangguan L.-F., Kayesh E., Leng X.-P., Fang J.-G. (2012). Characterization of grapevine microR164 and its target genes. Mol. Biol. Rep. 39: 9463–9472. [DOI] [PubMed] [Google Scholar]
- Sunkar R., Zhu J.K. (2004). Novel and stress-regulated microRNAs and other small RNAs from Arabidopsis. Plant Cell 16: 2001–2019. [DOI] [PMC free article] [PubMed] [Google Scholar]
- Takada S., Hibara K., Ishida T., Tasaka M. (2001). The CUP-SHAPED COTYLEDON1 gene of Arabidopsis regulates shoot apical meristem formation. Development 128: 1127–1135. [DOI] [PubMed] [Google Scholar]
- Tesniere C., Pradal M., El-Kereamy A., Torregrosa L., Chatelet P., Roustan J.P., Chervin C. (2004). Involvement of ethylene signalling in a non-climacteric fruit: new elements regarding the regulation of ADH expression in grapevine. J. Exp. Bot. 55: 2235–2240. [DOI] [PubMed] [Google Scholar]
- This P., Lacombe T., Cadle-Davidson M., Owens C.L. (2007). Wine grape (Vitis vinifera L.) color associates with allelic variation in the domestication gene VvmybA1. Theor. Appl. Genet. 114: 723–730. [DOI] [PubMed] [Google Scholar]
- Tomato Genome Consortium (2012). The tomato genome sequence provides insights into fleshy fruit evolution. Nature 485: 635–641. [DOI] [PMC free article] [PubMed] [Google Scholar]
- Torii K.U., McNellis T.W., Deng X.W. (1998). Functional dissection of Arabidopsis COP1 reveals specific roles of its three structural modules in light control of seedling development. EMBO J. 17: 5577–5587. [DOI] [PMC free article] [PubMed] [Google Scholar]
- Tornielli G.B., Zamboni A., Zenoni S., Delledonne M., Pezzotti M. (2011). Transcriptomics and metabolomics for the analysis of grape berry development. In The Biochemistry of the Grape Berry, H. Geros, M.M. Chavez, and S. Delrot, eds (Sharjan, United Arab Emirates: Bentham Science Publishers), pp. 218–240. [Google Scholar]
- Vrebalov J., Ruezinsky D., Padmanabhan V., White R., Medrano D., Drake R., Schuch W., Giovannoni J. (2002). A MADS-box gene necessary for fruit ripening at the tomato ripening-inhibitor (rin) locus. Science 296: 343–346. [DOI] [PubMed] [Google Scholar]
- Walker A.R., Lee E., Bogs J., McDavid D.A., Thomas M.R., Robinson S.P. (2007). White grapes arose through the mutation of two similar and adjacent regulatory genes. Plant J. 49: 772–785. [DOI] [PubMed] [Google Scholar]
- Wang C., Leng X., Zhang Y., Kayesh E., Zhang Y., Sun X., Fang J. (2014). Transcriptome-wide analysis of dynamic variations in regulation modes of grapevine microRNAs on their target genes during grapevine development. Plant Mol. Biol. 84: 269–285. [DOI] [PubMed] [Google Scholar]
- Wang N., Zheng Y., Xin H., Fang L., Li S. (2013). Comprehensive analysis of NAC domain transcription factor gene family in Vitis vinifera. Plant Cell Rep. 32: 61–75. [DOI] [PubMed] [Google Scholar]
- Wang X.J., Reyes J.L., Chua N.H., Gaasterland T. (2004). Prediction and identification of Arabidopsis thaliana microRNAs and their mRNA targets. Genome Biol. 5: R65. [DOI] [PMC free article] [PubMed] [Google Scholar]
- Weier T.E., Stocking C.R., Barbour M.G., Rost T.L. (1982). Botany: An Introduction to Plant Biology. (New York: Wiley; ). [Google Scholar]
- Williams L., Grigg S.P., Xie M., Christensen S., Fletcher J.C. (2005). Regulation of Arabidopsis shoot apical meristem and lateral organ formation by microRNA miR166g and its AtHD-ZIP target genes. Development 132: 3657–3668. [DOI] [PubMed] [Google Scholar]
- Young P.R., Lashbrooke J.G., Alexandersson E., Jacobson D., Moser C., Velasco R., Vivier M.A. (2012). The genes and enzymes of the carotenoid metabolic pathway in Vitis vinifera L. BMC Genomics 13: 243. [DOI] [PMC free article] [PubMed] [Google Scholar]
- Zhang B., Horvath S. (2005). A general framework for weighted gene co-expression network analysis. Stat. Appl. Genet. Mol. Biol. 4: 1. [DOI] [PubMed] [Google Scholar]
- Zhang B., et al. (2011). NIMA-related kinase NEK6 affects plant growth and stress response in Arabidopsis. Plant J. 68: 830–843. [DOI] [PubMed] [Google Scholar]
- Zhang B.H., Pan X.P., Wang Q.L., Cobb G.P., Anderson T.A. (2005). Identification and characterization of new plant microRNAs using EST analysis. Cell Res. 15: 336–360. [DOI] [PubMed] [Google Scholar]
- Zhao D., Shen L., Fan B., Yu M., Zheng Y., Lv S., Sheng J. (2009). Ethylene and cold participate in the regulation of LeCBF1 gene expression in postharvest tomato fruits. FEBS Lett. 583: 3329–3334. [DOI] [PubMed] [Google Scholar]
Associated Data
This section collects any data citations, data availability statements, or supplementary materials included in this article.