

Histone mobility is regulated during development in Arabidopsis roots, being higher in the division zone and lower in stem cells and differentiated cells, mainly due to changes in histone acetylation.
Abstract
The mechanism whereby the same genome can give rise to different cell types with different gene expression profiles is a fundamental problem in biology. Chromatin organization and dynamics have been shown to vary with altered gene expression in different cultured animal cell types, but there is little evidence yet from whole organisms linking chromatin dynamics with development. Here, we used both fluorescence recovery after photobleaching and two-photon photoactivation to show that in stem cells from Arabidopsis thaliana roots the mobility of the core histone H2B, as judged by exchange dynamics, is lower than in the surrounding cells of the meristem. However, as cells progress from meristematic to fully differentiated, core histones again become less mobile and more strongly bound to chromatin. We show that these transitions are largely mediated by changes in histone acetylation. We further show that altering histone acetylation levels, either in a mutant or by drug treatment, alters both the histone mobility and markers of development and differentiation. We propose that plant stem cells have relatively inactive chromatin, but they keep the potential to divide and differentiate into more dynamic states, and that these states are at least in part determined by histone acetylation levels.
INTRODUCTION
The development of a multicellular organism demands the proper differentiation of pluripotent stem cells into a variety of specialized cell types. Plants have a remarkable ability to generate new organs from founder cells in their apical meristems, populations of dividing cells, which contain stem cells. In the Arabidopsis thaliana root, the meristem or division zone consists of actively dividing, undifferentiated cells that emerge from stem cells located at the root tip (Dolan et al., 1993). When cell division ceases, cells first start to increase in length, forming the elongation zone; subsequently, the appearance of root hairs demarcates the differentiation zone where cells assume their final fate and are fully differentiated (Supplemental Figure 1A). Clonal analysis showed that the ultimate source of cells in the Arabidopsis root meristem is the quiescent center (QC), a group of cells that divide infrequently and from which all tissue systems of the root originate (Kidner et al., 2000). The QC cells are surrounded by other types of stem cells (initial cells) that divide more often to regenerate themselves and produce cells that give rise to all the different tissues that make up the root body (van den Berg et al., 1997; Wildwater et al., 2005). Therefore, the main body of the root has a simple radial organization (Dolan et al., 1993), consisting of concentric tissue layers with different functional properties; from outside to inside, these are the epidermis, cortex, endodermis, pericycle, and the centrally located stele (Supplemental Figure 2).
Chromatin structure is now recognized to regulate gene activity, playing a crucial role in cell differentiation and development. In cultured animal cells, the transition from undifferentiated to differentiated or partially differentiated cells has been shown to involve dramatic changes in the dynamics of chromatin proteins (Phair and Misteli, 2000; Meshorer et al., 2006).
Chromatin organization within the nucleus is mediated by structural proteins, the most prominent of which are the core and linker histones, basic proteins that are responsible for the vast degree of packaging of the DNA within the nucleus of all eukaryotes. The nucleosome, consisting of an octamer of four core histones (H2A, H2B, H3, and H4) complexed with 147 bp of DNA, has long been considered a very stable building block of chromatin. There are 14 contact points between histones and DNA (Luger et al., 1997); these interactions make the nucleosome one of the most stable protein-DNA complexes under physiological conditions. The nucleosome can therefore be considered a hindrance to transcription and must be mobilized to allow the access of RNA polymerase II (Pol II) to the underlying DNA sequences. In fact, studies in several systems have established that histones are in continuous turnover within the chromatin (Kimura and Cook, 2001; Dion et al., 2007; Jamai et al., 2007; Henikoff, 2008). Histone modifications and histone variant incorporation are some of the mechanisms that regulate this dynamic process (Li et al., 2007).
However, there is little data about the regulation of histone dynamics during differentiation of a multicellular organism. Here, we investigated the role of histone-DNA interactions in plant cell differentiation. We demonstrated that cell differentiation is accompanied by global changes in histone-DNA interactions during Arabidopsis root development. In addition, we showed that these interactions are modulated by histone acetylation and that manipulation of histone acetylation causes corresponding changes in development.
RESULTS
Dynamics of Histone-DNA Interactions during Root Development
To determine whether histone-DNA interactions change during meristem cell differentiation, we analyzed the in vivo binding properties of histone proteins using fluorescence recovery after photobleaching (FRAP). To visualize H2B in living cells, Arabidopsis lines stably expressing H2B-GFP (green fluorescent protein) under a constitutive promoter were established (Supplemental Figure 1A). Mitotic figures showed that all H2B-GFP proteins were associated with chromosomes (Supplemental Figure 1B and Supplemental Movie 1), confirming that the expressed protein was correctly incorporated into chromatin and behaved like endogenous H2B protein. Importantly, these plants didn’t show any obvious phenotype.
We then characterized the dynamics of H2B exchange in epidermal cells from the different developmental regions of the Arabidopsis root (Figure 1A). The FRAP data for H2B-GFP showed that the half-time (t1/2) for recovery in the division zone was significantly less than that in the elongation or differentiation zones (Figure 1B, Table 1). Quantitative analysis of the FRAP data also showed that the size of the mobile H2B fraction was highest in the division zone and decreased successively in the elongation zone and the differentiation zone (Figure 1C).
Figure 1.

FRAP Analysis of H2B-GFP Reveals Higher Mobility in Meristematic Cells.
(A) Representative fluorescence changes in nuclei expressing H2B-GFP in different developmental zones of the root. A region of 2 μm in diameter was bleached and recovery followed over 60 min. Bars = 5 μm.
(B) Quantitative analysis of FRAP experiments within the different developmental zones. Values represent means ± se from at least 10 cells.
(C) Estimated mobile fractions. Values represent means ± se from at least 10 cells. Student’s t test, *P < 0.05, **P < 0.01, and ***P < 0.001.
(D) FRAP curves for H2B-GFP in the division zone, on 4-d-old hag1-6 (black circles) and on overnight TSA-treated (100 ng/mL) plants (triangles). The Col-0 fitted curve from the (B) division zone is shown in red for comparison.
(E) FRAP curves for H2B-GFP in the differentiation zone, on 4-d-old hag1-6 (black circles) and on overnight TSA-treated (100 ng/mL) plants. The Col-0 fitted curve from the (B) differentiation zone is shown in red for comparison. Values represent mean ± se from at least 10 cells in all FRAP curves.
Table 1. FRAP Table for Half-Time Recovery in Minutes for the Different Histone-GFP Lines at the Different Developmental Zones of the Root.
| Division (min) | Elongation (min) | Differentiation (min) | |
|---|---|---|---|
| H2B-GFP | 11.35 ± 1.36 | 13.73 ± 2.56 | 16.73 ± 2.45 |
| H2A-GFP | 10.48 ± 1.39 | – | 20.37 ± 2.02 |
| H4-GFP | 11.93 ± 2.80 | – | 13.20 ± 2.10 |
Values represent means ± se.
To exclude the possibility that the observed differences in fluorescence recovery reflected differences in rates of protein synthesis, the de novo expression rates of H2B-GFP were measured. Entire nuclei of cells expressing H2B-GFP were photobleached and the recovery of the fluorescence signal, which had to be due to newly synthesized H2B-GFP proteins, was measured. The synthesis rate observed for cells in the different zones was very small and comparable between the different zones (Supplemental Figure 3A), showing that the different exchange kinetics of H2B-GFP in the different zones cannot be accounted for by differential de novo expression rates and must be due to differential histone exchange dynamics. We confirmed these results by blocking protein synthesis with cycloheximide (CHX). First, we confirmed that CHX treatment inhibited protein synthesis by photobleaching entire nuclei and measuring the recovery after 1 h (Supplemental Figures 3E and 3F). Much less recovery was observed in comparison with the control, confirming that CHX treatment was effective. However, a rise of 2% was still observed, which might be explained by a small degree of reversibility of photobleaching of GFP (Mueller et al., 2012). Importantly, histone mobility at the division zone was not significantly changed when plants were treated with CHX (Supplemental Figures 3C and 3D), ruling out the possibility that protein synthesis could be in the basis of the increased recovery rate in the division zone.
To exclude possible differences in the properties of the nucleoplasm that might affect protein mobility between nuclei at different stages of development, we analyzed the mobility of a nonchromatin binding protein of a similar size to H2B from the capsid of the virus MS2 (MS2CP-GFP). We observed no differences in the FRAP curves for this protein within the different developmental zones (Supplemental Figure 3B), showing that general differences in protein mobility in the different cell types cannot explain the different mobilities of H2B-GFP. To determine whether the changes in dynamics were limited to H2B or are a general property of all core histones, we also measured the exchange dynamics of H2A and H4 using GFP fusion proteins to these histones. In all cases, the overall recovery kinetics were faster in the cells of the division zone (Supplemental Figure 4) as observed for H2B. To eliminate the possibility that expressing histones with a non-native promoter might be affecting these results, we also analyzed the behavior of the histone variant H2A.Z-GFP (HTA11) under the control of its native promoter (Supplemental Figure 5). Again, the same general trend was observed as with the other histones. Thus, we have shown essentially the same results with both canonical and noncanonical histones and using both heterologous and native promoters.
These results show that, as root cells progress from the meristematic region through the elongation region to the differentiation region, histones become generally less dynamic and more strongly bound to chromatin, i.e., global histone mobility is reduced upon differentiation of Arabidopsis root cells. These results support the idea that global chromatin remodeling is a central feature of cellular differentiation.
Reduced Mobility of Histone H2B in Plant Stem Cells
The faster recovery kinetics of core histones in meristematic nuclei described above suggested that as cells start to differentiate, the histone-DNA interactions become stronger, thus making the histones less dynamic. We next asked whether the mobility of histone proteins would be even higher in undifferentiated pluripotent stem cells. For these experiments, given that stem cells in the root are located in the middle of the tissue at a depth of circa 50 μm, two-photon imaging was required. Additionally, in order to improve the signal-to-noise ratio, we used the photoactivatable GFP (PAGFP) as a marker (Patterson and Lippincott-Schwartz, 2002). As a result, instead of a conventional photobleaching experiment, we analyzed the kinetic properties of H2B in stem cells by fluorescence loss after photoactivation (Figure 2B; Supplemental Movie 2), which is characterized by an exponential decay instead of an exponential recovery. By placing the H2B-PAGFP construct under the control of a root cell-specific promoter (pSCR, SCARECROW promoter), we were able to express our constructs simultaneously in QC cells, endodermis/cortex initials, and in root endodermis (Figure 2A), without interference from expression in epidermal cells. This setup allowed us to compare, in vivo and in a single organism, the dynamics of a histone protein in pluripotent stem cells as they progress into more differentiated states. We confirmed that under these conditions H2B-PAGFP proteins were properly associated with chromosomes (Supplemental Movie 3).
Figure 2.

Reduced H2B-PAGFP Mobility on Pluripotent Plant Stem Cells Is Revealed by Two-Photon FRAP.
(A) Longitudinal optical section of Arabidopsis stem cell niche in roots expressing the H2B-PAGFP construct. This construct was expressed under the control of the promoter of SCARECROW, which drives expression in QC cells, initials, and endodermis. Four-day-old seedlings were stained with propidium iodide and the GFP signal was activated by pulses of a 710-nm wavelength laser. Activation of extended ROI to demonstrate effective photoactivation. i, initial cell; e, endodermis. Bars = 10 μm.
(B) Representative fluorescence changes in a nucleus from the endodermis expressing H2B-PAGFP. Half of each nucleus was photoactivated and the loss of fluorescence within the activated area was measured with an excitation wavelength of 850 nm for two-photon fluorescence excitation of H2B-PAGFP.
(C) Decay curves for H2B-PAGFP fluorescence within the different cell types. Inset: Estimated mobile fractions. Values represent mean ± se from at least 10 cells. Student’s t test, **P < 0.01; n.s., not significant.
Photoactivation of PAGFP was performed at a wavelength of 710 nm, whereas 950 nm was used for imaging. In these experiments, half of each nucleus was photoactivated as shown in Figure 2B. In contrast to our initial predictions, we observed that for undifferentiated stem cells (QC and initial cells), the fluorescence decay was significantly slower than in the differentiated cells (endodermis) (Figure 2C, Table 2). A similar pattern of mobility is shown by the size of the mobile pools; QCs and initials showed reduced mobile pools in contrast with the cells from the endodermis, which showed a larger pool of mobile histones (Figure 2C). These results show that H2B is less mobile and more strongly bound to chromatin in stem cells than in the adjacent cells of the meristem.
Table 2. Two-Photon Measurements for the Half-Time for Recovery in Minutes for the H2B-PAGFP at the Different Cell Types and Developmental Zones of the Root.
| Half-Life (min) | |
|---|---|
| QC | 18.77 ± 2.87 |
| Initials | 18.32 ± 2.56 |
| Endodermis | 13.62 ± 1.22 |
| Elongation | 13.83 ± 1.21 |
| Differentiation | 16.96 ± 1.05 |
Values represent means ± se.
To check the consistency of the two-photon photoactivation/fluorescence decay experiments with the photobleaching data, we performed photoactivation in the different developmental zones of the root (Supplemental Figure 6). The results obtained by photoactivation were very similar to the ones obtained by photobleaching. Therefore, the differences of mobility observed for the stem cells are significant and comparable with the results in the developmental zones. It is also notable that the values here for H2B dynamics in the endodermis are very similar to the ones obtained for the epidermis. These observations suggest that the degree of global histone exchange is related to the state of differentiation rather than to differences between specific cell types.
Histone Dynamics and Cell Cycle
Most histones are synthesized and incorporated in a cell cycle dependent manner. Since cells in the meristem are actively dividing while cells in the elongation and differentiation zone are not, we examined whether the observed differences in histone binding and mobility could be due to the changed cell cycle dynamics. DNA content and nuclear volume increase with progression through the cell cycle; thus, the total amount of histone bound to chromatin in the nucleus should correlate with the increase in DNA content. We used the total integrated intensity of H2B-GFP in each nucleus as a measure of cell cycle progression. We monitored the same cells over an extended time period and observed an increase in the total intensity of H2B-GFP as a function of time after mitosis (Supplemental Figure 7C). We then analyzed the half-time of recovery (t1/2) of H2B-GFP as a function of total integrated intensity for individual nuclei (Figure 3A). There was no correlation between total intensity and recovery half-time, supporting the idea that histone mobility was independent of cell cycle stage. Furthermore, we observed that recently divided nuclei are 5 to 6 μm in diameter whereas nuclei close to mitosis are ∼8 to 9 μm (Figure 3B). We used this size difference to classify the cell cycle stage of nuclei and compare FRAP curves from nuclei in different stages of the cell cycle. Figure 3C shows the FRAP curves for the smaller nuclei (5 to 6 μm in diameter, as labeled 1 in Figure 3C) in comparison with the large ones (8 to 9 μm in diameter, as labeled 2 in Figure3C). No significant differences in FRAP curves and mobile fractions (Figure 3D) were observed between these two sets.
Figure 3.

H2B-GFP Dynamics during the Cell Cycle.
(A) Half-time (t1/2) for recovery plotted against the total integrated intensity for each H2B-GFP expressing nucleus. No correlation was observed (R2 = 0.005868).
(B) Root epidermal cells in the division zone expressing H2B-GFP showing cells at different stages of the cell cycle as evidenced by the different morphologies and sizes of the nuclei (nuclei with 5 to 6 μm in diameter are labeled with 1 and nuclei with 8 to 9 μm in diameter are labeled with 2). Bars = 5 μm.
(C) Quantitative analysis of FRAP experiments for nuclei classified as 1 or 2, showing no significant differences in recovery.
(D) Estimated mobile fraction. Values represent means ± se from 5 cells.
The duration of the cell cycle in the division zone is estimated at 17 h, with G2 length varying from 3 to 6 h (Hayashi et al., 2013). We tracked cells 2 h after division, which are most likely to be in G1, and performed FRAP analysis (Supplemental Figures 7A and 7B). The recoveries observed for these cells are very similar to ones described above for the division zone where cells were randomly chosen. Importantly, the recoveries observed, no matter at what cell cycle stage, are considerably faster in the division zone than in the other developmental regions of the root, showing that cell cycle stage cannot account for most of the difference in histone mobility. Finally, we determined FRAP curves for the same individual cells in the division zone at different time points after mitosis. We were able to track cells based on cell shape at 1, 2, 6, and 10 h after division (Supplemental Figures 7C and 7D). We were not technically able to track cells at later time points. However, no differences were apparent between the time points we were able to analyze, although the changes in size and intensity over the period suggest substantial progression through S phase. Together, these results show that there is no observable difference in FRAP recovery at any point in the cell cycle. Thus, consistent with previous observations in animal cells (Phair et al., 2004; Meshorer et al., 2006), these results rule out the possibility that changes in cell cycle dynamics were the cause of the different mobilities during cell differentiation.
Acetylation Levels Affect Histone Mobility and Developmental State
Posttranslational modifications of histones by acetylation have been shown to strongly affect chromatin structure. Typically, acetylation occurs within N-terminal histone tails and is thought to modulate the interactions between the tails and the DNA, leading to increased accessibility of target genes to transcription (Kadonaga, 1998; Strahl and Allis, 2000). Histone acetylation levels are controlled by the balance between histone deacetylase and histone acetyl transferase activity. To assess the role of histone acetylation in histone mobility, we manipulated the acetylation levels using two different strategies, to either increase or decrease acetylation, and analyzed the resulting mobility of H2B-GFP by FRAP. As there are ∼20 histone deacetylases (HDACs) in the Arabidopsis genome, to inhibit HDAC activity we used trichostatin A (TSA), a well-characterized inhibitor of HDACs (Yoshida et al., 1990). As a confirmation that TSA increased histone acetylation levels, we performed immunoblots on TSA treated wild-type roots with an antibody against acetylated histone H4 (Figure 4H). The increase in acetylation was not restricted to H4 but was also confirmed by immunofluorescence with an antibody against H2BK20ac (Figures 4I and 4J). Also, we used the major histone acetyl-transferase mutant hag1-6 (Kornet and Scheres, 2009) and achieved decreased histone acetylation levels by crossing this line with the H2B-GFP line. The decreased H2B acetylation levels in hag1-6 were confirmed by immunofluorescence with an antibody against H2BK20ac (Supplemental Figure 8). The results from these two complementary strategies showed that, on the one hand, in nuclei in the division zone, hypoacetylation in the hag1-6 mutant reduced the mobility of H2B-GFP, whereas TSA treatment had no effect on histone exchange (Figures 1C and 1D). On the other hand, in nuclei in the differentiation zone, hyperacetylation by TSA treatment significantly increased H2B-GFP mobility while in the hag1-6 mutant histone mobility was not reduced further (Figures 1C and 1E). These experiments show that histone acetylation levels directly affect histone dynamics. Importantly, the manipulation of the acetylation levels by TSA or hag1-6 did not affect the mobility of H2B in the same way in all cells but specifically depended on their state of differentiation.
Figure 4.

Histone Acetylation Affects Root Development and Meristem Size.
(A) to (D) Four-day-old root meristems of wild-type plants (A), wild-type plants treated overnight with 100 ng/mL TSA (B), hag1-6 mutant (C), and hag1-6 mutant treated overnight with TSA (D).
(E) Root meristem cell number of plants depicted in (A) to (D). Root meristem size is expressed as the number of cortex cells in a file extending from the quiescent center (asterisk) to the first elongated cortex cells (white arrowheads). Data are shown as mean ± se (n = 8 to 10). Student’s t test, ***P < 0.001; n.s., not significant.
(F) Four-day-old wild-type plants expressing H2B-PAGFP were photoactivated in a single nucleus and cell division was observed after 12 h in control situation and after treatment with 100 ng/mL TSA. In order to detect the GFP signal 12 h after photoactivation, the detector gain was increased to compensate for dilution of signal after cell division and photobleaching. This increased the visibility of the observed autofluorescence throughout the tissue, especially evident in TSA-treated samples.
(G) Number of cell divisions counted during a period of 12 h; values represent means ± se (n = 10).
(H) Immunoblot for H4ac in protein extracts from whole Col-0 roots showing an increase in the acetylation levels after overnight treatment with TSA. Coomassie blue (CBB) shows protein loading.
(I) Representative immunolabeling images of Arabidopsis nuclei from the differentiation zone with an antibody against H2BK20ac in wild-type plants showing an increase in the acetylation levels after treatment with TSA. Bars = 5 μm.
(J) Quantitative analysis of immunolabeling experiment depicted in (I). Values represent means ± se from 10 cells.
We next examined whether inducing changes in histone acetylation, and thus histone dynamics, caused changes in development by quantifying the numbers of meristem cells. Root meristem size was measured as the number of cortex cells in a file extending from the QC to the first elongated cell. It has been previously shown (Kornet and Scheres, 2009) that the hag1-6 mutant has shorter roots and smaller meristems. We showed that this phenotype is due to smaller numbers of meristem cells and that the phenotype could not be rescued by TSA treatment (Figures 4A and 4C to 4E). Also, TSA induced an increase in meristem cell number in wild-type plants (Figures 4A, 4B, and 4E). In principle, the increase in meristem cell number by hyperacetylation could be caused either by an increased rate of cell division in the meristematic cells or by a delay in differentiation. To address this question, we used a line expressing H2B fused with a photoactivatable GFP marker. We specifically photoactivated a single nucleus in the meristem of each plant and counted the number of cell divisions after a period of 12 h in wild-type control plants and wild type treated with TSA (Figure 4F). The results showed a slight decrease in cell division rate upon TSA treatment (Figure 4G). This was confirmed by analysis of cell division in a line carrying cyclin1B-GFP, a marker for G2/M phase of the cell cycle (Figure 5). The number of cells expressing the marker is reduced in TSA-treated samples (Figures 5A and 5B). This is consistent with the photoactivation experiments (Figure 4F) and excludes the possibility that the increase in meristem cell number by hyperacetylation could be caused by an increased rate of cell division in meristematic cells. In spite of the decrease in division rate, cells treated with TSA show fast histone mobility behavior, as shown in previous sections. These results again argue that changes cell cycle dynamics cannot account for the differences in mobility between the different developmental zones.
Figure 5.

Expression of CycB1-GFP Is Reduced upon TSA Treatment.
(A) Four-day-old root meristems of CyB1-GFP plants, showing a reduced number of cells expressing the marker after overnight treatment with 100 ng/mL TSA. Bars = 50 μm.
(B) Quantification of GFP expressing cells from experiment depicted in (A). Values represent mean ± se from at least 20 roots. Student’s t test,***P < 0.001.
These observations strongly suggest that the increased levels of histone acetylation following TSA treatment do not increase meristematic cell division but instead delay cell differentiation in the root meristem, resulting in a higher meristem cell number. An important implication from the results described so far is that histone acetylation levels differ in the different developmental zones. We used immunofluorescence and immunoblotting to look at differences in acetylation levels between the division and differentiation zones (Figures 6A and 6B). In both cases, the level of labeling for acetylation was higher in the division zone, as predicted by our histone exchange kinetics data. Consistent with these observations, a mutant that displays bigger meristems, short hypocotyl 2-31 (shy2-31) (Dello Ioio et al., 2008), also showed an overall increase in histone acetylation as measured by protein gel blot (Figure 6C).
Figure 6.

Histone Acetylation Levels in the Division versus Differentiation Zone.
(A) Representative immunolabeling images of Arabidopsis nuclei from the division and differentiation zone with an antibody against H2BK20ac in wild-type plants showing an increase in the acetylation levels in the division zone. Bars = 5 μm.
(B) Immunoblot for H4ac in protein extracts from root meristems and differentiation zone of 4-d-old Col-0 seedlings showing higher acetylation levels in the division zone. A general antibody against H3 was used to compare the loadings. Div, division zone; Diff, differentiation zone.
(C) Immunoblot for H4ac in protein extracts from Landsberg erecta wild-type and shy2-31 mutant roots.
We further examined two specific GFP-based markers of cell differentiation, Root Hair Defective 6 (RHD6) and Root Hair Defective 6-Like 4 (RSL4), to monitor changes in expression patterns after TSA treatment. RHD6 and RSL4 are transcription factors involved in root hair development (Yi et al., 2010). RHD6 is expressed only in the meristem, whereas RSL4 is specifically expressed in the elongation zone (Supplemental Figures 9A and 9C). Following TSA treatment, the cells from the differentiation zone expressed the meristematic marker (RHD6) (Supplemental Figure 9B), whereas the marker for the elongation zone (RSL4) was expressed in fewer cells (Supplemental Figure 9D). It should be noted that, although the expression pattern of these genes is altered upon TSA treatment, major changes in root hair development would not be expected after only overnight treatments. Together, these results reinforce the finding that the level of histone acetylation has a major role in regulating cell differentiation and meristem identity.
We also asked whether histone acetylation has any effect on the development of the stem cell niche. To identify the effect of histone acetylation on the development of the stem cells, we analyzed the structure of the root tip in plants treated with TSA. We frequently observed QC divisions in plants treated overnight with TSA (Figures 7A to 7C), whereas QC divisions are much rarer in untreated plants. Furthermore, we observed that treatment with TSA induced ectopic expression of H2A.Z in QC cells (Figures 7D and 7E); this histone variant has been shown to be associated with replication activity (Costas et al., 2011) and is absent from QCs (Figure 7D). We also showed that this H2A.Z variant is mainly expressed in meristematic tissue (Supplemental Figure 10). These observations were further supported by the reduction of expression of the specific QC marker WOX5 (WUSCHEL RELATED HOMEOBOX5) transcription factor by TSA treatment (Figures 7F to 7I). Together, these results suggest that increasing histone acetylation levels in QC cells increases their replicative activity as observed by the expression of H2A.Z (HTA11) and the increased cell divisions.
Figure 7.

Effect of Histone Hyperacetylation on the QC Identity.
Longitudinal optical sections of Arabidopsis stem cell niche in 4-d-old wild type.
(A) Col-0.
(B) Col-0 treated overnight with 100 ng/mL TSA, showing divided QC cells (arrow).
(C) Number of QC divisions per root in 5-d-old seedlings in control (Col-0) and plants treated overnight with TSA. Values represent mean ± se from 20 cells. Student’s t test, **P < 0.01.
(D) Col-0 root expressing H2AZ-GFP.
(E) Col-0 H2AZ-GFP root after TSA treatment showing expression of H2AZ-GFP in QC cells (arrow).
(F) to (I) Roots expressing WOX5:GFP. WOX5:GFP signal in 4-d-old (F) and 5-d-old (G) control roots and in plants treated with TSA for 24 h (H) and 48 h (I), showing a strong decrease in WOX5 signal upon TSA treatment. Bars = 20 μm.
DISCUSSION
Plants have a remarkable ability to retain populations of dividing undifferentiated cells—meristems—that ultimately lead to an indeterminate type of growth. The molecular and cellular properties that characterize these populations of cells pose fundamental questions in biology that are important for understanding plant growth and development. Here, based on quantitative single-cell in vivo imaging, we show that in the Arabidopsis root, meristematic cells are characterized by relatively weaker and more dynamic histone-DNA interactions. As root cells progress from the meristem toward the differentiation zone, histones become less mobile and more strongly bound to the chromatin. To account for our FRAP results, these changes must affect chromatin globally and cannot simply be caused by changes in a subset of genes whose expression changes with differentiation. We have therefore identified global changes in histone dynamics as a function of cell differentiation in the root. Similar results have been previously reported for mammalian cultured cells undergoing differentiation (Meshorer et al., 2006). In this study, embryonic stem cell differentiation was accompanied by a reduced binding of chromatin proteins, including histones. Meshorer et al. (2006) proposed that this hyperdynamic binding of chromatin proteins is a hallmark of pluripotent embryonic stem cells that contributes to maintaining a strong level of plasticity in the potential of the genome to reorganize and engage different differentiation programs. The occurrence of the same phenomenon in plants suggests an evolutionarily conserved mechanism to regulate differentiation state.
However, we also provide evidence that the overall state of the chromatin in plant root stem cells is less dynamic than in the cell division zone, revealing stronger histone-DNA interactions. The low mobilities observed for root stem cells were somewhat unexpected given the pluripotency characteristic of these cells. However, this may reflect their specialized function. Root stem cells, and especially QC cells, divide very infrequently, being mostly responsible for sending signals controlling differentiation of their neighboring cells. Therefore, to fulfill this role, these cells might need the activity of fewer genes. While our histone mobility studies agree in some respects with what is known for cell differentiation in mammalian cultured cells, they contrast for the specific case of stem cells (Meshorer et al., 2006). Embryonic animal stem cells were shown to have hyperdynamic chromatin proteins, and this state was proposed to be essential for their function as pluripotent cells. Therefore, with respect to their overall histone dynamics, animal stem cells resemble more the Arabidopsis root cells from the division zone (meristem) rather than the QC and initial cells. It may be significant that the animal studies were performed on cell cultures, and it would be interesting to see how the chromatin of animal stem cells behaves in the context of a multicellular organism.
We then asked what could account for the differences in histone mobility observed in our FRAP analysis. In vitro experiments have shown that nucleosomes can constitute a strong hindrance to RNA Pol II elongation (Kireeva et al., 2002). Thus, modifications that affect the interactions between nucleosomes or between the nucleosomes and the DNA are thought to be favorable for transcription. Of all posttranslational modifications in histones, acetylation has the highest potential to induce chromatin unfolding. Histone acetylation is thought to facilitate transcriptional activation either by forming a binding site for bromodomain-containing proteins or by neutralizing the charges of the basic tails that interact with the acidic DNA (Roth et al., 2001). Indeed, our results demonstrated that the changes in histone stability during root development are caused at least in part by changes in histone acetylation levels. We also found that altering stability via manipulation of acetylation levels can affect aspects of root development. We observed that, consistent with a short root phenotype, hag1-6 (Kornet and Scheres, 2009) has a reduced number of meristematic cells and that these cells are characterized by less dynamic chromatin. Also, hyperacetylation by TSA causes not only an increase in meristem size but also the expression of a meristem marker (RHD6) in cells from the differentiation zone, together with an overall decrease of histone stability as measured by FRAP. These results reveal a role for histone acetylation and histone stability in determining meristem competency and root development.
Although we do not have direct evidence showing that histone acetylation levels in the stem cells, in the QC and initials, affect histone mobility we predict that QC identity is associated with lower levels of histone acetylation. Evidence for this is the induction of cell division and loss of the QC marker (WOX5) in these cells after TSA treatment. These results are consistent with the analysis of DNA methylation of Arabidopsis root (Lorvellec, 2007). This study showed that that during the differentiation of root cells, the overall DNA methylation levels increase and more importantly that the nuclei from stem cell niche were hypermethylated, in particular those of QCs and endodermis/cortex initials. Given that DNA methylation is normally associated with hypoacetylated histones, these results support the idea that plant stem cells histones are poorly acetylated, as we predicted from our FRAP data.
Hyperacetylation by TSA correlated with an increase in cell division in QC cells but an overall decrease in cell division in the meristem. While this might seem contradictory, we can rationalize it as follows. First, as we discussed above, cells in the division zone show high levels of acetylation, while QC cells are probably hypoacetylated. If acetylation plays a role in the ability of cells to divide, a further increase in acetylation by TSA would probably not be expected to have a big effect in the meristem, which is already undergoing rapid division. In support of this, we have shown that histone mobility is not increased by TSA in the meristem. However, in the case of QC cells, which normally divide very infrequently, and in which histone mobility is low, we suggest that TSA changes the acetylation status more dramatically and therefore triggers extra divisions. Similarly, a recent study in Brassica napus shows that TSA induces hyperproliferation of microspore cultures (Li et al., 2014). Second, while the reduction in cell divisions observed in the meristem was somewhat unexpected, it should be noted that TSA is a general inhibitor and is very likely to have pleiotropic or toxic effects, especially when applied in the context of a whole organism and for an extended time. In fact, it has been shown in human cells that TSA can induce a cell cycle arrest cell (Yoshida and Beppu, 1988).
Significantly, the decrease in cell division in the meristem with TSA treatment did not lead to a reduction in meristem cell number, but to an increase. Thus, the higher meristem cell numbers following TSA treatment cannot derive from an increased rate of cell division. Instead, we propose that the increased levels of histone acetylation have the effect of delaying cell differentiation in the root meristem. Thus, we suggest that histone acetylation plays a role in regulating both differentiation and cell cycle progression, where high levels of acetylation (such as in the meristem) correlate with a low differentiation state but higher competence to divide. In the case of QC cells, the acetylation levels are presumably low and the differentiation state although considered “undifferentiated” is highly specialized and in some respects similar to the differentiation zone.
Interestingly, it has been shown that expression of cyclinB1 (a marker for G2/M phase of cell cycle) is reduced in the hag1-6 mutant, showing that histone acetylation plays a role in regulating cell division (Kornet and Scheres, 2009). We might therefore propose that differences in the cell cycle dynamics were due to the differences of histone mobilities observed for the different developmental zones. While histone acetylation might play a role in controlling cell cycle progression, we did not see differences in histone mobility through the cell cycle that could account for the differences between the developmental regions.
Histone acetylation has been shown to play an important role during plant development. Long et al. (2006) showed that the histone acetyltransferase GCN5 (for general control nonderepressible 5) is required for meristem activity (Long et al., 2006). Moreover, Kornet and Scheres (2009) also revealed that GCN5 is essential for root stem cell maintenance, supporting the idea that histone acetylation plays an important role in root and stem cell development. These results are further supported by the correlation between histone acetylation and DNA replication in plants (Jasencakova et al., 2000). If DNA replication is associated with high levels of histone acetylation, then it is likely that cells such as QC cells, which are mitotically inactive, have low levels of histone acetylation and consequently the observed low histone mobilities.
In conclusion, our data support a model in which cell differentiation in the Arabidopsis root is accompanied by major changes in histone-DNA interactions and that this progression is at least in part regulated by histone acetylation. We propose that this aspect of chromatin organization may contribute to the maintenance of different states of development, therefore playing an important role in root development and differentiation.
METHODS
Plant Lines and Growth Conditions
Mutants and transgenic lines used in this study come from the following sources: hag1-6 mutant (Kornet and Scheres, 2009), RHD6-GFP (Menand et al., 2007), RSL4-GFP (Yi et al., 2010), HTA11-GFP (Kumar and Wigge, 2010), shy2-31 (Dello Ioio et al., 2008), and CycB1-GFP (Ubeda-Tomas et al., 2009). Except shy2-31, which is in the Landsberg erecta background, all other mutants and transgenic lines were in Columbia background.
Seeds were surface sterilized in 5% v/v sodium hypochlorite for 5 min and rinsed three times in sterile distilled water. Seeds were then plated on Murashige and Skoog (MS) medium (pH 5.8) supplemented with 1% w/v sucrose and 0.5% w/v Phytagel. Seeds were stratified at 4°C for 48 h in the darkness and then grown in continuous light at 25°C in vertically oriented Petri dishes. The roots were observed after 3 to 5 d of incubation, depending on the experiment.
For analysis of TSA effect on meristem size, plants were initially germinated in nonsupplemented media for 3 d and then transferred overnight to new plates containing the respective supplements. Before pouring into plates, molten media was supplemented with a stock solution of TSA to a final concentration of 100 ng/mL. TSA was obtained from Sigma-Aldrich (catalog number T8552).
Histone mobility analysis in the presence of the protein inhibitor CHX was performed in plants incubated for 2 h in plates containing 50 ng/mL CHX, which was obtained from Sigma-Aldrich (catalog number C7698).
Constructs and Plant Transformation
The cDNA clones of H2B (At5g22880), H2A (At1g51060), and H4 (At2g28740) were amplified from whole-seedling cDNA with primers containing attB1 and attB2 sites. Primer sequences are listed in Supplemental Table 1. The PCR products were cleaned using a PCR purification column (QIAQuick; Qiagen) and recombined into pDONR 207 (Invitrogen) by BP reaction (Gateway technology; Invitrogen). All plasmid inserts were verified by sequencing. Histone entry clones were then recombined by LR reaction Gateway technology into the plant destination vector GFP-N-bin (gift from Ben Trewaskis, MPI, Germany), which contains a GFP fusion at the N terminus and a constitutive 35S promoter. LR reactions were performed in accordance with the Invitrogen manual.
The multisite Gateway system (Invitrogen) was used for the PAGFP (Patterson and Lippincott-Schwartz, 2002) construct. The 2.5-kb region immediately upstream of the start site of the SCARECROW coding region was amplified with PCR primers containing recombination sequences and cloned into pDONR P4-P1R vectors (Invitrogen). The H2B (At5g22880) cDNA coding region was amplified and cloned into pDONR P2R-P3 and PAGFP tag cloned into pDONR 207 without the stop codon. After all plasmid inserts were verified by sequencing, a MultiSite Gateway reaction (Invitrogen) was then performed with the three resulting pDONR plasmids and the binary vector pGWB multisite (the destination binary vector pGWB multisite was a gift from M. Tomlinson, John Innes Centre) and was generated by replacing the R1-CmR-ccdB-R2 cassette of pGWB1 into R4-CmR-ccdB-R3 (pGWB1 was from Tsuyoshi Nakagawa, Shimane University, Japan).
The binary plasmid pNLS:MS2CP:GFP, containing the bacteriophage MS2 coat protein (a gift from Adrian Sambade, John Innes Centre) was also used to generate transgenic stable Arabidopsis thaliana lines.
Agrobacterium tumefaciens strain GV3103 was used for plant transformation by the floral dipping method as described (Clough and Bent, 1998). T1 plants were screened on MS and agar plates without sucrose and containing 50 μg/mL kanamycin for the histone-GFP constructs and 50 μg/mL hygromycin and 50 μg/mL kanamycin for the PAGFP fusion construct. MS2CP plants were screened with Basta selection on soil.
Microscopy
Optical sections of roots were collected with a Zeiss 510 Meta confocal microscope. For visualization of roots stained with propidium iodide, an excitation line of 488 nm was used and signal was detected at wavelengths of 580 to 700nm. For observation of GFP expression, we used a 488-nm excitation line and BP filter of 505 to 550 nm. Immunofluorescence imaging was performed using a Nikon Eclipse 600 epifluorescence microscope equipped with a Hamamatsu Orca ER cooled CCD digital camera and a Prior Proscan x-z stage. The following wavelengths were used for fluorescence detection: excitation of 340 to 380 nm and emission of 425 to 475 nm for 4′,6-diamidino-2-phenylindole (DAPI) and excitation of 490 to 510 nm and emission of 520 to 550 nm for Alexa488. For all experiments, series of optical sections with z-steps of 0.2 μm were collected using MetaMorph software (Universal Imaging). Images were processed with the ImageJ program (http://rsb.info.nih.gov/ij/) or Adobe Photoshop CS.
FRAP
FRAP experiments were performed using a Zeiss 510 Meta confocal microscope. For FRAP experiments on histone proteins, a prescan was acquired followed by a bleaching pulse of five iterations (speed 200 to 500 pixels/ms) using a bleach area 1 μm in radius. For imaging, the laser power was attenuated to 1% of the bleach intensity. At all imaging time points, series of optical sections (15 to 20 slices) with z-steps of 1 μm were collected. One z-stack (512 × 512 pixels) was collected every 60 s. FRAP recovery curves were generated from background subtracted images and normalized for the loss of fluorescence due to imaging and bleach pulse, i.e., double normalization (Phair et al., 2004). We additionally normalized for the variation on the bleaching depth as follows:
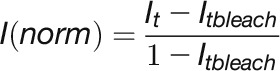 |
where Itbleach, is the fluorescent intensity after double normalization at the bleach point.
Images were processed with the ImageJ program (http://rsb.info.nih.gov/ij/).
Mobile fractions and half-life were calculated by individually fitting the FRAP recoveries of each nucleus to a single exponential function, and results were then averaged. The standard Student's t test was used to determine the statistical significance of results. All quantitative values represent means from at least 10 cells. For the exponential fitting and statistical analysis, we used the GraphPad Prism 5 software.
For FRAP on MS2CP-GFP lines, faster settings were used. Image size was reduced to 256 × 256 pixels, and imaging was performed with a bidirectional scanning mode (with pixel dwell time 0.8 μs). Five prescans were taken before a bleaching pulse of one iteration at 100% laser power (488 nm) followed by 60 scans with 1% laser power. No time delays or z-stacks were taken. All values were then normalized as described.
The 3- to 5-d-old seedlings were mounted in water between slide and cover slip and sealed with 0.12-mm-thick SecureSeal Adhesive tape (Grace Bio-Labs) to avoid drying during imaging.
Two-Photon FRAP
Two-photon photoactivation experiments were performed on an Ultima two-photon laser scanning microscope (Prairie Technologies). Live images were acquired using either Olympus 60× 0.9-numerical aperture water immersion objectives at 512 × 512 resolution and 1-μm steps. Because the total lack of initial fluorescence makes it impossible to identify the regions of interest for photoactivation, an initial preactivation was necessary. This faint preactivation was achieved by scanning the root tip at 850-nm wavelength, 50% power, and with a pixel time of 5.6 μs. One or two scans were necessary depending on signal.
Photoactivation of PAGFP in live tissue was performed by defining simultaneously a region of interest (ROI) that covered half the nucleus in the different z-positions (1-μm steps). We then pulsed those ROIs with a 710-nm light at 30% power with a pixel time of 8.8 μs. We repeated this cycle two times and then started imaging. For imaging, a z-stack was collected at 925 nm (at 50% power, 8.8 μs/pixel). One z-stack (512 × 512 pixels) was collected every 60 s for 1 h.
To generate fluorescence decay curves, background levels were initially subtracted from the images. Data were then corrected for the loss of fluorescence due to imaging as described by Phair et al. (2004) and normalized as follows:
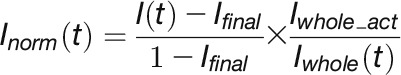 |
where, Ifinal, is the intensity of the activated region (ROI) at the end of the experiment after background subtraction. Iwhole_act is the whole nucleus intensity after photoactivation and background subtraction.
Images were processed with the ImageJ program (http://rsb.info.nih.gov/ij/).
Mobile fractions and half-lives were calculated by individually fitting the FRAP recoveries of each nucleus to a single exponential decay function and averaging. The standard Student's t test was used to determine the statistical significance of results. All quantitative values represent averages from at least 10 cells. For the exponential fitting and statistical analysis, we used the GraphPad Prism 5 software.
De Novo Synthesis and Cell Division Rates
For calculation of de novo synthesis, z-stacks of cells expressing H2B-GFP protein were collected (z-steps of 0.5 μm) followed by photobleaching of entire nuclei with a 488-nm laser line at 100% power (five iterations). One z-stack was collected straight after bleaching and a final one after 1 h. De novo synthesis was expressed as followed:
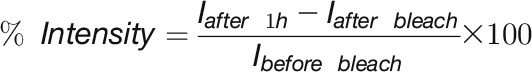 |
For calculation of cell division rates, pSCR:PAGFP-H2B plants were photoactivated using a quick pulse (∼3 s) of 405-nm laser (30%) on a defined region containing one single nucleus. A single image was then taken to confirm the appearance of the GFP signal. Plants were then put back to grow on MS plates or MS + TSA overnight. The number of cell divisions that had taken place during that period was calculated based on the number of cells showing GFP signal.
Root Meristem Size Analysis and QC Divisions
Meristem size was expressed as the number of cells in the cortex files extending from the quiescent center to the first elongated cortex cell. Values represent the mean with se (n = 15). Measurements were performed 5 d after germination. Seedlings were stained with 20 mg/mL propidium iodide and observed on a confocal microscope. The standard Student's t test was used to determine the statistical significance of results.
QC divisions were scored as QC cells with a newly formed cell wall. Frequency analysis was performed from 20 roots. Statistical differences between treatments were assessed using pairwise Student’s t tests.
Immunofluorescence
The Arabidopsis roots were fixed for 60 min with 4% (w/v) formaldehyde freshly made from paraformaldehyde in PBS buffer. After washing in PBS for 5 min, the roots were digested in a mixture of 1% Dolicalase, 0.5% Cellulase, and 0.025% Pectolyase at 37°C for 45 to 60 min. After enzyme treatment, roots were washed in PBS three times for 5 min each and squashed between poly-l-lysine slides (Polysine; VWR International) and cover slips in PBS. After freezing the slides in liquid N2, the cover slips were removed and the samples were air-dried. Slides were incubated for 15 min in detergent solution (0.5% Triton X-100 in PBS). Slides were washed three times with PBS for 5 min each and incubated in 0.1 n HCL for 15 min. Then, the slides were washed three times with PBS blocked with 4% BSA in PBS for 30 min, followed by histone antibody staining.
Anti-H2BAc(K20) antibody from rabbit (1:200) (Cell Signaling) was used as a primary antibody in 1% BSA in PBS. The slides were incubated at 4°C overnight with the primary antibody in a humid box. After washing the slides in PBS for 5 min each, anti-rabbit IgG A488 conjugate (Invitrogen) was applied as secondary antibody and slides were incubated for 1 h in a humid dark box at 37°C. After washing the slides three times in PBS for 5 min each, the specimens were counterstained with 1 μg/mL DAPI and mounted in Vectashield (Vector Laboratories).
For quantification of acetylation signal, total integrated intensity of antibody signal was measured using ImageJ software and divided by total intensity of DAPI signal. The standard Student's t test was used to determine the statistical significance of results.
Immunoblot
Root extracts from Columbia-0 (Col-0) and Col-0 plants grown overnight in the presence of TSA were made by grinding roots in SDS-PAGE loading buffer (Invitrogen) in the presence of 0.05 M DTT and heated to 70°C for 10 min. Electrophoresis was performed using precast 4 to 12% gradient gels (Invitrogen) according to the manufacturer’s instructions. Proteins were transferred to polyvinylidene fluoride membranes (Thermo Scientific) using NuPage transfer buffer (Invitrogen) for immunoblotting. The polyvinylidene fluoride membrane was blocked with 3% BSA (Sigma-Aldrich) in Tris-buffered saline containing 1% Tween-20 (Sigma-Aldrich) (TBS-T) for 2 h with gentle shaking. Anti-H4Ac (AbD Serotec) and anti-H3 (Abcam; ab1791) antibody was then added at a concentration of 1:800 and 1:10,000, respectively, for 60 min. Blots were washed thoroughly three times in TBS-T, for 10 min each with further shaking, and finally labeled with a peroxidase-conjugated secondary antibody anti-rabbit (Sigma-Aldrich) at a 1:20,000 dilution and detected using the ECL reagent (GE Healthcare). Membranes were stained with Coomassie Brilliant Blue R 250.
For comparison between the developmental zones, the meristems were isolated by cutting ∼3 mm from the root tip.
Accession Numbers
Sequence data from this article can be found in the Arabidopsis Genome Initiative or GenBank/EMBL databases under the following accession numbers: H2B (At5g22880), H2A (At1g51060), H4 (At2g28740), HTA11 (At3g54560), RHD6 (At1g66470), RSL4 (At1g27740), SCR (At3g54220), WOX5 (At3g11260), Hag1/GCN5 (At3t54610), and Shy2 (At1g04240).
Supplemental Data
The following materials are available in the online version of this article.
Supplemental Figure 1. H2B-GFP Expression in Arabidopsis Root.
Supplemental Figure 2. Arabidopsis Root Meristem Diagram.
Supplemental Figure 3. De Novo Synthesis in H2B-GFP Dynamics during the Cell Cycle.
Supplemental Figure 4. FRAP Analysis for H2A-GFP and H4-GFP.
Supplemental Figure 5. FRAP Analysis for HTA11-GFP.
Supplemental Figure 6. Two-Photon FRAP Curves for pSCR:H2B-PAGFP at the Different Developmental Zones.
Supplemental Figure 7. FRAP Analysis for H2B-GFP after Mitosis.
Supplemental Figure 8. H2B Acetylation in hag1-6 Mutant.
Supplemental Figure 9. RHD6-GFP and RSL4-GFP Expression after TSA Treatment.
Supplemental Figure 10. HTA11-GFP Expression in the Root.
Supplemental Table 1. Primers Used in This Work.
Supplemental Movie 1. Cell Division Showing Complete Incorporation of H2B-GFP in the Chromatin.
Supplemental Movie 2. Two-Photon Photoactivation of an Endodermal Cell Expressing H2B-PAGFP.
Supplemental Movie 3. Cell Division Showing Complete Incorporation of H2B-PAGFP in the Chromatin.
Supplementary Material
Acknowledgments
We thank Michael Lenhard, Silvia Costa, and Adrien Sicard for critical comments on the article and Liam Dolan, Robert Sablowski, José Feijó, and Lars Ostergaard for comments and advice. We thank Vinod Kumar and Phil Wigge for the H2A.Z-GFP line and Nuno Moreno for the help with the multiphoton microscope at Instituto Gulbenkian de Ciência, Portugal. This work was supported by a grant (SFRH/BD/23202/2005) from the Portuguese Fundação para a Ciência e a Tecnologia, by the Biotechnology and Biological Sciences Research Council of the UK (Grants BB/D011892/1 and BB/J004588/1), and by the John Innes Foundation.
AUTHOR CONTRIBUTIONS
S.R., P.S., V.N., and R.A. designed the research. S.R., A.P., and N.O. performed research. S.R. analyzed the data, and all authors helped to interpret the data. P.S. and RA supervised the research. S.R. and P.S. wrote the article.
Glossary
- QC
quiescent center
- FRAP
fluorescence recovery after photobleaching
- CHX
cycloheximide
- HDAC
histone deacetylase
- TSA
trichostatin A
- MS
Murashige and Skoog
- DAPI
4′,6-diamidino-2-phenylindole
- ROI
region of interest
- Col-0
Columbia-0
Footnotes
Online version contains Web-only data.
Articles can be viewed online without a subscription.
References
- Clough S.J., Bent A.F. (1998). Floral dip: a simplified method for Agrobacterium-mediated transformation of Arabidopsis thaliana. Plant J. 16: 735–743. [DOI] [PubMed] [Google Scholar]
- Costas C., de la Paz Sanchez M., Stroud H., Yu Y., Oliveros J.C., Feng S., Benguria A., López-Vidriero I., Zhang X., Solano R., Jacobsen S.E., Gutierrez C. (2011). Genome-wide mapping of Arabidopsis thaliana origins of DNA replication and their associated epigenetic marks. Nat. Struct. Mol. Biol. 18: 395–400. [DOI] [PMC free article] [PubMed] [Google Scholar]
- Dello Ioio R., Nakamura K., Moubayidin L., Perilli S., Taniguchi M., Morita M.T., Aoyama T., Costantino P., Sabatini S. (2008). A genetic framework for the control of cell division and differentiation in the root meristem. Science 322: 1380–1384. [DOI] [PubMed] [Google Scholar]
- Dion M.F., Kaplan T., Kim M., Buratowski S., Friedman N., Rando O.J. (2007). Dynamics of replication-independent histone turnover in budding yeast. Science 315: 1405–1408. [DOI] [PubMed] [Google Scholar]
- Dolan L., Janmaat K., Willemsen V., Linstead P., Poethig S., Roberts K., Scheres B. (1993). Cellular organisation of the Arabidopsis thaliana root. Development 119: 71–84. [DOI] [PubMed] [Google Scholar]
- Hayashi K., Hasegawa J., Matsunaga S. (2013). The boundary of the meristematic and elongation zones in roots: endoreduplication precedes rapid cell expansion. Sci. Rep. 3: 2723. [DOI] [PMC free article] [PubMed] [Google Scholar]
- Henikoff S. (2008). Nucleosome destabilization in the epigenetic regulation of gene expression. Nat. Rev. Genet. 9: 15–26. [DOI] [PubMed] [Google Scholar]
- Jamai A., Imoberdorf R.M., Strubin M. (2007). Continuous histone H2B and transcription-dependent histone H3 exchange in yeast cells outside of replication. Mol. Cell 25: 345–355. [DOI] [PubMed] [Google Scholar]
- Jasencakova Z., Meister A., Walter J., Turner B.M., Schubert I. (2000). Histone H4 acetylation of euchromatin and heterochromatin is cell cycle dependent and correlated with replication rather than with transcription. Plant Cell 12: 2087–2100. [DOI] [PMC free article] [PubMed] [Google Scholar]
- Kadonaga J.T. (1998). Eukaryotic transcription: an interlaced network of transcription factors and chromatin-modifying machines. Cell 92: 307–313. [DOI] [PubMed] [Google Scholar]
- Kidner C., Sundaresan V., Roberts K., Dolan L. (2000). Clonal analysis of the Arabidopsis root confirms that position, not lineage, determines cell fate. Planta 211: 191–199. [DOI] [PubMed] [Google Scholar]
- Kimura H., Cook P.R. (2001). Kinetics of core histones in living human cells: little exchange of H3 and H4 and some rapid exchange of H2B. J. Cell Biol. 153: 1341–1353. [DOI] [PMC free article] [PubMed] [Google Scholar]
- Kireeva M.L., Walter W., Tchernajenko V., Bondarenko V., Kashlev M., Studitsky V.M. (2002). Nucleosome remodeling induced by RNA polymerase II: loss of the H2A/H2B dimer during transcription. Mol. Cell 9: 541–552. [DOI] [PubMed] [Google Scholar]
- Kornet N., Scheres B. (2009). Members of the GCN5 histone acetyltransferase complex regulate PLETHORA-mediated root stem cell niche maintenance and transit amplifying cell proliferation in Arabidopsis. Plant Cell 21: 1070–1079. [DOI] [PMC free article] [PubMed] [Google Scholar]
- Kumar S.V., Wigge P.A. (2010). H2A.Z-containing nucleosomes mediate the thermosensory response in Arabidopsis. Cell 140: 136–147. [DOI] [PubMed] [Google Scholar]
- Li B., Carey M., Workman J.L. (2007). The role of chromatin during transcription. Cell 128: 707–719. [DOI] [PubMed] [Google Scholar]
- Li H., Soriano M., Cordewener J., Muiño J.M., Riksen T., Fukuoka H., Angenent G.C., Boutilier K. (2014). The histone deacetylase inhibitor trichostatin a promotes totipotency in the male gametophyte. Plant Cell 26: 195–209. [DOI] [PMC free article] [PubMed] [Google Scholar]
- Long J.A., Ohno C., Smith Z.R., Meyerowitz E.M. (2006). TOPLESS regulates apical embryonic fate in Arabidopsis. Science 312: 1520–1523. [DOI] [PubMed] [Google Scholar]
- Lorvellec, M. (2007). Chromatin Organization during Arabidopsis Root Development. PhD dissertation (Wageningen, The Netherlands: Wageningen University). [Google Scholar]
- Luger K., Mäder A.W., Richmond R.K., Sargent D.F., Richmond T.J. (1997). Crystal structure of the nucleosome core particle at 2.8 A resolution. Nature 389: 251–260. [DOI] [PubMed] [Google Scholar]
- Menand B., Yi K., Jouannic S., Hoffmann L., Ryan E., Linstead P., Schaefer D.G., Dolan L. (2007). An ancient mechanism controls the development of cells with a rooting function in land plants. Science 316: 1477–1480. [DOI] [PubMed] [Google Scholar]
- Meshorer E., Yellajoshula D., George E., Scambler P.J., Brown D.T., Misteli T. (2006). Hyperdynamic plasticity of chromatin proteins in pluripotent embryonic stem cells. Dev. Cell 10: 105–116. [DOI] [PMC free article] [PubMed] [Google Scholar]
- Mueller F., Morisaki T., Mazza D., McNally J.G. (2012). Minimizing the impact of photoswitching of fluorescent proteins on FRAP analysis. Biophys. J. 102: 1656–1665. [DOI] [PMC free article] [PubMed] [Google Scholar]
- Patterson G.H., Lippincott-Schwartz J. (2002). A photoactivatable GFP for selective photolabeling of proteins and cells. Science 297: 1873–1877. [DOI] [PubMed] [Google Scholar]
- Phair R.D., Misteli T. (2000). High mobility of proteins in the mammalian cell nucleus. Nature 404: 604–609. [DOI] [PubMed] [Google Scholar]
- Phair R.D., Gorski S.A., Misteli T. (2004). Measurement of dynamic protein binding to chromatin in vivo, using photobleaching microscopy. Methods Enzymol. 375: 393–414. [DOI] [PubMed] [Google Scholar]
- Roth S.Y., Denu J.M., Allis C.D. (2001). Histone acetyltransferases. Annu. Rev. Biochem. 70: 81–120. [DOI] [PubMed] [Google Scholar]
- Strahl B.D., Allis C.D. (2000). The language of covalent histone modifications. Nature 403: 41–45. [DOI] [PubMed] [Google Scholar]
- Ubeda-Tomas S., Federici F., Casimiro I., Beemster G.T., Bhalerao R., Swarup R., Doerner P., Haseloff J., Bennett M.J. (2009). Gibberellin signaling in the endodermis controls Arabidopsis root meristem size. Curr. Biol. 19: 1194–1199. [DOI] [PubMed] [Google Scholar]
- van den Berg C., Willemsen V., Hendriks G., Weisbeek P., Scheres B. (1997). Short-range control of cell differentiation in the Arabidopsis root meristem. Nature 390: 287–289. [DOI] [PubMed] [Google Scholar]
- Wildwater M., Campilho A., Perez-Perez J.M., Heidstra R., Blilou I., Korthout H., Chatterjee J., Mariconti L., Gruissem W., Scheres B. (2005). The RETINOBLASTOMA-RELATED gene regulates stem cell maintenance in Arabidopsis roots. Cell 123: 1337–1349. [DOI] [PubMed] [Google Scholar]
- Yi K., Menand B., Bell E., Dolan L. (2010). A basic helix-loop-helix transcription factor controls cell growth and size in root hairs. Nat. Genet. 42: 264–267. [DOI] [PubMed] [Google Scholar]
- Yoshida M., Beppu T. (1988). Reversible arrest of proliferation of rat 3Y1 fibroblasts in both the G1 and G2 phases by trichostatin A. Exp. Cell Res. 177: 122–131. [DOI] [PubMed] [Google Scholar]
- Yoshida M., Kijima M., Akita M., Beppu T. (1990). Potent and specific inhibition of mammalian histone deacetylase both in vivo and in vitro by trichostatin A. J. Biol. Chem. 265: 17174–17179. [PubMed] [Google Scholar]
Associated Data
This section collects any data citations, data availability statements, or supplementary materials included in this article.