

Abstract
A quantiatative structure property relationship (QSPR) treatment was used to a data set consisting of diverse 3-hydroxypyridine-4-one derivatives to relate the logarithmic function of octanol:water partition coefficients (denoted by log po/w) with theoretical molecular descriptors. Evaluation of a test set of 6 compounds with the developed partial least squares (PLS) model revealed that this model is reliable with a good predictability. Since the QSPR study was performed on the basis of theoretical descriptors calculated completely from the molecular structures, the proposed model could potentially provide useful information about the activity of the studied compounds. Various tests and criteria such as leave-one-out cross validation, leave-many-out cross validation, and also criteria suggested by Tropsha were employed to examine the predictability and robustness of the developed model.
Keywords: Genetic algorithm, Partial least square, Partition coefficient
INTRODUCTION
The logarithmic n-octanol/water partition coefficient (Log po/w) is a very important property which concerns water-solubility, bioconcentration factor, toxicity and soil absorption coefficient of organic compounds. This property determines the fate of a drug in the body by governing the absorption, distribution, storage and elimination processes. Partition coefficient is the ratio of the concentration of a chemical in n-octanol to that in water in a two-phase system at equilibrium. The n-octanol/water partition coefficient is a generally accepted physico-chemical parameter for characterization of lipophilicity (1). The logarithm of Partition coefficient, log po/w, has been shown to be one of the key parameters in quantitative structure-property relationship (QSPR) studies. Log po/w is a standard property determined for potential molecules in 5th Lipinski's rule (2). Lipophilicity affects drug absorption, bioavailability, hydrophobic drug-receptor interactions, and metabolism of drugs (1).
The partition coefficient, po/w, for a given drug-like compound is defined as the ratio of concentrations achieved at equilibrium between the two different media as expressed mathematically in Equation 1, where A can be octanol and B is water.

Quantitative structure property relationship (QSPR) research field provides medicinal chemists the ability to predict drug property by mathematical equations which construct a relationship between the chemical structure and the biological activity (3,4). These mathematical equations are in the form of y = xb+e that describes a set of predictor variables (x) with a predicted variable (y) by the means of a regression vector (b) (5). After the earlier QSAR studies by Hansch, who showed a correlation between biological activity and octanol-water partition coefficient (4), it is now assumed that the sum of substituent effects on the steric, electronic and hydrophobic interaction of compounds with their receptor determines their property or biological activity (6,7,8).
The first step in constructing the QSPR models is the selection of molecular descriptors that represent variation in the interested property of the molecules by a number (9). The selected descriptors then will be used for constructing statistical models. There are two types of QSAR/QSPR models: regression models and classification models. Among regression models multiple linear regression (MLR), principle component regression (PCR), and partial least squares (PLS) can be mentioned.
There are some methods which are inspired by the nature of which genetic algorithm is the most widely used, (10,11,12). Factor analysis identifies the important predictor variables contributing to the response variable and avoids collinearities among them. PLS analysis as a factor analysis–based method omits the multi-colinearity problem in the descriptors. In this method, the descriptors data matrix is decomposed to orthogonal matrices with an inner relationship between the dependent and independent variables. Because a minimal number of latent variables are used for modeling in PLS; this modeling method coincides with noisy data better than MLR.
Multiple linear regression yields models that are simpler and easier to interpret than PCR and PLS, because these methods perform regression on latent variables that don’t have a physical meaning. On the other hand, factor analysis–based methods can handle the collinear descriptors and therefore better predictive models will be obtained by PLS method (13).
The mathematical relationships between molecular descriptors and activity or property are used to find the parameters affecting the partition coefficient and/or estimate the property of other molecules. In this paper, more than 600 topological, geometrical, constitutional, functional group and chemical descriptors were used to develop different QSPR models for the log po/w of the studied compounds. The method used in this study for model construction was; genetic algorithm-partial least squares (GA-PLS).
Here, based on the octanol/water partition coefficient of 30 compounds of interest, we report a QSPR model by the GA-PLS technique. The purpose of the present study was to investigate the relationship between the octanol/water partition coefficient of studied compounds and their theoretical molecular descriptors. Moreover, molecular descriptors were discussed to explore the influence of structural features on the values of Log po/w. This paper provided a simple and straightforward way to predict the Log po/w values of studied compounds from their structures and gave some insight into structural features related to the Log po/w values of the compounds. The prediction results are satisfactory.
MATERIALS AND METHODS
Software
Two-dimensional structures of molecules were drawn using Hyperchem 7.0 software (14). The final geometries were optimized with the semi-empirical AM1 method in Hyperchem program. The geometries resulted were transferred into Dragon program package, developed by Milano Chemometrics and QSAR Group (15). MATLAB software was used for the PLS regression method and genetic algorithm.
Partition coefficient data and descriptor generation
The data used in this study were log po/w of some 3-hydroxy pyridine-4-one derivatives (internal unpublished data). The structural features of these compounds are listed in Table 1. They were used for subsequent QSPR analysis as independent variables.
Table 1.
Chemical structures of compounds used.

A large number of molecular descriptors was calculated using Dragon package. The Dragon software calculated different functional groups, topological, geometrical and constitutional descriptors for each molecule. The calculated descriptors for each molecule are summarized in Table 2.
Table 2.
Brief description of some descriptors used in this study.

Partial least square (PLS)
PLS is a regression approach which is used to build a predictive model between two matrices of variables: the X matrix of predictor variables and the Y matrix of dependent variables. In its simplest type of model building, a linear model indicates the relationship between dependent (bioactivity) variables and independent (descriptors) variables by means of latent variables (LVs).
In the PLS regression, it is assumed that X matrix (I × J) contains the descriptors that can be used for predicting the matrix of activities that is Y (I × M). Here the dependent variables are represented by an (I × 1) column vector. PLS decomposes these matrices into a two-matrix product plus residual.

where, T and U are the matrices of score for X and Y; P and Q are the matrices of loadings for X, Y; E and F are the matrices residual, respectively, for a model with f latent variables.
Above equations are solved in a way to maximize the covariance between T and U. These two matrices are related by the following inner relationship.
U = TB + H (3)
where, B is a diagonal matrix and H is a residual matrix. This allows PLS to be expressed as a predictive model. The matrix Y can be calculated from U as follows:
Y = TBQT + F (4)
The activity of the new compounds can be approximated from the new scores T*, which are substituted in the above equation, leading to the following equation:
Ypred = T × BQT (5)
In order to find the optimum number of latent variables to be used in model building, a leave-one-out cross validation was carried out (16).
RESULTS
Principal component analysis
QSPR using a univariate approach is not always a robust strategy. For instance, even if significant differences in the values of given descriptor was found, constructing the QSPR models based on only these descriptors would not be robust enough and the chances of misregressions would be very high. More powerful and robust methods might be developed by using the full compositional data (multivariate approach) instead of looking at the individual descriptors data (univariate approach). The main reason for this is that by using the full composition, more information is considered and, thus, the chances of wrong identifications decrease (17). Thus, multivariate statistics was used as a tool to reveal whether there was a specific descriptor pattern for each molecule. PCA was conducted on the crude data of the 30 molecules. The data matrix consisted of 30 rows (molecules) and 10 descriptors (selected by GA). The PCA scores plot revealed two outlying molecules (19 and 20). As shown in Fig. 1, these molecules are distinctly apart from other molecules. Further studies for considering these two molecules as outliers are discussed in following section. PCA on the descriptors data revealedthat there is no natural clustering (Fig. 1). The first three PCA factors together explained 96.9% of the variance in the data set. This clustering was more or less in agreement with the structure of molecules.
Fig. 1.

First three factors of the PCA scores plot on the descriptors calculated.
Genetic algorithm-partial least squares
PLS is a multivariate regression technique which involves a two-step procedure: (1) model formation, where the relation between descriptors and reference bioactivities is established from a set of training molecules and (2) prediction, in which the model formation results are employed to estimate the bioactivities in unknown molecules (18).
In the PLS-1 algorithm version, all model parameters are optimized for the each molecule at a time. During the model formation step, the training data are decomposed by an iterative algorithm, which correlates the data with the training bioactivities using a so-called ‘inverse’ model (19). This provides a set of regression coefficients to be used to a new molecule. Before training, however, the optimum number of latent variables A should be selected in order to avoid overfitting by applying the cross-validation method described by Haaland and Thomas (19). The PLS-1 method is well known, and details on its implementation are easily available (18) and (19).
Before running the PLS-1, in order to find the more convenient set of descriptors, genetic algorithm was used. To do so, many different GA-PLS runs were conducted using different initial sets of populations.
The data set was divided into two groups: training set (n=24) and prediction set (n=6). Given 24 training molecules, PLS gives nine significant LVs (the percent of variance explained >0.01) which can explain around 99% of the variances in the original descriptors data matrices. Four LVs are reported in Table 3.
Table 3.
The results of PLS on the total calculated descriptors.

In this Table, the percent of variances was explained by each LVs and the cumulative percent of variances are represented.
Therefore, we restricted the next studies to the selection of best subset of these LVs to perform regression between descriptors and log Po/w.
After dividing the molecules into two parts, calibration and validation sets, based on Kennard and Stone algorithm (20), building of regression model using calibration set was carried out.
The predicted log Po/w valuesusing PLS regression technique are listed in Table 4 and are plotted in Fig. 2. The plot of Fig. 2 shows that the data are distributed around a straight line with the respective slope equal to 0.907.
Table 4.
The experimental log Po/w and the predicted values of the molecules studied.

Fig. 2.
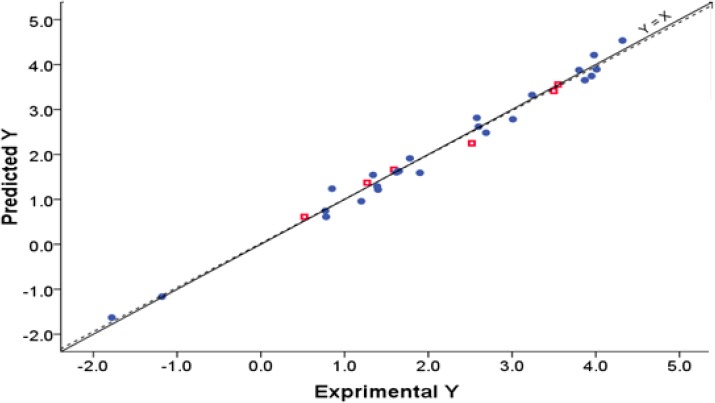
Correlation between the experimentally measured and the predicted values of Y for the training and test sets of 30 compounds. The fitted linear regression is shown by dotted line.
As it can be seen from Table 5, the QSAR model based on PLS possess a high statistical quality. It could respectively explain and predict 98% and 99% of variances in log Po/w of the investigated compounds. The pre-dictability of the generated PLS-based QSPR model was estimated according to Tropsha and coworkers (21) and Roy and coworkers (22) recommended criteria (Table 5). The results of LOO-CV technique applied on the training set are reported in Table 5. This results showed that generated PLS model is a reasonable QSPR model. These results confirm the success of calculated descriptors in modeling of the partition coefficent of the studied compounds. The value of R2 for test set is reported in Table 5. The data revealed that the proposed model has high prediction ability for the prediction set. The proposed regression models passed all the Tropsha tests for the predictive ability. Values of these quantities are shown in Table 5.
Table 5.
Statistics parameters and figures of merits of developed GA-PLS model.

DISCUSSION
To solve the problem of multicollinearity in the generated descriptors, PLS regression as a linear method was used to model structure-log Po/w relationships quantitatively. All the calculated descriptors were used in the modeling procedure.
The PLS method is a multivariate regression approach that projects the input–output data down in to a latent space, extracting a number of principal factors with an orthogonal structure, while capturing most of the variance in the original data. PLS derives its usefulness from its ability to analyze data with strongly collinear, noisy and numerous variables in the predictor matrix X and responses Y (23) and (24). Both the linear and non-linear PLS methods have successfully been applied to predict the dependent variable(s) through modeling the input–output relationship in the data (25) and (26).
There are several tools to estimate and calculate the accuracy, the validity of the proposed QSPR model and the impacts of the preprocessing steps. Here, we have employed several techniques to ensure the effectiveness of the PLS in the modeling of log Po/w of studied compounds. Some of the common parameters used for checking the predictability of proposed PLS model are root mean square error (RMSE), square of the correlation coefficient (R2), and predictive residual error sum of squares (PRESS). These parameters were calculated as follows:

where, yi is the measured bioactivity of the investigated compound i,  represents the calculated bioactivity of the compound i,
  is the mean of true activity in the studied set, and n is the total number of molecules used in the studied sets.
The efficacy of QSPR models is not just their capability to regenerate known data, but also they should have talent to generate a good estimation for any external data (27). The predictabilities of developed models are powerfully influenced by the overfitting problem. Overfitting problem is occurred when uninformative regressions enter to the developed QSAR model. Another reason of overfitting problem is the use of exceeded number of LVs in PLS model. There are several techniques to approximate the quality and accuracy of the QSAR models (28). Cross-validation is the most regularly employed validation techniques (29). Consequently, to examine the predictability and to check overfitting problem in the resulting PLS model, the leave-one-out cross-validation procedure was employed. The squared correlation coefficient for cross-validation (R2CV) was then calculated by the following equation.

where, PRESS and SSD are the predicted residual sum of squares and the sum of the squared deviation from the mean, respectively.
For a generated QSAR model, internal validation (including leave-one-out cross validation), although significant and essential, does not adequately assure the predictability of a developed model. In fact, it is insisted that models with high apparent predictive ability which is highlighted only by internal validation methods cannot be predictive when applied on new compounds which not employed in developing the model.
Thus, for a stronger estimation of the application of developed model for prediction on new chemicals, external validation of the models should always be carried out(21). To complete the study with regards to the predictability of the generated model, the proposed PLS must be used to predict the activity of ten molecules that did not employ in the modeling step (the testing set compounds). This predictive ability is estimated by the external R2p (R2 for test set) that is defined as follows:(30):

where, is the average value of the bioactivity for the training set. The summations cover all the molecules in the testing set.
Some criteria are suggested by Tropsha (21). If these criteria were satisfied then it could be concluded that the model is predictive (21). These criteria include:

R2 is the correlation coefficient of regression between the predicted and observed activities of the compounds in training and test sets. R20 is the correlation coefficients for regressions between predicted versus observed activities through the origin, R’20 is the correlation coefficients for regressions between observed versus predicted activities through the origin, and the slope of the regression lines through the origin are assigned by k and k ', respectively. Details of definitions of parameters such as R20, R’20, k and k' are presented in the literature (21). In addition, according to Roy and coworkers (22) the difference between values of R20 and R’20 must be studied and given importance. They suggested following modified R2 form:

If R2m value for given model is > 0.5, indicates good external predictability of the developed model.
QSAR applicability domain
The applicability of domain (AD) was explained by the Williams plot of standardized residuals versus leverage (Hat diagonal) values (hi). The leverage method for defining the AD has been explained in details in the literature (22). The leverage (h) value of a compound in the original independent variable space is defined as below:

where, xi is the LV vector of the investigated compound and X is the model matrix derived from the training set LV values.
The warning leverage value (h*) is defined as 3(K + 1)/n, where, K is the number of independent variables. When h value of a molecule is lower than h*, the probability of accordance between calculated and experimental values is as high as that of the molecules in the training set (31). A compound with hi>h* will reinforce the model if the compound is in the training set, but such a compound in the testing set implies that it is structurally distant from chemicals in the calibration set and its predicted data may be unreliable. However, this compound may not appear to be an outlier because its residuals may be low. Thus the leverage and the standardized residual should be used simultaneously for the description of the AD of the expanded model.
It must be noted that the outliers are objects that emerge to break the pattern or grouping shown by the majority of the objects. Presence of outliers in the studied data set is more the rule than the exception for real world data. The reasons for outliers are different, such as instrument failure, non-representative sampling, formatting errors and observations stemming from other populations. Most usual multivariate regression techniques are sensitive to outliers because of the fact that they are based on least squares or similar criteria where even one outlier can have an illogically large effect on the accuracy of developed model and decline the model.
Therefore, it is essential to (a) recognize outliers and (b) make a decision whether the outliers should be included or omitted in the modeling step.
Applicability of domain for the developed PLS model is shown in Fig. 3. Response outliers are compounds that have standard residual points greater than the two standard deviation units. Influential compounds are points with leverage value higher than the warning leverage limit. As can be seen in Fig. 3 all studied molecules in training and test sets lie in application domain of developed model.
Fig. 3.

William's plot of generated PLS-based QSPR model.
CONCLUSION
QSPR studies are an important tool for research and knowledge of chemical compounds and it has been frequently used in medicinal chemistry and molecular design to investigate new drugs. It is especially useful when the experimental determination of properties is very complex, the handling of materials may involve some risk, or determinations may not be easy in cases where compounds can quickly degrade.
Quantitative relationships between molecular structure and log po/w data of a series of 3-hydroxypyridine-4-one derivatives were discovered by a chemometric method, GA-PLS. The results revealed the significant role of constitutional parameters in the partition coefficient of the studied compounds. As it is observed, the plot of data resulted by GA-PLS represents the low scattering, and the impact of constitutional descriptors was high. Since the QSPR study was carried out on the basis of theoretical descriptors completely calculated from molecular structure, the proposed model could potentially provide useful information about the log po/w of the compounds studied. Various tests and criteria such as leave-one-out cross validation, leave-many-out cross validation, and also criteria suggested by Tropsha were employed to examine the predictability and robustness of the developed model. This model could explain and predict 98 % and 99 % of variances in the p logp data, respectively.
ACKNOWLEDGMENT
This research was performed by the financial support of the School of Pharmacy and Pharmaceutical Sciences, Isfahan University of Medical Sciences
REFERENCES
- 1.Saghaie L, Hider RC, Mostafavi SA. Comparison of automated continuous flow method with shake- flask method in determining partition coefficients of bidentate hydroxypyridinone ligands. DARU J Pharm Sci. 2003;11:38–46. [Google Scholar]
- 2.Lipinski CA, Lombardo F, Dominy BW, Feeney PJ. Experimental and computational approaches to estimate solubility and permeability in drug discovery and development settings. Adv Drug Deliv Rev. 1997;23:3–25. doi: 10.1016/s0169-409x(00)00129-0. [DOI] [PubMed] [Google Scholar]
- 3.Hansch C, Hoekman D, Gao H. Comparative QSAR: toward a deeper understanding of chemicobiological interactions. Chem Inform. 1996;96:1045–1076. doi: 10.1021/cr9400976. [DOI] [PubMed] [Google Scholar]
- 4.Hansch C, Maloney PP, Fujita T, Muir RM. Correlation of biological activity of phenoxyacetic acids with Hammett substituent constants and partition coefficients. Nature. 1962;194:178–184. [Google Scholar]
- 5.Shahlaei M, Fassihi A, Saghaie L. Application of PC-ANN and PC-LS-SVM in QSAR of CCR1 antagonist compounds: a comparative study. Eur J Med Chem. 2010;45:1572–1582. doi: 10.1016/j.ejmech.2009.12.066. [DOI] [PubMed] [Google Scholar]
- 6.Fujita T, Iwasa J, Hansch C. A new substituent constant, π, derived from partition coefficients. J Am Chem Soc. 1964;86:5175–5180. [Google Scholar]
- 7.Hansch C. Quantitative approach to biochemical structure-activity relationships. Accounts Chem Res. 1969;2:232–239. [Google Scholar]
- 8.Hansch C, Clayton JM. Lipophilic character and biological activity of drugs II: The parabolic case. J Pharm Sci. 1973;62:1–21. doi: 10.1002/jps.2600620102. [DOI] [PubMed] [Google Scholar]
- 9.Agatonovic-Kustrin S, Tucker I, Zecevic M, Zivanovic L. Prediction of drug transfer into human milk from theoretically derived descriptors. Analytica Chimica Acta. 2000;418:181–195. [Google Scholar]
- 10.Putta S EJ, Lemmen C, Stanton RJ. A novel subshape molecular descriptor. Chem Inf Comput Sci. 2003;43:1623–1635. doi: 10.1021/ci0256384. [DOI] [PubMed] [Google Scholar]
- 11.Gupta S, Singh M, Madan A. Superpendentic index: a novel topological descriptor for predicting biological activity. J Chem Inf Com Sci. 1999;39:272–277. doi: 10.1021/ci980073q. [DOI] [PubMed] [Google Scholar]
- 12.Consonni V, Todeschini R, Pavan M, Gramatica P. Structure/response correlations and similarity/diversity analysis by GETAWAY descriptors. 2. Application of the novel D molecular descriptors to QSAR/QSPR studies. J Chem Inf Com Sci. 2002;42:693–705. doi: 10.1021/ci0155053. [DOI] [PubMed] [Google Scholar]
- 13.Deeb O, Hemmateenejad B, Jaber A, Garduno-Juarez R, Miri R. Effect of the electronic and physicochemical parameters on the carcinogenesis activity of some sulfa drugs using QSAR analysis based on genetic-MLR and genetic-PLS. Chemosphere. 2007;67:2122–2130. doi: 10.1016/j.chemosphere.2006.12.098. [DOI] [PubMed] [Google Scholar]
- 14.Hyper Chem (TM) USA: Hypercube, Inc., 1115 NW 4th Street, Gainesville, Florida 32601; [Google Scholar]
- 15.Todeschini R, Consonni V, Pavan M. Milan, Italy: Talete SRL; 2002. DRAGON, version 2.1. [Google Scholar]
- 16.Wold H. Estimation of principal components and related models by iterative least squares. Multivariate analysis. 1966;1:391–420. [Google Scholar]
- 17.Ulberth F, Buchgraber M. Authenticity of fats and oils. EuroJLipid SciTech. 2000;102:687–694. [Google Scholar]
- 18.Martens H, Naes T. Wiley: Multivariate calibration; 1992. [Google Scholar]
- 19.Haaland DM, Thomas EV. Partial least-squares methods for spectral analyses. 1. Relation to other quantitative calibration methods and the extraction of qualitative information. Anal Chem. 1988;60:1193–1202. [Google Scholar]
- 20.Kennard RW, Stone LA. Computer aided design of experiments. Technometrics. 1969;11:137–148. [Google Scholar]
- 21.Tropsha A, Gramatica P, Gombar VK. The importance of being earnest: validation is the absolute essential for successful application and interpretation of QSPR models. QSAR & Combinatorial Science. 2003;22:69–77. [Google Scholar]
- 22.Roy PP, Roy K. On some aspects of variable selection for partial least squares regression models. QSAR Comb Sci. 2008;27:302–313. [Google Scholar]
- 23.Wold S, Rube A, Wold H, Dunn WJ. The collinearity problem in linearregression. The partial least squares approach to generalized inverses. SIAM J Sci Stat Comput. 1984;3:735–743. [Google Scholar]
- 24.Wold S, Sjöström M, Eriksson L. PLS-regression: a basic tool of chemometrics. Chemomet Intell Lab. 2001;58:109–130. [Google Scholar]
- 25.Singh KP, Malik A, Basant N, Saxena P. Multi-way partial least squares modeling of water quality data. Analytica Chimica Acta. 2007;584:385–396. doi: 10.1016/j.aca.2006.11.038. [DOI] [PubMed] [Google Scholar]
- 26.Kimura T, Miyashita Y, Funatsu K, Sasaki S. Quantitative structure-activity relationships of the synthetic substrates for elastase enzyme using nonlinear partial least squares regression. J Chem Inf Comp Sci. 1996;36:185–189. doi: 10.1021/ci9501103. [DOI] [PubMed] [Google Scholar]
- 27.Gramatica P, Papa E. QSAR modeling of bioconcentration factor by theoretical molecular descriptors. QSAR & Combinatorial Science. 2003;22:374–85. [Google Scholar]
- 28.Wold S. Validation of QSAR's Quantitative structure-activity relationships. 2006;10:191–193. [Google Scholar]
- 29.Zhang WTA. Novel variable selection quantitative structure–property relationship approach based on the k-nearest-neighbor principle. J Chem Inf Comput Sci. 2000;40:185–94. doi: 10.1021/ci980033m. [DOI] [PubMed] [Google Scholar]
- 30.Atkinson AC. Clarendon Press Oxford; 1985. Plots, transformations, and regression: an introduction to graphical methods of diagnostic regression analysis. [Google Scholar]
- 31.Shahlaei M, Fassihi A, Nezami A. QSAR Study of some 5-methyl/trifluoromethoxy-1H-indole-2, 3-dione-3-thiosemicarbazone derivatives as anti-tubercular agents. ResPharm Sci. 2009;4:123–131. [PMC free article] [PubMed] [Google Scholar]