

Abstract
Objective
To acquire ultra-high resolution images of the brain using balanced steady-state free precession (bSSFP) at 7.0T and to identify the potential utility of this sequence.
Materials and Methods
8 subjects participated in this study after providing informed consent. Each subject was scanned with 8 phase-cycles of bSSFP at 0.4mm isotropic resolution using 0.5 NEX and two-dimensional parallel acceleration of 1.75 × 1.75. Each phase cycle required 5 minutes of scanning, with pauses between the phase cycles allowing short periods of rest. The individual phase cycles were aligned and then averaged. The same subjects underwent scanning using 3D multi-echo GRE at 0.8mm isotropic resolution, 3D CUBE T2 at 0.7mm isotropic resolution, and thin-section coronal oblique T2-weighted FSE at 0.22 × 0.22 × 2.0 mm resolution for comparison. Two neuroradiologists assessed image quality and potential research and clinical utility.
Results
Subjects generally tolerated the scan sessions well, and composite high-resolution bSSFP images were produced for each subject. Rater analysis demonstrated that bSSFP had superior 3D visualization of the microarchitecture of the hippocampus, very good contrast to delineate the borders of the subthalamic nucleus, and relatively good B1 homogeneity throughout. In addition to excellent visualization of the cerebellum, subtle details of brain and skull base anatomy were also easier to identify on the bSSFP images, including the line of Gennari, membrane of Lillequist, and cranial nerves. bSSFP had a strong iron contrast similar to or better than the comparison sequences. However, cortical gray-white contrast was significantly better with CUBE T2 and T2-weighted FSE.
Conclusions
bSSFP can facilitate ultra-high resolution imaging of the brain. While total imaging times are long, the individually short phase-cycles can be acquired separately, improving exam tolerability. These images may be beneficial for studies of the hippocampus, iron-containing structures such as the subthalamic nucleus and line of Gennari, and the basal cisterns and their contents.
Keywords: bSSFP, FIESTA, hippocampus, subthalamic nucleus, high-resolution, 7T, SRLM, brain
INTRODUCTION
Ultra-high field magnetic resonance imaging offers the promise of improved visualization of anatomy and micropathology in the human central nervous system [1, 2]. In spite of the challenges posed by high-field physics, many groups have developed or optimized techniques to produce stunning images of the brain. Two-dimensional T2*-weighted sequences were the first to be widely employed, taking advantage of natural iron-based contrast at high field [3–8]. Susceptibility mapping takes advantage of this iron contrast in phase imaging to produce impressive images of the deep gray nuclei at 7T [9]. Variations on spoiled gradient-recalled echo have been used for T1-weighted imaging with resolution as high as 0.5mm isotropic [10], and specialized image acquisition and processing can mitigate the B1 transmit and receive inhomogeneities [11]. FLAIR requires magnetization-preparation and delivers high contrast applicable to disorders such as MS [12]. T2-weighted FSE has been used to depict the details of the human hippocampal formation[13]. Each of these techniques has benefits and limitations at 7T. Most are subject to marked signal intensity heterogeneity attributable to wavelength effects [14–17]. More importantly, there is a need for whole-brain and/or skull-base sequences with clinically useful contrast at a resolution significantly beyond what can be performed at 3.0T (i.e. smaller than 0.6mm isotropic with T2-weighting).
Balanced steady state free precession (bSSFP) is a sequence in routine clinical use for detecting pathology involving the cranial nerves and skull base because of its excellent CSF-tissue contrast [18]. Furthermore, bSSFP demonstrates iron-sensitivity [19] and is an efficient sequence with a high intrinsic signal-to-noise ratio (SNR) [20]. At 7T, phase-imaging with bSSFP has demonstrated SNR benefits compared to GRE per unit imaging time [21]. While bSSFP suffers from bands of signal hypointensity due to B0 inhomogeneity, these can be remedied by phase cycling [22, 23]. Finally, bSSFP can be performed with low flip angles to avoid the limitations on the specific absorption rate (SAR) that can often be prohibitive at 7T. As bSSFP is relatively unexplored at ultra-high field, we sought to acquire very-high resolution bSSFP images of the whole brain at 7T and to compare them to more standard imaging sequences. We specifically hypothesize that bSSFP will, because of its intrinsically high SNR and near-microscopic resolution achievable at 7T, will be superior to other commonly employed 7T techniques in the visualization of the small intricate structures such as the hippocampal formation, iron-containing nuclei such as the subthalamic nucleus, and the cranial nerves within the basilar cisterns.
MATERIALS AND METHODS
Acquisition
Six young, healthy normal controls and two patients with epilepsy provided informed consent in accordance with the Stanford IRB and HIPAA. They were scanned with a 7.0T GE Discovery MR950 scanner using a Nova RF coil (quadrature transmit, 32-channel receive). After acquiring localizers and performing high-order B0 shimming to approximately 20 Hz r.m.s. uniformity, we acquired 8 increments of phase-cycled bSSFP (3D FIESTA (Fast Imaging Employing STeady-state Acquisition), coronal, frequency S/I, TR 8.2ms, TE 4.1ms, FA 25°, NEX 0.5 with 32 overscans (extra lines beyond the center of k-space), BW 62kHz, FOV 17cm, 420×420 reconstructed to 512×512, 0.4mm isotropic acquisition, 480 slices, ARC (Autocalibrating Reconstruction for Cartesian imaging [24]) parallel acceleration of 1.75×1.75, scan time 5:11 per phase cycle). bSSFP demonstrates bands of hypointensity from magnetic field inhomogeneity: one can shift the location of these bands by phase cycling, then average the images together to reduce or eliminate the bands [22, 23]. Eight phase cycles was chosen to maximize the SNR and minimize banding while still being within the limits of subject tolerability. If an individual phase-cycle was subjectively judged to be motion contaminated, it was repeated. To compare coverage between this sequence and other sequences, three other imaging sequences were acquired either after the bSSFP (in the two patients and in two controls) or in a separate scanning session (the remaining four controls): whole brain coronal 3D CUBE T2 optimized for best gray-white contrast at 7T (3D T2-weighted fast-spin echo with modulation of the refocusing pulses originally designed at 3T [25] but optimized for 7T, coronal, TR 5s, TE effective 83ms, TE actual 285ms, ETL 140, NEX 1, BW 83kHz, ARC 2×2, 256×256, FOV 17.9cm, 266 slices, 0.7mm isotropic acquisition, scan time 9:09), 2D thin section coronal T2-weighted FSE [13] (coronal oblique, TR ~6s, cardiac gated, TE 47ms, refocusing FA140deg, ETL 8, NEX 1, BW 20kHz, 768×768, FOV 17cm, slice thickness 1.5mm, slice gap 0.5mm, 16 slices, 0.22×0.22×2mm, scan time 10–12 minutes depending on heart rate), and 3D multi-echo GRE (axial, TR 25.6ms, 6 TEs equally spaced from 3.5–22ms utilizing unipolar echoes, FA 15deg, NEX 1, BW 62kHz, ASSET parallel acceleration of 2 [26], FOV 20cm, 256×256, 186 slices, 0.8mm isotropic, scan time 6:15, similar to other multi-echo GRE acquisitions [9]). Three of the prior normal volunteers and one new normal volunteer (who also underwent bSSFP scanning but was otherwise not included in the above analysis) were brought back for repeat scanning with three to four repetitions (three for the one subject who underwent 6 phase cycles of bSSFP, four repetitions for the rest) of the 9-minute CUBE T2 in order to provide for an additional acquisition time matched comparison to the bSSFP.
Image Processing
Because motion can occur between bSSFP phase cycles, an alignment procedure was employed (Figure 1). Individual phase cycle images (Supplementary Digital Content 1 and 2) were reconstructed and combined into an initial sum-of-squares image (SOS-1). The SOS reconstruction was chosen because it has been shown to have optimal band reduction with minimal SNR loss [27]. The FSL (Functional magnetic resonance imaging of the brain (FMRIB) Software Library) version 5.0 command FLIRT (FMRIB’s Linear Registration Tool [28]) was then used to perform a rigid body alignment of each phase cycle to the SOS-1 using a normalized correlation cost function, interpolating with a sinc kernel and using a Hanning window of width 7 pixels. We then recombined into a second SOS image (SOS-2), and this procedure was repeated once to produce a final reconstructed volume (SOS-3). Such iterative algorithms have been used in other image alignment procedures [29]. A similar alignment procedure was utilized for the multi-repetition CUBE T2 sequences. Images for figures were captured using OsiriX (a free DICOM viewer, http://www.osirix-viewer.com/). Supplemental digital movies were lossy compressed with handbrake (handbrake.fr), which does introduce mild image smoothing.
Figure 1.
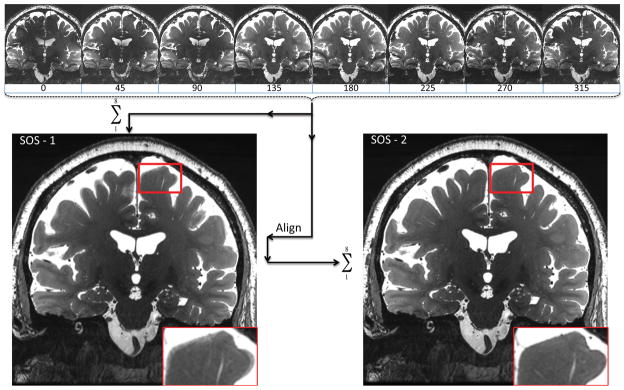
Averaging the eight phase cycles from bSSFP to produce a sum-of-squares (SOS-1) image, followed by aligning the eight phase cycles to the SOS-1 to produce a more refined SOS-2.
Image Analysis
For the assessment of iron contrast in all eight subjects, a 2–4mm diameter circular region-of-interest (ROI) was placed in the center of the red nuclei on an axial section/reformat of the 3D sequences (multi-echo GRE, CUBE T2, and bSSFP) with a background region in the midline of the midbrain midway between the red nuclei and cerebral aqueduct. Contrast was computed as the difference divided by the sum of the mean signal in the two ROIS ||((SRED−SBACKGROUND)/(SRED+SBACKGROUND))||.
Images from all 8 scans were presented using an OsiriX workstation to two experienced neuroradiologists (Authors 3 and 6), who separately compared pairs of images, specifically with bSSFP paired with either CUBE T2, Coronal T2-weighted FSE, or multi-echo GRE, rating the pairs with a seven-point scale (Table 1) in order to provide the best range for statistical comparison on a small sample-size. Each of eight aspects was evaluated (Table 2). Each rater was given example images from the literature of desirable hippocampal segmentation anatomy [30], subthalamic visualization [9, 31–33], B1 inhomogeneity [11, 34], and depictions of the line of Gennari and membrane of Lillequist [35, 36].
Table 1.
Rater Scoring Scale for which bSSFP is compared with all other sequences.
| Score | Interpretation |
|---|---|
| 1 | bSSFP much worse |
| 2 | bSSFP worse |
| 3 | bSSFP mildly worse |
| 4 | bSSFP equivalent |
| 5 | bSSFP mildly better |
| 6 | bSSFP better |
| 7 | bSSFP much better |
Table 2.
Components of image analysis the raters scored.
| Hippocampal 3D multiplanar subfields for detailed segmentation |
| Hippocampal global evaluation for atrophy |
| Deep iron visualization for presurgical multi-planar planning of the 3D location of the STN |
| Lack of signal dropout globally (B1 homogeneity) |
| Conspicuity of line of Gennari in the occipital lobe |
| Conspicuity of membrane of Lillequist |
| Conspicuity of cranial nerves III, V, and VI |
| Cortical gray-white contrast |
Overall reader agreement was assessed with linearly weighted kappa, with confidence interval estimated by 1000 bootstrap replications. Performance of bSSFP, overall and per-aspect, was evaluated by two-sided signed-rank test against a null hypothesis of a rating of “4” (bSSFP equivalent to the other method). For the statistical tests, a Bonferroni-corrected level of 0.002 was used.
In addition, the time-matched CUBE T2 was rating against the bSSFP, again using the 7-point rating scale, and exclusively evaluating hippocampal 3D multiplanar subfield definition.
RESULTS
Exam tolerability
The short 5-minute individual phase-cycles were tolerated by the volunteers, with only two of the 46 phase cycles across all subjects requiring repetition. One volunteer underwent 6 rather than 8 phase-cycles because of scan time constraints, not tolerability. For one of the patients, three of the 16 phase-cycles required repetition because of motion artifact; for this reason, this subject did not undergo multi-echo GRE imaging. The other patient did not require repetition. Though not specifically asked, the raters commented on motion artifact in coronal T2-weighted FSE (2 cases for one rater, 1 case for the other rater), CUBE T2 (1 and 1), and multi-echo GRE (2 and 0), but not for bSSFP.
General imaging findings
The bSSFP images showed very little motion artifact and were relatively uniform in signal intensity across the intracranial structures, with unusually high homogeneity considering these are uncorrected 7T images (Figure 2, Supplementary Digital Content 3–5). Banding is much reduced compared to a single phase cycle (Supplementary Digital Content 1–2) but still visible near the bases of the frontal and temporal lobes (white arrows on Figure 2B and C). Normal perivascular spaces are highly conspicuous (Figure 2C).
Figure 2.

Coronal, sagittal, and axial views of bSSFP one healthy subject. White arrows point to residual banding artifact. The horizontal band of hyperintensity obscuring the orbits is artifact along the left-right phase-encode direction from ocular motion.
Iron Contrast (Figure 3)
Figure 3.

Comparison of iron contrast in the red nuclei (top row) as well as conspicuity of a developmental venous anomaly (bottom row) between multi-echo GRE (left-mGRE), bSSFP (middle), and CUBE T2 (right) on two healthy subjects.
Iron contrast in the red nuclei measured similar between bSSFP (0.200 +/− 0.030), CUBE T2 (0.189 +/− 0.158, paired t-test p>0.05), and Coronal T2-weighted FSE (0.182 +/− 0.022, p>0.05), but bSSFP had slightly better contrast than multi-echo GRE (0.144 +/− 0.043, p=0.002)(Figure 3, top row). Venous contrast was well demonstrated in a normal-variant developmental venous anomaly (DVA, Figure 3, bottom row).
Rater analysis of 7T bSSFP with multi-echo GRE, Cube T2, and thin-section coronal T2-weighted FSE (Table 3, Figure 4)
Table 3.
Rater Analysis with median scores across raters.
| bSSFP compared with | |||
|---|---|---|---|
| Multi-echo GRE | CUBE T2 | Cor. T2-weighted FSE | |
| Hippocampal 3D multiplanar subfields for detailed segmentation | 7† | 6† | 6† |
| Hippocampal global evaluation for atrophy | 7† | 4 | 4 |
| Deep iron visualization for presurgical multi-planar planning of the 3D location of the STN | 5 | 6† | 4 |
| Lack of signal dropout globally (B1 homogeneity) | 5 | 6 | 7† |
| Conspicuity of Line of Gennari in the occipital lobe | 7† | 6† | N/A |
| Conspicuity of Membrane of Lillequist | 5† | 6 | 7† |
| Conspicuity of Cranial Nerves III, V, and VI | 7† | 7† | 7† |
| Cortical Gray-White Contrast | 7† | 2† | 2† |
p < 0.002 for the null hypothesis that bSSFP is equivalent. 1=bSSFP much worse, 7=bSSFP much better. N/A: the field of view of the coronal T2-weighted FSE did not include the calcarine sulcus.
Figure 4.

Histograms of rater scores for bSSFP vs. multi-echo GRE/Cor. T2-weighted FSE/CUBE T2
bSSFP compared with multi-echo GRE, Cube T2, and coronal T2-weighted FSE demonstrated kappa’s of 0.36, 0.67, and 0.60, respectively. The low kappa values are likely due to the small sample size and small number of reviewers; observed agreement was very high (84–90%).
Hippocampus
The global clinical evaluation of hippocampal atrophy was similar to both CUBE and coronal T2-weighted FSE (Figure 5). The hippocampus demonstrated intricate detail in all three planes with bSSFP, however, and this provided a superior 3-D depiction of hippocampal morphology that would be suitable to segmentation studies (Figure 6, rater analysis p < 0.0005). For example, the hypointense band within the hippocampus (termed the stratum radiatum and lacunosum-moleculare – SRLM – of field CA 1, though also containing white matter fibers) is well seen in the coronal plane on the three sequences (Figure 5), but the bSSFP surpasses all of them because it has the highest isotropic resolution and enough contrast to fully delineate the 3D microstructure in all three planes (Figure 6). The bSSFP was still rated as superior to the time-matched CUBE T2 for segmentation purposes in 3 out of 4 normal volunteers by both raters (Figure 7). In one normal volunteer, the bSSFP was slightly better than the CUBE T2 for one rater and vice-versa for the other rater.
Figure 5.

Comparison of left hippocampal head anatomy on bSSFP, matched posterior-to-anterior sections in a healthy subject. Black arrows point to layer stratum radiatum and lacunosum-moleculare (SRLM [30, 47–49]), the hypointense band centrally within the hippocampus. Images for the CUBE T2 and T2-weighted FSE are displayed in native space without alignment or interpolation.
Figure 6.
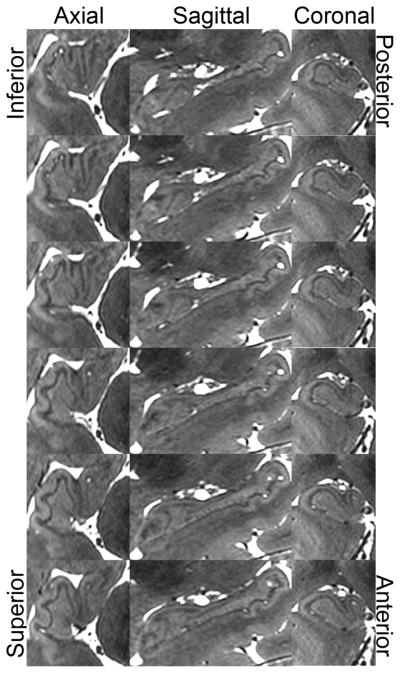
Right hippocampal head anatomy in a healthy subject as visualized by bSSFP. Sagittal progresses from medial (top) to lateral (bottom).
Figure 7.

Hippocampal heads in a healthy subject in time-matched CUBE T2 (top) and bSSFP (bottom). The left-right asymmetry is due to slight head rotation.
Visualization of the subthalamic nucleus
Deep gray structures such as the subthalamic nucleus were readily apparent and visually separable from the adjacent substantia nigra in both the coronal and sagittal planes (Figure 8). Coronal T2-weighted FSE achieved an equivalent contrast as judged by raters, but is impractical for pre-surgical planning and for volumetry/segmentation because of its anisotropic voxel size. bSSFP was deemed superior to CUBE T2, likely because of the higher resolution. bSSFP offered slightly better visualization than did multi-echo GRE (p=0.01, not significant after Bonferroni correction), and achieved a notably higher spatial resolution than multi-echo GRE.
Figure 8.
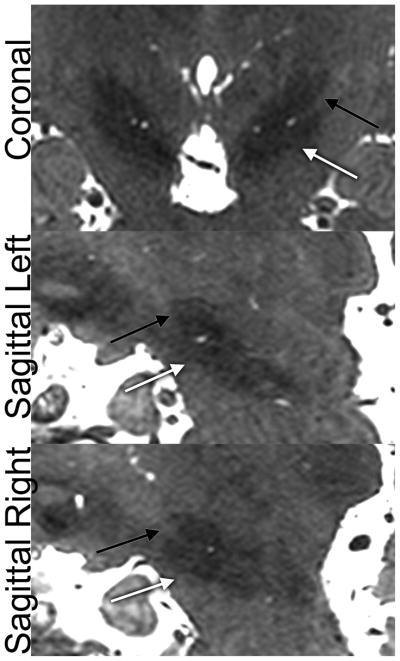
Subthalamic nucleus (STN) localization in a healthy subject as visualized by bSSFP. Black arrow = STN, white arrow = substantia nigra.
B1 homogeneity
bSSFP homogeneity was superior across the intracranial structures compared to 2D FSE (p=0.0005), and demonstrated slightly better homogeneity compared with CUBE and multi-echo GRE (p=0.0025 and 0.02, respectively, not significant after Bonferroni correction) without any image correction (Figure 9). While most 7T studies suffer from poor visibility of the posterior fossa, bSSFP demonstrated intricate details of the cerebellum (Figure 2).
Figure 9.

Relative homogeneity of B1 in bSSFP in a healthy subject. However, cortical gray-white contrast is still better in CUBE T2 and T2-weighted FSE.
Microscopic Anatomy
On all of the other features of intricate microstructure tested, bSSFP performance was equal to or better than the other sequences (Table 3). The balance of high-resolution and iron-sensitivity in bSSFP facilitates superior visualization of the line of Gennari [35]. It was best seen in the coronal plane in the bSSFP sequence and clearly identified in 6/8 subjects for each rater (Figure 10). This was difficult to visualize in all other sequences. Additionally, the membrane of Lillequist was well seen in 6/8 subjects (Figure 11), significantly better than multi-echo GRE and coronal T2-weighted FSE and slightly better than the CUBE T2 (p=0.0012, p=0.0004, and p=0.0059, uncorrected, respectively). bSSFP provided superior visualization of the adjacent third, fifth, and sixth cranial nerves, and CSF was identified tracking along the abducens nerve as it traversed the skull base (Figure 12).
Figure 10.

Conspicuity of the line of Gennari on coronal bSSFP in a healthy subject.
Figure 11.

Conspicuity of the membrane of Lillequist on coronal and sagittal bSSFP in a healthy subject.
Figure 12.
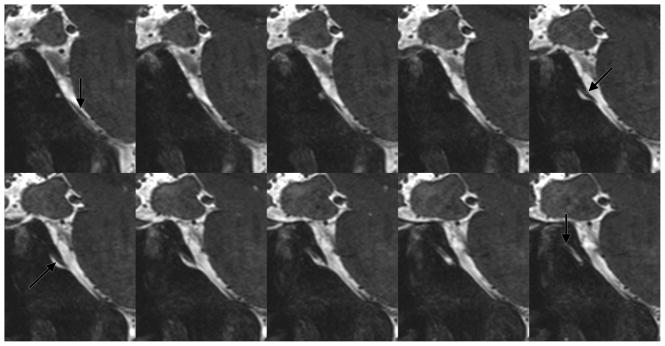
Abducens nerve on sagittal bSSFP in a healthy subject.
Cortical Gray-White Contrast
Gray-white contrast with bSSFP was significantly better compared to multi-echo GRE but significantly lacking compared to the coronal T2-weighted FSE and CUBE T2 (Figures 3, 9).
Discussion
bSSFP has typically been used clinically for evaluation of extra-axial structures such as cisternal segments of cranial nerves, and this study demonstrates that this advantage over other sequences remains true at 7.0T. Moreover, we have demonstrated the utility of bSSFP in other regions of the brain. Because of bSSFP’s intrinsically high SNR, we can collect a single 0.5 NEX imaging volume in 5 minutes at 0.4mm isotropic resolution. This offers both (1) imaging time-per-sequence that is tolerable for most subjects, and (2) an image SNR adequate for alignment (Supplementary Digital Content 1 and 2). Several phase cycles allows us to further improve SNR and reduce banding using a simple alignment and averaging procedure. Because typical clinical scanning can require sometimes 10 or more five-minute sequences, this paradigm does not fall out of the range of patient tolerance, though there may be limited time for other sequences within a scanning session.
To our knowledge, no other work in the field has explored 7.0T bSSFP for high-resolution brain imaging. We have demonstrated that this sequence allows superior depiction of the medial temporal lobe and cortical microstructure such as the line of Gennari, and it rivals typical iron-sensitive multi-echo GRE for deep brain iron-containing nuclei. Extensive prior efforts at high-field imaging have shown the line of Gennari, but most of these were not isotropic whole-brain imaging protocols that yielded contrast useful for multiple brain regions [21, 37]. The benefit of bSSFP likely stems from the coupling of ultra-high resolution with iron sensitivity. Of note, manipulation of the echo-train length and altering the modulation of flip angles could increasing the iron contrast for CUBE T2, albeit at the cost of blurring and reduced SNR. While high-resolution imaging of the human hippocampus has generally been achieved with anisotropic imaging [38–41], a recent study used isotropic imaging with a 0.6mm voxel size at 3.0T, though this study utilized six 16-minute individual acquisitions that would be difficult to translate clinically [42]. In contrast, our work confirms clinical feasibility with the inclusion of two patients in this study. The 0.4mm isotropic resolution surpasses all that has been performed to date in the literature. At our high resolution, the hippocampus shows impressive contrast because less partial volume averaging is occurring. This resolution and definition of the subthalamic nucleus could facilitate better intraoperative planning and be complementary to techniques that offer high contrast in the upper brainstem [43, 44]. If higher flip angle acquisitions were to be attempted, the SAR could be mitigated by pauses or other low-SAR sequences intermingled between phase cycles. This advance demonstrates that ultra-high field imaging can provide novel benefits for the fields of neuroscience and neuroradiology.
A limitation of bSSFP is that contrast near the cortex is limited, and gray-white distinction is poor. Future efforts could include white matter or CSF nulling to provide improved contrast, though this will be at the cost of SNR and secondarily image resolution. Pulsatility artifact does occur, particularly along the phase-encode direction (R/L) at the level of the circle of Willis, and this can obscure the base of the temporal lobe and hippocampal head. While cardiac gating is challenging at this short TR, CSF and/or blood nulling may remedy this artifact. Further TR shortening to reduce pulsatility at this resolution would be impossible given that we are already at maximum possible bandwidth and minimum TR and TE. Similarly, reducing the flip angle would decrease the T2 contrast and increase the T2* contrast, altering the image contrast. The image registration algorithm worked well for 6 volunteers and two patients, likely because the brain-CSF interface drove the registration, overcoming the obstacle of banding artifact. The need to repeat sequences obscured by motion artifact could prove limiting under some circumstances, but generally patients can refrain from moving for five minutes at a time for at least 30 minutes. Access to 7T scanners is still limited with approximately 50–60 worldwide. The rating portion of this study had a low kappa for the comparison of bSSFP with multi-echo GRE; nevertheless, the ratings clearly show bSSFP has superior contrast for the hippocampi, skull-base, and neocortical gray-white differentiation, while both have equivalent iron-sensitivity and B1 homogeneity. Another limitation of the global ratings portion of this study is that scan times were not equivalent in the global comparison, with bSSFP having four times longer scanning than T2-weighted FSE or CUBE T2, effectively doubling the expected SNR of the bSSFP in comparison. Nevertheless, the comparison of time-matched bSSFP with CUBE T2 still showed superiority of the bSSFP for 3-D hippocampal subfield delineation, likely secondary to the high SNR coupled with the high resolution. Part of the strength of bSSFP is that one complete high-resolution volume with adequate SNR for alignment can be acquired in only 5 minutes. Even if one or even two phase cycles are motion corrupted, that constitutes a small portion of the overall data that could be ignored, or quickly repeated as done in this study. Such short scan times could prove more challenging for the other sequences: the coronal T2-weighted FSE is anisotropic, so aligning repetitions is more difficult; the CUBE T2 and multi-echo GRE require more time to encode all of k-space, and single-echo GRE will have a lower intrinsic SNR because signal is not fully refocused at the end of each TR period. While single-echo or multi-echo GRE can provide superior iron sensitivity through susceptibility processing [45, 46], the resolution in this study surpasses current in vivo efforts at susceptibility mapping. Finally, this study did examine a small number of subjects using only two raters, so future studies and clinical experience will be needed to reinforce the clinical utility of bSSFP.
Our future work will take advantage of this extremely high resolution imaging of the medial temporal lobe to segment the microstructure of the hippocampus. This improved high-resolution sequence could also be applied to imaging of the normal brain as well as disease states such as Alzheimer’s disease and epilepsy. Additionally, the detailed depictions of deep-brain iron containing nuclei could be beneficial for both surgical targeting and quantitative studies of microstructure associated with Parkinson’s disease and other movement disorders.
Supplementary Material
Supplementary Digital Content 1: Single coronal slice from a single phase-cycle of bSSFP in a healthy volunteer.
Supplementary Digital Content 2: Coronal movie from a single phase-cycle of bSSFP in a healthy volunteer.
Supplementary Digital Content 3: Coronal movie from an eight-phase-cycle bSSFP in a healthy volunteer.
Supplementary Digital Content 4: Axial movie from an eight-phase-cycle bSSFP in a healthy volunteer.
Supplementary Digital Content 5: Sagittal movie from an eight-phase-cycle bSSFP in a healthy volunteer.
Acknowledgments
Source of Funding: Dr. Michael Zeineh has received funding from GE Healthcare. Dr. Brian Rutt has received funding from GE Healthcare and NIH P41 EB015891-19.
Footnotes
Conflicts of Interest
For the other authors listed, no conflicts are declared.
Contributor Information
Michael Zeineh, Assistant Professor, Dept. of Radiology, Stanford University
Mansi Parekh, Postdoctoral Fellow, Dept. of Radiology, Stanford University
Greg Zaharchuk, Associate Professor, Dept. of Radiology, Stanford University
Jason Su, Graduate Student, Stanford University
Jarrett Rosenberg, Biostatistician, Dept. of Radiology, Stanford University
Nancy Fischbein, Professor, Dept. of Radiology, Stanford University
Brian Rutt, Professor, Dept. of Radiology, Stanford University
References
- 1.Ugurbil K. The road to functional imaging and ultrahigh fields. Neuroimage. 2012;62(2):726–35. doi: 10.1016/j.neuroimage.2012.01.134. [DOI] [PMC free article] [PubMed] [Google Scholar]
- 2.van der Kolk AG, et al. Clinical applications of 7 T MRI in the brain. Eur J Radiol. 2013;82(5):708–18. doi: 10.1016/j.ejrad.2011.07.007. [DOI] [PubMed] [Google Scholar]
- 3.Abduljalil AM, et al. Acquisition of human multislice MR images at 8 Tesla. J Comput Assist Tomogr. 1999;23(3):335–40. doi: 10.1097/00004728-199905000-00001. [DOI] [PubMed] [Google Scholar]
- 4.Bourekas EC, et al. High resolution MRI of the deep gray nuclei at 8 Tesla. J Comput Assist Tomogr. 1999;23(6):867–74. doi: 10.1097/00004728-199911000-00009. [DOI] [PubMed] [Google Scholar]
- 5.Burgess RE, et al. High signal-to-noise FLASH imaging at 8 Tesla. Magn Reson Imaging. 1999;17(8):1099–103. doi: 10.1016/s0730-725x(99)00072-7. [DOI] [PubMed] [Google Scholar]
- 6.Robitaille PM, Abduljalil AM, Kangarlu A. Ultra high resolution imaging of the human head at 8 tesla: 2K x 2K for Y2K. J Comput Assist Tomogr. 2000;24(1):2–8. doi: 10.1097/00004728-200001000-00002. [DOI] [PubMed] [Google Scholar]
- 7.Christoforidis GA, et al. High resolution MRI of the deep brain vascular anatomy at 8 Tesla: susceptibility-based enhancement of the venous structures. J Comput Assist Tomogr. 1999;23(6):857–66. doi: 10.1097/00004728-199911000-00008. [DOI] [PubMed] [Google Scholar]
- 8.Li TQ, et al. Extensive heterogeneity in white matter intensity in high-resolution T2*-weighted MRI of the human brain at 7.0 T. Neuroimage. 2006;32(3):1032–40. doi: 10.1016/j.neuroimage.2006.05.053. [DOI] [PubMed] [Google Scholar]
- 9.Deistung A, et al. Toward in vivo histology: a comparison of quantitative susceptibility mapping (QSM) with magnitude-, phase-, and R2*-imaging at ultra-high magnetic field strength. Neuroimage. 2013;65:299–314. doi: 10.1016/j.neuroimage.2012.09.055. [DOI] [PubMed] [Google Scholar]
- 10.Lusebrink F, Wollrab A, Speck O. Cortical thickness determination of the human brain using high resolution 3T and 7T MRI data. Neuroimage. 2012;70C:122–131. doi: 10.1016/j.neuroimage.2012.12.016. [DOI] [PubMed] [Google Scholar]
- 11.Marques JP, et al. MP2RAGE, a self bias-field corrected sequence for improved segmentation and T1-mapping at high field. Neuroimage. 2010;49(2):1271–81. doi: 10.1016/j.neuroimage.2009.10.002. [DOI] [PubMed] [Google Scholar]
- 12.Visser F, et al. High-resolution magnetization-prepared 3D-FLAIR imaging at 7.0 Tesla. Magn Reson Med. 2010;64(1):194–202. doi: 10.1002/mrm.22397. [DOI] [PubMed] [Google Scholar]
- 13.Kerchner GA, et al. Hippocampal CA1 apical neuropil atrophy and memory performance in Alzheimer’s disease. Neuroimage. 2012;63(1):194–202. doi: 10.1016/j.neuroimage.2012.06.048. [DOI] [PMC free article] [PubMed] [Google Scholar]
- 14.Hoult DI, Phil D. Sensitivity and power deposition in a high-field imaging experiment. J Magn Reson Imaging. 2000;12(1):46–67. doi: 10.1002/1522-2586(200007)12:1<46::aid-jmri6>3.0.co;2-d. [DOI] [PubMed] [Google Scholar]
- 15.Ibrahim TS, et al. Effect of RF coil excitation on field inhomogeneity at ultra high fields: a field optimized TEM resonator. Magn Reson Imaging. 2001;19(10):1339–47. doi: 10.1016/s0730-725x(01)00404-0. [DOI] [PubMed] [Google Scholar]
- 16.Katscher U, et al. Transmit SENSE. Magn Reson Med. 2003;49(1):144–50. doi: 10.1002/mrm.10353. [DOI] [PubMed] [Google Scholar]
- 17.Zhu Y. Parallel excitation with an array of transmit coils. Magn Reson Med. 2004;51(4):775–84. doi: 10.1002/mrm.20011. [DOI] [PubMed] [Google Scholar]
- 18.Sheth S, Branstetter BFt, Escott EJ. Appearance of normal cranial nerves on steady-state free precession MR images. Radiographics. 2009;29(4):1045–55. doi: 10.1148/rg.294085743. [DOI] [PubMed] [Google Scholar]
- 19.Ronald JA, et al. Clinical field-strength MRI of amyloid plaques induced by low-level cholesterol feeding in rabbits. Brain. 2009;132(Pt 5):1346–54. doi: 10.1093/brain/awp031. [DOI] [PMC free article] [PubMed] [Google Scholar]
- 20.Scheffler K, Lehnhardt S. Principles and applications of balanced SSFP techniques. Eur Radiol. 2003;13(11):2409–18. doi: 10.1007/s00330-003-1957-x. [DOI] [PubMed] [Google Scholar]
- 21.Lee J, Fukunaga M, Duyn JH. Improving contrast to noise ratio of resonance frequency contrast images (phase images) using balanced steady-state free precession. Neuroimage. 2011;54(4):2779–88. doi: 10.1016/j.neuroimage.2010.10.071. [DOI] [PMC free article] [PubMed] [Google Scholar]
- 22.Bieri O, Scheffler K. On the origin of apparent low tissue signals in balanced SSFP. Magn Reson Med. 2006;56(5):1067–74. doi: 10.1002/mrm.21056. [DOI] [PubMed] [Google Scholar]
- 23.Elliott AM, et al. Nonlinear averaging reconstruction method for phase-cycle SSFP. Magn Reson Imaging. 2007;25(3):359–64. doi: 10.1016/j.mri.2006.09.013. [DOI] [PubMed] [Google Scholar]
- 24.Brau AC, et al. Comparison of reconstruction accuracy and efficiency among autocalibrating data-driven parallel imaging methods. Magn Reson Med. 2008;59(2):382–95. doi: 10.1002/mrm.21481. [DOI] [PMC free article] [PubMed] [Google Scholar]
- 25.Busse RF. Reduced RF power without blurring: correcting for modulation of refocusing flip angle in FSE sequences. Magn Reson Med. 2004;51(5):1031–7. doi: 10.1002/mrm.20056. [DOI] [PubMed] [Google Scholar]
- 26.Pruessmann KP, et al. SENSE: sensitivity encoding for fast MRI. Magn Reson Med. 1999;42(5):952–62. [PubMed] [Google Scholar]
- 27.Bangerter NK, et al. Analysis of multiple-acquisition SSFP. Magn Reson Med. 2004;51(5):1038–47. doi: 10.1002/mrm.20052. [DOI] [PubMed] [Google Scholar]
- 28.Jenkinson M, et al. Improved optimization for the robust and accurate linear registration and motion correction of brain images. Neuroimage. 2002;17(2):825–41. doi: 10.1016/s1053-8119(02)91132-8. [DOI] [PubMed] [Google Scholar]
- 29.Zeineh MM, et al. Ultra-high resolution diffusion tensor imaging of the microscopic pathways of the medial temporal lobe. Neuroimage. 2012;62(3):2065–82. doi: 10.1016/j.neuroimage.2012.05.065. [DOI] [PMC free article] [PubMed] [Google Scholar]
- 30.Yushkevich PA, et al. A high-resolution computational atlas of the human hippocampus from postmortem magnetic resonance imaging at 9.4 T. Neuroimage. 2009;44(2):385–98. doi: 10.1016/j.neuroimage.2008.08.04. [DOI] [PMC free article] [PubMed] [Google Scholar]
- 31.Lenglet C, et al. Comprehensive in vivo mapping of the human basal ganglia and thalamic connectome in individuals using 7T MRI. PLoS ONE. 2012;7(1):e29153. doi: 10.1371/journal.pone.0029153. [DOI] [PMC free article] [PubMed] [Google Scholar]
- 32.Naidich TP, Duvernoy HM. In: Duvernoy’s atlas of the human brain stem and cerebellum: high-field MRI: surface anatomy, internal structure, vascularization and 3D sectional anatomy. Wien, editor. New York: Springer; 2009. p. xi.p. 876. [Google Scholar]
- 33.Fatterpekar GM, et al. MR microscopy of normal human brain. Magn Reson Imaging Clin N Am. 2003;11(4):641–53. doi: 10.1016/s1064-9689(03)00071-0. [DOI] [PubMed] [Google Scholar]
- 34.Lusebrink F, Wollrab A, Speck O. Cortical thickness determination of the human brain using high resolution 3T and 7T MRI data. Neuroimage. 2013;70:122–31. doi: 10.1016/j.neuroimage.2012.12.016. [DOI] [PubMed] [Google Scholar]
- 35.Fukunaga M, et al. Layer-specific variation of iron content in cerebral cortex as a source of MRI contrast. Proc Natl Acad Sci U S A. 2010;107(8):3834–9. doi: 10.1073/pnas.0911177107. [DOI] [PMC free article] [PubMed] [Google Scholar]
- 36.Fushimi Y, et al. Liliequist membrane: three-dimensional constructive interference in steady state MR imaging. Radiology. 2003;229(2):360–5. doi: 10.1148/radiol.2292021507. discussion 365. [DOI] [PubMed] [Google Scholar]
- 37.Duyn JH, et al. High-field MRI of brain cortical substructure based on signal phase. Proc Natl Acad Sci U S A. 2007;104(28):11796–801. doi: 10.1073/pnas.0610821104. [DOI] [PMC free article] [PubMed] [Google Scholar]
- 38.Kerchner GA. Ultra-high field 7T MRI: a new tool for studying Alzheimer’s disease. Journal of Alzheimer’s Disease. 2011;26(Suppl 3):91–5. doi: 10.3233/JAD-2011-0023. [DOI] [PubMed] [Google Scholar]
- 39.Mueller SG, et al. Evidence for functional specialization of hippocampal subfields detected by MR subfield volumetry on high resolution images at 4 T. Neuroimage. 2011;56(3):851–7. doi: 10.1016/j.neuroimage.2011.03.028. [DOI] [PMC free article] [PubMed] [Google Scholar]
- 40.Burggren AC, et al. Reduced cortical thickness in hippocampal subregions among cognitively normal apolipoprotein E e4 carriers. Neuroimage. 2008;41(4):1177–83. doi: 10.1016/j.neuroimage.2008.03.039. [DOI] [PMC free article] [PubMed] [Google Scholar]
- 41.Zeineh MM, et al. Dynamics of the hippocampus during encoding and retrieval of face-name pairs. Science. 2003;299(5606):577–80. doi: 10.1126/science.1077775. [DOI] [PubMed] [Google Scholar]
- 42.Winterburn JL, et al. A novel in vivo atlas of human hippocampal subfields using high-resolution 3 T magnetic resonance imaging. Neuroimage. 2013;74:254–65. doi: 10.1016/j.neuroimage.2013.02.003. [DOI] [PubMed] [Google Scholar]
- 43.Sudhyadhom A, et al. A high resolution and high contrast MRI for differentiation of subcortical structures for DBS targeting: the Fast Gray Matter Acquisition T1 Inversion Recovery (FGATIR) Neuroimage. 2009;47(Suppl 2):T44–52. doi: 10.1016/j.neuroimage.2009.04.018. [DOI] [PubMed] [Google Scholar]
- 44.Tourdias T, et al. Visualization of intra-thalamic nuclei with optimized white-matter-nulled MPRAGE at 7 T. Neuroimage. doi: 10.1016/j.neuroimage.2013.08.069. [DOI] [PMC free article] [PubMed] [Google Scholar]
- 45.Liu T, et al. Morphology enabled dipole inversion (MEDI) from a single-angle acquisition: comparison with COSMOS in human brain imaging. Magn Reson Med. 2011;66(3):777–83. doi: 10.1002/mrm.22816. [DOI] [PubMed] [Google Scholar]
- 46.Schafer A, et al. Direct visualization of the subthalamic nucleus and its iron distribution using high-resolution susceptibility mapping. Hum Brain Mapp. 2012;33(12):2831–42. doi: 10.1002/hbm.21404. [DOI] [PMC free article] [PubMed] [Google Scholar]
- 47.Kerchner GA, et al. Hippocampal CA1 apical neuropil atrophy in mild Alzheimer disease visualized with 7-T MRI. Neurology. 2010;75(15):1381–7. doi: 10.1212/WNL.0b013e3181f736a1. [DOI] [PMC free article] [PubMed] [Google Scholar]
- 48.Insausti R, Amaral DG. The Human Nervous System, Second Edition. London: Academic Press; 2004. [Google Scholar]
- 49.Duvernoy HM. The Human Hippocampus: Functional Anatomy, Vascularization and Serial Sections with MRI. Springer; 2005. [Google Scholar]
Associated Data
This section collects any data citations, data availability statements, or supplementary materials included in this article.
Supplementary Materials
Supplementary Digital Content 1: Single coronal slice from a single phase-cycle of bSSFP in a healthy volunteer.
Supplementary Digital Content 2: Coronal movie from a single phase-cycle of bSSFP in a healthy volunteer.
Supplementary Digital Content 3: Coronal movie from an eight-phase-cycle bSSFP in a healthy volunteer.
Supplementary Digital Content 4: Axial movie from an eight-phase-cycle bSSFP in a healthy volunteer.
Supplementary Digital Content 5: Sagittal movie from an eight-phase-cycle bSSFP in a healthy volunteer.