

SUMMARY
Protein kinase D (PKD) is acutely activated by two tightly coupled events: binding to the second messenger diacylglycerol (DAG) followed by novel protein kinase C (nPKC) phosphorylation at the activation loop and autophosphorylation at the C-terminus. Thus, phosphorylation serves as a widely accepted measure of PKD activity. Here we show that treatment of cells with PKD inhibitors paradoxically promotes agonist-dependent activation loop phosphorylation, thus uncoupling phosphorylation from activation. This inhibitor-induced enhancement of phosphorylation differs mechanistically from that previously reported for PKC and Akt for which active site inhibitors stabilize a phosphatase-resistant conformation. Rather, a conformational reporter reveals that inhibitor binding induces a conformational change resulting in relocalization of PKD to basal DAG pools where it is more readily phosphorylated by nPKCs. These findings illustrate the diverse conformational effects that small molecules exert on their target protein, underscoring the importance of using caution when interpreting kinase activity from phosphorylation state.
INTRODUCTION
Protein kinase D (PKD) transduces numerous signals downstream of diacylglycerol (DAG) production, playing a role in diverse cellular functions such as regulation of immune cell signaling, Golgi sorting, cell polarity, proliferation, survival, and migration (Rozengurt, 2011). A vast number of distinct stimuli can lead to an increase in DAG by binding to cell surface receptors and stimulating phospholipase C (PLC) activity. PLC catalyzes the hydrolysis of the membrane lipid phosphatidylinositol 4,5-biphosphate generating the two second messengers inositol 1,4,5-trisphosphate and DAG. C1 domains are protein modules that bind to DAG, as well as to their functional analogs, phorbol esters. Thus, downstream of activating stimuli, increased levels of DAG recruit C1 domain-containing proteins to cellular membranes; such proteins include PKDs as well as their activating kinase, the novel protein kinase Cs (nPKCs) (Toker, 2005).
The PKD family consists of three isozymes: PKD1, PKD2, and PKD3. Although PKD was originally classified as a PKC family member, and called PKCμ, PKD actually belongs to the calcium-calmodulin kinase super family, a family distinct from the AGC kinase group to which PKCs belong (Rozengurt et al, 2005). PKDs consist of an N-terminal regulatory domain comprising two C1 domains followed by a pleckstrin homology (PH) domain. The C1 domain serves as a DAG sensor and recruits PKD to membranes. Additionally, this module and the PH domain both autoinhibit the C-terminal kinase domain: disruption of either the C1 or PH domains results in a constitutively active kinase (Iglesias and Rozengurt, 1998, 1999). Autoinhibition is relieved by DAG-dependent recruitment to membranes, an event that poises PKD near its upstream kinases, the nPKCs. The nPKCs are similarly recruited to DAG-containing membranes via their C1 domains; however, unlike PKD that becomes activated once phosphorylated, PKCs are constitutively phosphorylated and are active when bound to DAG. Activated nPKCs phosphorylate PKD within its activation loop at two serines (e.g. S744 and S748 in mouse PKD1) and PKD subsequently autophosphorylates at a site in its C-terminus (e.g. S916 in mouse PKD1). These phosphorylations are activating and are commonly used as a measure of PKD activity (Rozengurt et al, 2005).
PKC and Akt are also critically regulated by phosphorylation. For PKC, phosphorylation is constitutive and part of its priming process, whereas for Akt, phosphorylation is agonist-evoked. Recent studies revealed that both enzymes display a paradoxical increase in phosphorylation following treatment of cells with active site inhibitors (Cameron et al, 2009; Okuzumi et al, 2009). In the case of PKC, which is constitutively phosphorylated, this phenomenon is observed using kinase-inactive constructs that have highly reduced autophosphorylation capacity and are thus not normally phosphorylated in cells. For Akt, this is observed for wild-type enzyme. We have previously shown that, in the case of PKC, occupancy of the active site by inhibitors (or peptides or autoinhibitory pseudosubstrate (Dutil and Newton, 2000)) locks PKC in a phosphatase-resistant conformation (Gould et al., 2011). The same mechanism was described for Akt: active site occupancy locks the kinase in a phosphatase-resistant conformation (Chan et al., 2011; Lin et al., 2012). Whether the ability of inhibitors to enhance kinase phosphorylation is a general phenomenon remains to be established.
Here we show that PKD also undergoes a paradoxical increase in activation loop phosphorylation following treatment of cells with PKD inhibitors. Specifically, these inhibitors abolish down-stream signaling by PKD yet promote the steady-state phosphorylation at the activation loop. This inhibitor-dependent increase in phosphorylation occurs by a novel mechanism distinct from that for Akt and PKC. Specifically, using a fluorescence resonance energy transfer (FRET)-based conformational reporter, we show that inhibitor binding promotes a conformational change in PKD that unmasks its C1 domain for enhanced membrane binding. This allows inhibitor-bound PKD to bind basal levels of DAG in DAG-enriched membranes such as Golgi, a location also enriched in the upstream kinase, the nPKCs. This colocalization of PKD and nPKC promotes enhanced phosphorylation of PKD by nPKC following agonist stimulation, thus accounting for the paradoxical increase in phosphorylation despite inhibition of PKD activity.
RESULTS
Active site inhibitor binding increases PKD activation loop phosphorylation
Time courses of PKD activation downstream of G protein-coupled receptors (GPCRs) unexpectedly revealed increased phosphorylation at the activation loop site following 10-minute pre-treatment with the PKD active site inhibitor, Gö 6976. COS-7 cells stimulated with uridine triphosphate (UTP) to activate endogenous Gq-coupled GPCRs resulted in increasing PKD activation, as measured via activation loop (744/748 in mouse PKD1) and C-terminal (916 in mouse PKD1) phosphorylation (Figure 1). We have previously shown that pre-treatment of COS-7 cells with 500 nM Gö 6976 for 10 minutes effectively abolishes PKD signaling as monitored using a PKD activity reporter, DKAR (Kunkel et al., 2007). Thus, despite the complete inhibition of PKD under these conditions, activation loop phosphorylation was increased compared to untreated cells at each time point (Figure 1). In order to determine whether this effect was specific to Gö 6976 acting on PKD, we utilized another competitive PKD inhibitor, CRT0066101 (Christopher Ireson, personal communication), which is more specific to PKD than Gö 6976 (Harikumar et al., 2010). CRT0066101 pre-treatment similarly resulted in increased activation loop phosphorylation on PKD following UTP stimulation (Figure S1). We note that C-terminal phosphorylation, an event that is catalyzed by autophosphorylation, was not abolished in the presence of the kinase inhibitors, however, the rate of autophosphorylation was reduced (Figure 1 and S1). In contrast, pre-treatment of the cells with 250 nM Gö 6983, to inhibit activity of the upstream kinases that catalyze PKD activation loop phosphorylation (nPKCs), abolished UTP-induced phosphorylation at the activation loop site and significantly diminished C-terminal phosphorylation (Figure 1).
Figure 1.

Time course of PKD activation in the presence of kinase inhibitors. (A) Western blots depicting activation loop phosphorylation (p744/748) and C-terminal autophosphorylation (p916) of PKD endogenous to COS-7 cells induced by 100 μM UTP stimulation over 10 minutes in the absence (first three lanes) or presence of 10 minute pre-treatment with the PKD or PKC kinase inhibitors Gö 6976 (500 nM, middle lanes) or Gö 6983 (250 nM, right lanes), respectively. A representative blot is depicted. (B) Graphs depicting the average intensities of the phospho-bands from experiments as in (A). Data were normalized to the 0-minute time point for each time course and then averaged. Errors represent SEM. n=6 for untreated (blue diamond) and Gö 6976-treated (green square) plots and n=4 for the Gö 6983-treated (red triangle) plots. * represents p<0.05 between the untreated and Gö 6976-treated cells as determined by Student’s t-Test. See also Figure S1.
Non-competitive inhibitor binding also increases PKD activation loop phosphorylation
Previous work on Akt and PKC has revealed that binding to active site inhibitors leads to increased phosphorylation of the kinase, however, binding to non-competitive inhibitors does not (Gould et al., 2011; Okuzumi et al., 2009). To assess whether this was also the case for PKD, we utilized the ATP-noncompetitive PKD inhibitor, CID 755673 (Sharlow et al., 2008). First, to validate that CID 755673 could effectively inhibit PKD in COS-7 cells, we tested its effect on inhibition of signaling by both endogenous PKD as well as overexpressed PKD. Figure 2A shows that the response from the PKD activity reporter DKAR (Kunkel et al., 2007) induced by the DAG analog, phorbol 12,13-dibutyrate (PDBu), was readily reversed following addition of 50 μM CID 755673. Importantly, the DKAR response was enhanced in the presence of overexpressed PKD1, and this increased response was fully reversed following CID 755673 addition.
Figure 2.

Effect of CID 755673 on PKD. (A) Graph depicting changes in the FRET ratio from COS-7 cells expressing the kinase activity reporter, DKAR, following activation of endogenous PKD (light blue diamonds) or overexpressed PKD (dark blue diamonds) via 200 nM PDBu treatment and subsequent PKD inhibition with the non-competitive PKD inhibitor, CID 755673 (50 μM). The FRET ratio was normalized to the 0-minute time point. Shown is a representative experiment. (B) Western blots depicting activation loop phosphorylation (p744/748) and C-terminal autophosphorylation (p916) of PKD endogenous to COS-7 cells induced by 100 μM UTP stimulation over 10 minutes in the absence (first three lanes) or presence of 10 minute pre-treatment with the PKD or PKC kinase inhibitors CID 755673 (50 μM, middle lanes) and Gö 6983 (250 nM, right lanes), respectively. A representative blot is depicted. All experiments were performed at room temperature.
Next, we examined the effect of 50 μM CID 755673 on UTP-dependent phosphorylation. Surprisingly, we observed greatly enhanced phosphorylation at the activation loop site as well as considerably reduced autophosphorylation at the C-terminal site (Figure 2B). The UTP-stimulated increase in activation loop phosphorylation was on average 20-fold higher in CID-pretreated cells than in untreated cells (22±7 compared to 4.3±0.6, errors representing SEM). Thus, in contrast to the conditions for PKC, the phosphorylation state of PKD at the activation loop is impacted by binding to both ATP competitive and noncompetitive inhibitors. Furthermore, autophosphorylation at the C-terminal site was more effectively reduced in the presence of CID 755673 compared to Gö 6976 (compare Figure 2B to Figure 1A, p916).
Transient PKD phosphorylation at 37°C
The previous experiments were conducted at room temperature to keep in parallel with all of our kinase imaging studies; therefore, we next set out to examine the time course of PKD activation at a more physiologically-relevant temperature. Figure 3 reveals the transient nature of PKD activation as monitored via activation loop (p744/748) and C-terminal autophosphorylation (p916) at 37°C. Phosphorylation at the activation loop and C-terminal autophosphorylation site peaked at 5 minutes. After 30 minutes of UTP treatment, activation loop phosphorylation returned to basal levels, and phosphorylation at the C-terminal site, while still elevated, declined. In the presence of Gö 6976, activation loop phosphorylation was elevated over the UTP time course, but displayed the same transient phosphorylation as observed from cells that were not pre-treated with inhibitor; thus while the effect of increased phosphorylation with inhibitor was present, phosphorylation did eventually decay. However, a 10-minute pre-treatment with CID 755673 resulted in a robust increase in activation loop phosphorylation that remained elevated over the 30-minute experiment. In fact, increased phosphorylation at this site was still present following 60 minutes of UTP treatment (data not shown).
Figure 3.

Time course of PKD activation at 37°C in the presence of PKD inhibitors. Western blots depicting activation loop phosphorylation (p744/748) and C-terminal autophosphorylation (p916) of PKD induced by 100 μM UTP stimulation over 30 minutes in the absence (first three lanes) or presence of 10 minute pre-treatment with the PKD inhibitors Gö 6976 (500 nM, middle lanes), or CID 755673 (50 μM, right lanes). A representative blot is depicted.
Increased phosphorylation in the presence of inhibitor is not an intrinsic property of PKD
Previous studies on Akt and PKC have demonstrated that active site occupancy induces a change in conformation of the kinase that is now resistant to dephosphorylation by phosphatases (Chan et al, 2011; Gould et al, 2011; Lin et al, 2012; Srivastava et al, 2002). We therefore tested whether the increased activation loop phosphorylation observed from inhibitor-bound PKD resulted from it adopting a phosphatase-resistant conformation. PKD that had been fully phosphorylated following PDBu treatment was immunoprecipitated and incubated with the PP1 phosphatase in the absence or presence of PKD inhibitors. Figure 4A shows time-dependent PP1 dephosphorylation of the activation loop and C-terminal site of immunoprecipitated PKD2. Pre-incubation of the immunoprecipitated PKD2 with CID 755673 for 10 minutes followed by PP1 addition modestly altered the rate of dephosphorylation compared to PKD2 without inhibitor pre-treatment (t½=16.5 minutes in the absence of inhibitor and t½=10 minutes in the presence of CID), a difference too small to account for the approximately 20-fold increase in phosphorylation observed in cells (Figure 4A). Furthermore, addition of the active site inhibitor, Gö 6976, at concentrations 12-fold over what was used in the COS-7 time courses above (i.e. 6 μM inhibitor), did not detectably slow the rate of dephosphorylation by PP1 (t½=16.5 minutes in the absence of inhibitor and t½=14 minutes in the presence of 6 μM Gö 6976; data not shown). Thus, the mechanism by which inhibitors result in increased phosphorylation of PKD is not by inducing a phosphatase-resistant species and thus is distinct from the mechanism for Akt and PKC.
Figure 4.
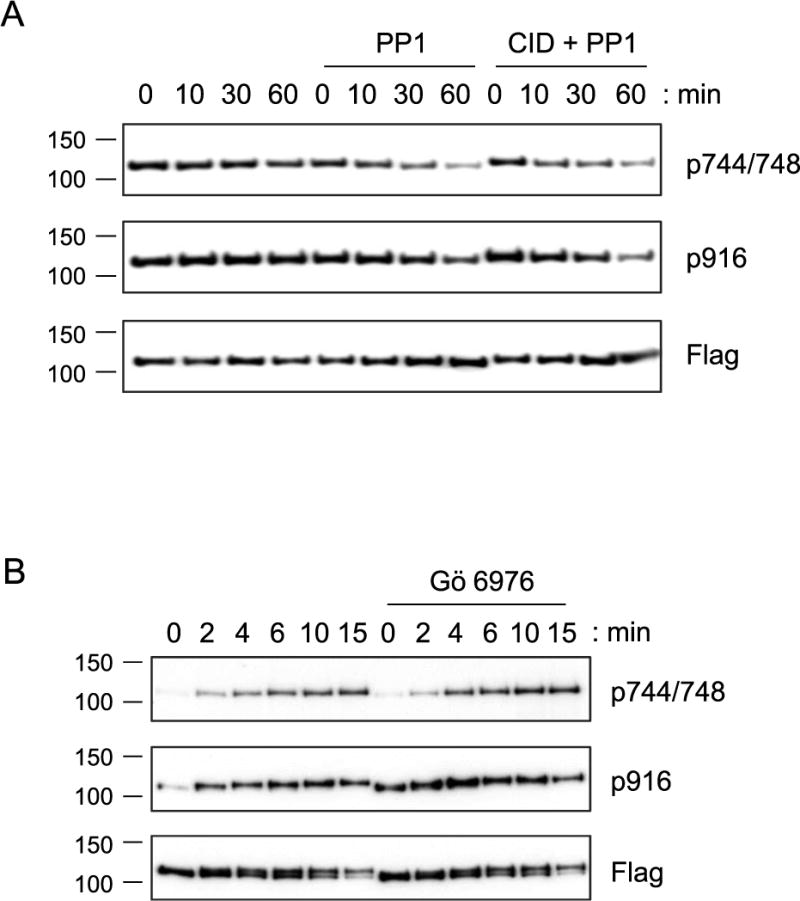
In vitro analysis of PKD phosphorylation. (A) Western blots of PKD2 phosphorylation at the activation loop site (p744/748) and C-terminal autophosphorylation site (p916) of immunoprecipitated, fully phosphorylated Flag-PKD2 in the absence (left lanes) and presence of 25 U/ml PP1 without (middle lanes) and with (right lanes) 50 μM CID 755673. (B) Western blots of PKD2 activation loop phosphorylation (p744/748) and PKD2 C-terminal phosphorylation (p916) following incubation of immunoprecipitated Flag-PKD2 with purified PKCδ (5 ng of 1280 U/mg stock) in the absence (left lanes) and presence (right lanes) of the PKD inhibitor, Gö 6976 (6 μM).
Since inhibitor binding to PKD did not induce a conformation that was resistant to phosphatase activity, we next asked whether the inhibitor-bound enzyme was in a conformation making it more amenable to phosphorylation by one of its upstream kinases, PKCδ. Incubation of immunoprecipitated PKD2 with pure PKCδ resulted in a time-dependent increase in phosphorylation at the PKC site (p744/748) as well as at the autophosphorylation site (p916) (Figure 4B). Pre-incubation of Gö 6976 for 10 minutes prior to incubation with PKCδ, did not increase the rate of phosphorylation; in the in vitro system, CID 755673 inhibited PKCδ, so the role of this ATP-noncompetitive PKD inhibitor could not be assessed in this assay (data not shown). Taken together, there was little to no effect on inhibitor binding on the rate of phosphorylation or dephosphorylation of PKD by PKCδ or PP1, respectively; the increased activation loop phosphorylation observed in the presence of inhibitor is not an intrinsic property of inhibitor-bound PKD.
Binding to inhibitors unmasks the DAG sensor of PKD
Because the effect of inhibitors on the phosphorylation state of PKD could not be recapitulated in vitro with purified proteins, we monitored PKD in cells to determine if inhibitor binding altered the conformation or localization of PKD. For these experiments, we expressed YFP-tagged PKD2 in COS-7 cells and monitored its subcellular localization in real-time following addition of CID 755673. Within minutes of CID 755673 addition, YFP-PKD2 relocalized to a subcellular region characteristic of Golgi membranes (Figure 5). To confirm that the enzyme was indeed relocalizing to Golgi membranes, we utilized a bi-partite FRET assay in which the FRET donor CFP is tethered to Golgi membranes (Gallegos et al., 2006) and the FRET acceptor YFP is fused onto PKD2 (Kunkel et al., 2009)(Figure 5A). Indeed, following addition of CID 755673, YFP-PKD2 co-localized to the Golgi-targeted CFP signal, and this co-localization was confirmed by an increase in FRET between the two fluorophores (Figure 5B); a similar redistribution, albeit less robust, was observed with PKD1 (data now shown), thus all subsequent experiments were performed with PKD2. Importantly, the morphology of the Golgi was unaffected following treatment with CID 755673 as illustrated by the Golgi-CFP images (Figure 5B, bottom panels). As PKD contains C1 domains and is activated by binding to membrane-embedded DAG, we examined whether DAG levels at the Golgi were involved in enzyme movement to this organelle. Basal levels of DAG at the Golgi are maintained via phosphatidic acid phosphatase (PAP) which converts phosphatidic acid (PA) to DAG [Figure 5A; (Baron and Malhotra, 2002)]. To ascertain whether Golgi DAG played a role in relocalization of PKD to Golgi, we treated cells first with the PAP inhibitor propranolol followed by the addition of CID 755673. As shown in Figure 5C, depletion of Golgi DAG prevented movement of PKD to Golgi membranes. Interestingly, in select cells (e.g. the two marked with an asterisk in Figure 5C), we observed localization of PKD to plasma membrane after CID 755673 addition in Golgi DAG-depleted cells suggesting that plasma membrane DAG was elevated in those select cells. To exclude the possibility that CID 755673 addition resulted in an increase in cellular DAG levels and this accounted for PKD relocalization to membranes, we examined the effect of CID on a distinct, Golgi-localized, DAG-dependent kinase, PKCδ. In COS-7 cells, we co-monitored YFP-PKD2 and mCherry-PKCδ movement in the same cell following CID addition and determined that the effect of inhibitors on PKD movement is unique to PKD: PKCδ localization did not change with CID addition, whereas PKD movement to Golgi was robust (Figure S2A). By Western analysis, CID 755673 treatment resulted in a much more robust increase in activation loop phosphorylation than Gö 6976 or CRT0066101 (compare Figure 1A and S1 with 2B), therefore it was not surprising that Gö 6976 and CRT0066101 were less effective than CID in causing movement of PKD to the Golgi (Figure S2B). In the case of Gö 6976, PKD relocalization was more readily observed at later time points or with excess Gö 6976 (6 μM compared to 500 nM)(Figure S2B). In summary, Gö 6976, CRT0066101 and CID 755673 binding to PKD induced movement of PKD to Golgi, and at this location, phosphorylation at its activation loop site is enhanced by activated nPKCs.
Figure 5.

PKD movement to Golgi-localized DAG. (A) Schematic of the FRET assay to monitor PKD movement to the Golgi. The FRET donor CFP is tethered to Golgi membranes and the FRET acceptor YFP is fused to PKD. (B) Fluorescent images of YFP-PKD2 (top) and Golgi-CFP (bottom) expressed in COS-7 cells before (pre CID) and after (post CID) treatment with CID 755673 (50 μM). Plot depicting changes in the FRET ratio over time between Golgi-CFP and YFP-PKD2 from the experiment shown on the left. The images on the left are from the time points marked by a caret in the plot. Shown is a representative experiment (n=7). (C) Fluorescent images of YFP-PKD2 (top) and Golgi-CFP (bottom) expressed in COS-7 cells before (pre CID) and after (post CID) treatment with 50 μM CID 755673 in the presence of the phosphatidic acid phosphatase (PAP) inhibitor propranolol (100 μM). Plot depicting changes in the FRET ratio over time between Golgi-CFP and YFP-PKD2 from the experiment shown on the left. The images on the left are from the time points marked by a caret in the plot. Shown is a representative experiment (n=4). The cells marked with * reveal localization to plasma membrane. See also Figure S2.
PKD changes conformation upon inhibitor binding
Inhibitor binding caused relocalization of PKD to DAG-containing membranes, thus we reasoned that it induced a change in conformation that unmasked its DAG-sensing C1 domains. To test this, we utilized a FRET-based assay that monitors intramolecular conformational changes of PKD2. To this end, we generated a CFP-PKD2-YFP fusion protein that comprises the FRET pair, CFP and YFP, flanking PKD2 (see Figure 6A). This was constructed similarly to the previously described fusion proteins, Kinameleon for PKCβII (Antal et al, 2014), CY-PKDδ for PKCδ (Braun et al, 2005), and GFP-Akt-YFP for Akt (Calleja et al, 2003) which have been successfully used to monitor changes in kinase conformation.
Figure 6.

Inhibitor binding to PKD induces a conformational change. (A) Schematic showing the CFP-PKD2-YFP fusion protein. The FRET pair CFP and YFP are fused to the N- and C-termini of PKD2, respectively. Conformational changes are measured by changes in FRET. (B) Plot of the whole-cell FRET ratio changes from CFP-PKD2-YFP and CFP-PKCβII-YFP following addition of 50 μM CID 755673. Data from multiple cells from 5 independent experiments were first normalized and then averaged; errors are SEM. n=28 for CFP-PKD2-YFP and n=18 for CFP-PKCβII-YFP. (C) Plot of the FRET ratio changes from CFP-PKD2-YFP following addition of 50 μM CID 755673 in the presence of propranolol. Data from multiple cells from 5 independent experiments were first normalized and then averaged; errors are SEM (n=35). See also Figure S3.
First, we expressed CFP-PKD2-YFP in COS-7 cells and monitored changes in the FRET ratio (FRET/CFP) following addition of 50 μM CID 755673. As shown in Figure 6B, an increase in the FRET ratio was observed immediately following CID 755673 addition. A change in the FRET ratio indicates a change in the orientation and/or distance between the FRET pair thereby reflecting a change in the conformation of PKD2. To control for off-target effects that CID 755673 addition may exert on the FRET assay, we expressed the PKCβII conformational reporter CFP-PKCβII-YFP (Kinameleon) in COS-7 cells and monitored the FRET ratio following treatment with CID. As shown in Figure 6B, CID 755673 had no effect on the FRET ratio from CFP-PKCβII-YFP, indicating that its effect on CFP-PKD2-YFP was specific to PKD2. As PKD2 relocalizes to Golgi upon binding to inhibitors (see Figure 5B), a portion of the FRET ratio increase (specifically at Golgi membranes) is derived from an increase in intermolecular FRET between CFP-PKD2-YFP proteins that co-localized on the membrane. Indeed, plotting of just the FRET ratio changes from the Golgi region showed a larger change in the FRET ratio than from regions selected to be absent of Golgi (data not shown). In order to remove the contribution of CID-induced co-localization of CFP-PKD2-YFP on the FRET changes and thereby only monitor FRET ratio changes resulting from intramolecular FRET, we imaged COS-7 cells expressing CFP-PKD2-YFP in the presence of propranolol, which depletes Golgi DAG. This treatment effectively prevented Golgi-relocalization of PKD2 upon inhibitor binding (see Figure 5C). Figure 6C shows that FRET from CFP-PKD2-YFP increased upon inhibitor treatment in these cells where there was no re-localization of PKD2 to Golgi membranes, consistent with an intramolecular change in FRET.
DISCUSSION
Here we show that PKD inhibitors that robustly inhibit kinase activity exert additional effects on the enzyme: they induce relocalization of the kinase to DAG-containing membranes, thus facilitating substrate phosphorylation by nPKCs. Based on our studies, we present a model (Figure 7) depicting how inhibitors act on PKD to result in increased phosphorylation at its activation loop site. Under basal conditions, PKD resides in the cytosol in an autoinhibited state. In this state, the PH and C1 domains interact with the catalytic core thereby preventing the C1 domains from associating with basal levels of DAG, while also preventing PKD phosphorylation and activation by its upstream kinases. Binding of inhibitors to PKD alters the conformation between the regulatory domains and kinase domain such that the C1 domain is now available to bind DAG; this is evident based on intramolecular conformational changes detected by the FRET-based PKD2 (CFP-PKD2-YFP) reporter and the movement of PKD to Golgi membranes, where basal DAG is relatively high (Figure 5). Once its regulatory domains are engaged at membranes, PKD has a readily accessible activation loop site. This species of PKD is still unphosphorylated, but subsequent to stimuli that activate the upstream nPKCs (e.g. UTP stimulation of purinergic receptors in COS-7 cells), PKD phosphorylation occurs at its activation loop site. Importantly, this phosphorylation by nPKCs is now greatly enhanced compared to levels of phosphorylation on the untreated, cytosolic form (p744/748 in Figure 1A, 2B and S1). Interestingly, despite the fact that PKD is in a DAG-binding conformation, the phosphorylation of its activation loop site by nPKCs is still stimulus-dependent thereby reflecting tight regulation of nPKC activity. Note that while the activated GPCRs reside at the plasma membrane, we have previously shown that the increase in Ca2+ downstream of GPCR signaling results in an increase in Golgi DAG, thus PKCδ is locally activated at Golgi (Kunkel and Newton, 2010).
Figure 7.

Proposed mechanism for increased activation loop phosphorylation of PKD in the presence of inhibitors. Under basal conditions, PKD resides in the cytosol in an unphosphorylated state (i) and is autoinhibited by its regulatory domain. Upon binding to inhibitor, PKD conformation is altered (ii) such that the regulatory domain is now available to interact with basal DAG within the cell. In this open conformation, the C1 domain of PKD binds to the basal DAG at Golgi membranes (iii). The targeted and open conformation is more readily phosphorylated (iv) downstream of signals that activate its upstream kinases, nPKCs, resulting in an increase in phosphorylation at the nPKC site (activation loop site, yellow circle). While the activity of PKD is inhibited toward substrates in the cell when bound to inhibitor, the enzyme is still able to autophosphorylate, albeit at a reduced rate, at the C-terminal site (smaller red circle). Thus, substrates scaffolded to a kinase, or tethered as in the case of the tail of PKD, will still accumulate phosphate as a result of their close proximity to their active site.
The effect of increased activation loop phosphorylation in the presence of PKD inhibitors was abundantly evident as our initial studies were done at room temperature where the effect is exaggerated; however we have shown that this finding remains present at 37°C, albeit more subtle (Figure 3). Importantly though, this initial observation led to our studies on binding of the noncompetitive inhibitor CID 755673, which so dramatically impacts PKD conformation that it is pronounced and prolonged both at room temperature and 37°C (Figure 2B and Figure 3).
Our finding that inhibitor binding results in PKD membrane localization was unexpected (Figure 5), but the induction of cellular translocation of a kinase upon inhibitor binding is not unprecedented. Okuzumi and colleagues showed membrane localization of Akt in the presence of active site inhibitors. In addition, similar to our observation that PKD relocalization is DAG-dependent, the authors found that depletion of basal PIP3 levels, the activating lipid of Akt, prevented this relocalization (Okuzumi et al., 2009).
In the course of these studies, we analyzed the phosphorylation state of PKD in the presence and absence of PKD inhibitors. As described above, phosphorylation at the C-terminal S916 occurs via PKD autophosphorylation; however, PKD inhibitors were not able to fully prevent autophosphorylation (p916 in Figure 1A, 2B and S1), even though phosphorylation toward cellular substrates was inhibited [Figure 2A and (Kunkel et al., 2007)]. It is important to consider that a negative result (S916 phosphorylation despite PKD inhibitor treatment) does not discredit the well-accepted model of PKD activation via autophosphorylation at this site; rather, this observation highlights the fact that kinases that are in close proximity to their substrates are still able to phosphorylate them. The residual kinase activity present within the inhibitor-bound enzyme is sufficient to induce phosphorylation of nearby substrates, such as those located at the same protein complex, or as in this case, on the same polypeptide. One clear example of this has been demonstrated for phosphoinositide-dependent kinase (PDK-1), the upstream kinase for both PKC and Akt. PDK-1 and unphosphorylated PKC are tightly associated (Gao et al., 2001), whereas PDK-1 and Akt do not interact. PKC is constitutively phosphorylated at its activation loop by the interacting PDK-1, however, Akt phosphorylation by PDK-1 only occurs following co-localization of the two enzymes at membranes after signal-induced phosphoinositol 3,4,5-trisphosphate (PIP3) production. Thus, addition of a PDK-1 inhibitor does not hinder PKC phosphorylation and processing, however, phosphorylation of Akt is completely blocked (Hoshi et al., 2010). Additionally, it was shown that active site PKC inhibitors were unable to block modulation by phosphorylation of the channels that constitute M current: this is a result of the scaffold protein AKAP79/150 anchoring the two proteins in close proximity (Hoshi et al., 2010). Thus, autophosphorylation reactions and reactions of substrates scaffolded to kinases can be refractory to inhibition compared to unassociated substrates. For PKD, the level of residual activity present in the inhibitor-bound kinase varies depending on the specific inhibitor used (compare S916 autophosphorylation in the presence of Gö 6976 with the much weaker autophosphorylation with CRT0066101 or CID 755673 bound; Figures 1A with 2B and S1). The different inhibitors induce distinct conformations which are more or less able to autophosphorylate at the C-terminal S916 site.
Kinase inhibitors are valuable tools used in basic research as well as therapeutics. Our studies highlight the complicated impact inhibitors have on their target proteins. We show here that for PKD, inhibitors induce a conformation that enables binding to basal levels of the activating lipid in cells; this phenomenon was also shown for Akt (Okuzumi et al., 2009). This pretargeting poises the kinase in a favorable conformation for upstream kinase signaling, resulting in increased phosphorylation, the hallmark indicator for kinase activation of both of these kinases. Thus, one must use caution when interpreting the phosphorylation state of kinases in the presence of small molecule inhibitors.
PKD has been shown to play a role in cell proliferation, cell survival, cell migration, and angiogenesis. Although PKD inhibitors are not currently being used as therapeutic agents, their role in these processes has validated the kinase as a potential target in the treatment of cancer. Our finding that PKD inhibitors, both competitive and noncompetitive, induce a conformational change, membrane targeting and hyperphosphorylation of the kinase, therefore, may have therapeutic implications. Specifically, after removal of the inhibitors, is the kinase left in its active state promoting cancer growth? Indeed, for Akt, washout of the active site inhibitor left the enzyme in a phosphorylated and active state in vitro (Okuzumi et al., 2009). Thus in both cases, and likely others, kinase inhibitors may exhibit effects on the enzymes and consequences on cellular signaling that will confound the outcome.
SIGNIFICANCE
Following an increase in diacylglycerol (DAG) levels, protein kinase D (PKD) is activated – a state that is most often assessed using phospho-specific antibodies against the activating phosphorylation sites. Here we note that binding to both ATP competitive and noncompetitive inhibitors results in increased PKD phosphorylation at its activation loop site; thus, while the enzyme activity is blocked by these molecules, the readout using phospho-specific antibodies would suggest that PKD is active. We show that inhibitor binding to PKD induces a conformation of the enzyme in which the DAG-binding regulatory domains (the C1 domains) direct PKD to the basal levels of DAG present at Golgi membranes. Once preassociated with Golgi membranes in this open conformation, PKD is more readily phosphorylated downstream of signals which activate its upstream kinases; this results in increased activation loop phosphorylation. Thus, small molecule binding can exert additional impacts on target proteins and interpretations of kinase activity based on phosphorylation status in the context of small molecule treatment need be assessed with caution. Indeed, a similar increase in phospho-Akt occurs in the presence of active site inhibitors, however the mechanism for the effect is distinct (inhibitor-bound Akt exists in a phosphatase-resistant conformation) from that described for PKD here. Second, we show that PKD autophosphorylation at its C-terminal site is not fully blocked by inhibitors, despite effective inhibition toward PKD substrates. This observation does not contradict the role of PKD autophosphorylation at this site, rather, it reflects that enzymes that are tightly associated with their substrates (or tethered to their substrate, as is the case with PKD and its C-terminal tail) still exhibit leaky phosphorylation in the presence of inhibitor.
EXPERIMENTAL PROCEDURES
Materials
Phorbol 12,13-dibutyrate (PDBu), uridine triphosphate (UTP), propranolol, Gö 6976, and Gö 6983 were from Calbiochem. Flag M2 monoclonal antibody (used in immunoprecipitations), Flag polyclonal antibody (used for Western blotting) and CID 755673 were from Sigma-Aldrich. Protein A/G Ultralink resin was from Thermo Scientific. Protein Phosphatase 1 (PP1) was obtained from New England Biolabs. PKD Antibody, Phospho-PKD (Ser744/748) Antibody and Phospho-PKD (Ser916) Antibody were from Cell Signaling. DMEM, PBS and Hank’s Balanced Salt Solution (HBSS) were obtained from Cellgro. Pure PKCδ was from Millipore. Phosphatidylserine (PS) and diacylglycerol (DAG) were obtained from Avanti Polar Lipids. All other materials were reagent grade.
Plasmid constructs
DNA encoding Golgi-CFP was originally described in (Gallegos et al, 2006). pcDNA3-DKAR was originally described in (Kunkel et al, 2007). DNA encoding HA-PKD1 and Flag-PKD2 were gifts from Dr. Alex Toker. DNA encoding YFP-PKD2 was described in (Kunkel et al, 2009). CFP-PKCβII-YFP (Kinameleon) was previously described in (Antal et al, 2014). CFP-PKD2-YFP was made by subcloning PKD2 in place of PCKβII within the original CFP-PKCβII-YFP.
Cell culture and transfection
COS-7 cells were maintained in DMEM containing 10% fetal bovine serum and 1% penicillin/streptomycin at 37°C in 5% CO2. Transient transfection was carried out using FuGENE 6 (Promega).
PKD activation time courses
COS-7 cells were grown to confluence in 60 mm dishes. Cells were washed once and then treated at room temperature or 37°C in HBSS containing 1 mM Ca2+. Inhibitor pre-treatment was for 10 minutes with 250 nM Gö 6983, or 500 nM Gö 6976, or 50 μM CID 755673. 100 μM UTP was added for the indicated times. Treatments were stopped on ice and cells were washed with PBS and lysed in 100 μl PPHB (50 mM NaPO4, 20 mM NaF, 1 mM NaP2O7, 2 mM EDTA, 2 mM EGTA, pH 7.5) with 1% Triton supplemented with 1 mM DTT, 1 mM PMSF, 40 μg/ml leupeptin, 1 μM bestatin, and 1 μM microcystin. The Triton-insoluble fraction was removed by centrifugation and the soluble fraction analyzed by SDS-PAGE and Western blotting via chemiluminescence on a FluorChem Q imaging system (ProteinSimple). Total and phospho-specific antibodies against PKD (listed under Materials) were used to detect the PKD isozymes endogenous to COS-7 cells.
In vitro experiments with immunoprecipitated PKD
2 × 10 cm dishes of COS-7 cells were transiently transfected with DNA encoding Flag-PKD2 and grown to confluence. For dephosphorylation experiments using PP1, Flag-PKD2 cells were first treated for 15 minutes with 200 nM PDBu before harvesting to maximally phosphorylate PKD2. Cells were washed once with PBS and then lysed in 1 ml of PBS/1% Triton containing protease inhibitors; for dephosphorylation experiments, microcystin was included in the lysis buffer. The Triton-insoluble portion was removed by centrifugation. 2 μl anti-Flag M2 antibody was added to the remaining lysate and rocked for 1 hour at 4°C, followed by addition of 20 μl Protein A/G Ultralink resin and 1 more hour of rocking at 4°C. Beads were pelleted and washed 3 times with 1 ml reaction buffer. For dephosphorylation experiments with PP1, beads were resuspended in 350 μl PP1 reaction buffer (NEB) supplemented with 140 μM/3.8 μM PS/DAG membranes [10× stock prepared as described in (Newton and Koshland, 1987)] and protease inhibitors. Beads were divided into two tubes and pre-incubated with 1] 50 μM CID 755673 or 2] DMSO for 10 minutes at room temperature. Reactions were initiated by the addition of PP1 at a final concentration of 25 U/ml. For Flag-PKD2 phosphorylation by PKCδ, beads were resuspended in 100 μl PKC buffer (20 mM HEPES, 2 mM DTT, 100 μg/ml BSA with protease inhibitors). Resuspended beads were divided into two tubes and pre-incubated with 1] 6 μM Gö 6976 or 2] DMSO for 10 minutes at room temperature. Reactions were initiated by addition of ATP (100 μMf), MgCl2 (5 mMf), 140 μM/3.8 μM PS/DAG membranes and 5 ng of 1280 U/mg PKCδ per tube. For both in vitro time courses, reactions proceeded at 30°C with regular mixing. Time points were removed and stopped by the addition of sample buffer at the indicated times. Each time point was run in triplicate by SDS-PAGE and analyzed by Western blotting via chemiluminescence on a FluorChem Q imaging system (ProteinSimple). Data averages +/− SEM were plotted and analyzed using Prism (GraphPad Software). For dephosphorylation experiments with PP1, the halftime of dephosphorylation was calculated by fitting the data to a nonlinear regression using a one phase decay equation within the software. For phosphorylation experiments with PKCδ, data were fit by linear regression to calculate relatives rates of phosphorylation.
Cell imaging
COS-7 cells were plated onto sterilized glass coverslips in 35 mm dishes prior to transfection. For DKAR experiments, cells were transfected with 1 μg DKAR DNA with or without 1 μg PKD DNA. For Golgi localization imaging, cells were transfected with 1 μg YFP-PKD2 DNA and 0.1 μg Golgi-CFP DNA. For CFP-PKD2-YFP or CFP-PKCβII-YFP experiments, cells were transfected with 1 μg DNA. 24 hours following transfection, cells were washed once and then imaged in HBSS containing 1 mM CaCl2 in the dark, at room temperature. 200 nM PDBu, 100 μM propranolol, 50 μM CID 755673, 500 nM or 6 μM Gö 6976 were added when indicated. CFP, YFP and FRET images were acquired and analyzed as previously described (Kunkel et al, 2005). For DKAR experiments, the FRET ratio plotted was CFP/FRET, whereas for Golgi localization and CFP-PKD2-YFP experiments, the FRET ratio plotted was FRET/CFP; the inverse FRET ratio is plotted for DKAR experiments so that a phosphorylation event is shown as an increase in the plot.
Supplementary Material
Acknowledgments
We thank Lisa L. Gallegos for generation of the pDEST-mCherry plasmid and members of the Newton Lab for helpful comments. This work was supported by NIH P01 DK54441 to ACN.
Footnotes
Publisher's Disclaimer: This is a PDF file of an unedited manuscript that has been accepted for publication. As a service to our customers we are providing this early version of the manuscript. The manuscript will undergo copyediting, typesetting, and review of the resulting proof before it is published in its final citable form. Please note that during the production process errors may be discovered which could affect the content, and all legal disclaimers that apply to the journal pertain.
References
- Antal CE, Violin JD, Kunkel MT, Skovso S, Newton AC. Intramolecular conformational changes optimize protein kinase C signaling. Chem Biol. 2014;21:459–469. doi: 10.1016/j.chembiol.2014.02.008. [DOI] [PMC free article] [PubMed] [Google Scholar]
- Baron CL, Malhotra V. Role of diacylglycerol in PKD recruitment to the TGN and protein transport to the plasma membrane. Science. 2002;295:325–328. doi: 10.1126/science.1066759. [DOI] [PubMed] [Google Scholar]
- Braun DC, Garfield SH, Blumberg PM. Analysis by fluorescence resonance energy transfer of the interaction between ligands and protein kinase Cdelta in the intact cell. J Biol Chem. 2005;280:8164–8171. doi: 10.1074/jbc.M413896200. [DOI] [PubMed] [Google Scholar]
- Calleja V, Ameer-Beg SM, Vojnovic B, Woscholski R, Downward J, Larijani B. Monitoring conformational changes of proteins in cells by fluorescence lifetime imaging microscopy. Biochem J. 2003;372:33–40. doi: 10.1042/BJ20030358. [DOI] [PMC free article] [PubMed] [Google Scholar]
- Cameron AJ, Escribano C, Saurin AT, Kostelecky B, Parker PJ. PKC maturation is promoted by nucleotide pocket occupation independently of intrinsic kinase activity. Nat Struct Mol Biol. 2009;16:624–630. doi: 10.1038/nsmb.1606. [DOI] [PubMed] [Google Scholar]
- Chan TO, Zhang J, Rodeck U, Pascal JM, Armen RS, Spring M, Dumitru CD, Myers V, Li X, Cheung JY, et al. Resistance of Akt kinases to dephosphorylation through ATP-dependent conformational plasticity. Proc Natl Acad Sci U S A. 2011;108:E1120–1127. doi: 10.1073/pnas.1109879108. [DOI] [PMC free article] [PubMed] [Google Scholar]
- Dutil EM, Newton AC. Dual role of pseudosubstrate in the coordinated regulation of protein kinase C by phosphorylation and diacylglycerol. J Biol Chem. 2000;275:10697–10701. doi: 10.1074/jbc.275.14.10697. [DOI] [PubMed] [Google Scholar]
- Gallegos LL, Kunkel MT, Newton AC. Targeting Protein Kinase C Activity Reporter to Discrete Intracellular Regions Reveals Spatiotemporal Differences in Agonist-dependent Signaling. J Biol Chem. 2006;281:30947–30956. doi: 10.1074/jbc.M603741200. [DOI] [PubMed] [Google Scholar]
- Gao T, Toker A, Newton AC. The carboxyl terminus of protein kinase c provides a switch to regulate its interaction with the phosphoinositide-dependent kinase, PDK-1. J Biol Chem. 2001;276:19588–19596. doi: 10.1074/jbc.M101357200. [DOI] [PubMed] [Google Scholar]
- Gould CM, Antal CE, Reyes G, Kunkel MT, Adams RA, Ziyar A, Riveros T, Newton AC. Active site inhibitors protect protein kinase C from dephosphorylation and stabilize its mature form. The Journal of biological chemistry. 2011;286:28922–28930. doi: 10.1074/jbc.M111.272526. [DOI] [PMC free article] [PubMed] [Google Scholar]
- Harikumar KB, Kunnumakkara AB, Ochi N, Tong Z, Deorukhkar A, Sung B, Kelland L, Jamieson S, Sutherland R, Raynham T, et al. A novel small-molecule inhibitor of protein kinase D blocks pancreatic cancer growth in vitro and in vivo. Molecular cancer therapeutics. 2010;9:1136–1146. doi: 10.1158/1535-7163.MCT-09-1145. [DOI] [PMC free article] [PubMed] [Google Scholar]
- Hoshi N, Langeberg LK, Gould CM, Newton AC, Scott JD. Interaction with AKAP79 Modifies the Cellular Pharmacology of PKC. Mol Cell. 2010;37:541–550. doi: 10.1016/j.molcel.2010.01.014. [DOI] [PMC free article] [PubMed] [Google Scholar]
- Iglesias T, Rozengurt E. Protein kinase D activation by mutations within its pleckstrin homology domain. J Biol Chem. 1998;273:410–416. doi: 10.1074/jbc.273.1.410. [DOI] [PubMed] [Google Scholar]
- Iglesias T, Rozengurt E. Protein kinase D activation by deletion of its cysteine-rich motifs. FEBS Lett. 1999;454:53–56. doi: 10.1016/s0014-5793(99)00772-3. [DOI] [PubMed] [Google Scholar]
- Kunkel MT, Garcia EL, Kajimoto T, Hall RA, Newton AC. The protein scaffold NHERF-1 controls the amplitude and duration of localized protein kinase D activity. J Biol Chem. 2009;284:24653–24661. doi: 10.1074/jbc.M109.024547. [DOI] [PMC free article] [PubMed] [Google Scholar]
- Kunkel MT, Newton AC. Calcium transduces plasma membrane receptor signals to produce diacylglycerol at Golgi membranes. The Journal of biological chemistry. 2010;285:22748–22752. doi: 10.1074/jbc.C110.123133. [DOI] [PMC free article] [PubMed] [Google Scholar]
- Kunkel MT, Ni Q, Tsien RY, Zhang J, Newton AC. Spatio-temporal dynamics of protein kinase B/Akt signaling revealed by a genetically encoded fluorescent reporter. J Biol Chem. 2005;280:5581–5587. doi: 10.1074/jbc.M411534200. [DOI] [PMC free article] [PubMed] [Google Scholar]
- Kunkel MT, Toker A, Tsien RY, Newton AC. Calcium-dependent regulation of protein kinase D revealed by a genetically encoded kinase activity reporter. J Biol Chem. 2007;282:6733–6742. doi: 10.1074/jbc.M608086200. [DOI] [PMC free article] [PubMed] [Google Scholar]
- Lin K, Lin J, Wu WI, Ballard J, Lee BB, Gloor SL, Vigers GP, Morales TH, Friedman LS, Skelton N, et al. An ATP-site on-off switch that restricts phosphatase accessibility of Akt. Science signaling. 2012;5:ra37. doi: 10.1126/scisignal.2002618. [DOI] [PubMed] [Google Scholar]
- Newton AC, Koshland DE., Jr Protein kinase C autophosphorylates by an intrapeptide reaction. J Biol Chem. 1987;262:10185–10188. [PubMed] [Google Scholar]
- Okuzumi T, Fiedler D, Zhang C, Gray DC, Aizenstein B, Hoffman R, Shokat KM. Inhibitor hijacking of Akt activation. Nat Chem Biol. 2009;5:484–493. doi: 10.1038/nchembio.183. [DOI] [PMC free article] [PubMed] [Google Scholar]
- Rozengurt E. Protein kinase D signaling: multiple biological functions in health and disease. Physiology. 2011;26:23–33. doi: 10.1152/physiol.00037.2010. [DOI] [PMC free article] [PubMed] [Google Scholar]
- Rozengurt E, Rey O, Waldron RT. Protein kinase D signaling. J Biol Chem. 2005;280:13205–13208. doi: 10.1074/jbc.R500002200. [DOI] [PubMed] [Google Scholar]
- Sharlow ER, Giridhar KV, LaValle CR, Chen J, Leimgruber S, Barrett R, Bravo-Altamirano K, Wipf P, Lazo JS, Wang QJ. Potent and selective disruption of protein kinase D functionality by a benzoxoloazepinolone. The Journal of biological chemistry. 2008;283:33516–33526. doi: 10.1074/jbc.M805358200. [DOI] [PMC free article] [PubMed] [Google Scholar]
- Srivastava J, Goris J, Dilworth SM, Parker PJ. Dephosphorylation of PKCdelta by protein phosphatase 2Ac and its inhibition by nucleotides. FEBS Lett. 2002;516:265–269. doi: 10.1016/s0014-5793(02)02500-0. [DOI] [PubMed] [Google Scholar]
- Toker A. The biology and biochemistry of diacylglycerol signalling. Meeting on molecular advances in diacylglycerol signalling. EMBO Rep. 2005;6:310–314. doi: 10.1038/sj.embor.7400378. [DOI] [PMC free article] [PubMed] [Google Scholar]
Associated Data
This section collects any data citations, data availability statements, or supplementary materials included in this article.