Abstract
Three commercial metal artifact reduction methods were evaluated for use in computed tomography (CT) imaging in the presence of clinically realistic metal implants: Philips O-MAR, GE's monochromatic Gemstone Spectral Imaging (GSI) using dual-energy CT, and GSI monochromatic imaging with metal artifact reduction software applied (MARs). Each method was evaluated according to CT number accuracy, metal size accuracy, and streak artifact severity reduction by using several phantoms, including three anthropomorphic phantoms containing metal implants (hip prosthesis, dental fillings, and spinal fixation rods). All three methods showed varying degrees of success for the hip prosthesis and spinal fixation rod cases, while none were particularly beneficial for dental artifacts. Limitations of the methods were also observed. MARs underestimated the size of metal implants and introduced new artifacts in imaging planes beyond the metal implant when applied to dental artifacts, and both the O-MAR and MARs algorithms induced artifacts for spinal fixation rods in a thoracic phantom. Our findings suggest that all three artifact mitigation methods may benefit patients with metal implants, though they should be used with caution in certain scenarios.
Keywords: CT, metal artifact reduction, treatment planning, simulation, metal implants
1. Introduction
Patients requiring computed tomography (CT) imaging routinely have metal implants, and these implants cause well-known imaging artifacts. These artifacts, when severe, not only degrade diagnostic image quality, but also complicate the radiation therapy treatment process. In radiation therapy treatment planning, CT images are used for delineating targets and critical organs, defining the treatment geometry, and assigning densities for heterogeneous dose calculations. For treatment planning, CT imaging artifacts make it difficult for the physician to confidently delineate the tumor and surrounding organs and cause errors in CT numbers (expressed in Hounsfield units [HU]), which can propagate to density assignment errors and subsequently dose calculation errors (Chu et al., 2000; Kilby et al., 2002; Papanikolaou et al., 2004).
CT streak artifacts are caused by a combination of beam hardening, photon starvation, scatter, edge effects, and patient motion (Barrett and Keat, 2004; Boas and Fleischmann, 2011; Bushberg, 2012). Various metal artifact reduction algorithms have been investigated in an effort to overcome these the various causes of metal artifacts (Zhao et al., 2000; Mahnken et al., 2003; Wei et al., 2006; Bazalova et al., 2007; Boas and Fleischmann, 201; Verburg and Seco, 2012; Spadea et al., 2014). Recently, commercial metal artifact reduction options have become available for CT imaging of patients with metal implants. This study focuses on three artifact mitigation methods: the algorithm for orthopedic implants (O-MAR) developed by Philips Healthcare (Cleveland, OH), monochromatic Gemstone Spectral Imaging (GSI) using dual-energy CT data without any additional metal artifact reduction post-processing applied, and GSI monochromatic imaging with metal artifact reduction software applied (MARs).
The Philips O-MAR algorithm is an iterative projection modification solution, whereby the data corrupted by streak artifacts are identified and corrected based on uncorrupted projection data. The O-MAR algorithm segments the original reconstructed image into metal and tissue pixels and uses these data to calculate a correction image (Li et al., 2012). O-MAR was designed primarily for orthopedic implants but has also been found to be effective for non-orthopedic metals, such as dental fillings (Philips White Paper, 2012). Although O-MAR has begun to be implemented in radiation oncology clinics, few published studies have evaluated its performance for treatment planning (Hilgers et al., 2014). Li et al. (2012) found that CT number accuracy, noise, and image quality were improved with the use of O-MAR; however, their study was limited in that it focused solely on patients with hip prostheses receiving radiation therapy for prostate cancer. Glide-Hurst et al. (2013) investigated the O-MAR algorithm, in conjunction with extended-bit depth, for several patient cases with various types of orthopedic implants.
Unlike the Philips O-MAR algorithm, which is a software-only approach for conventional CT data, GSI monochromatic imaging is a fundamentally different approach to metal artifact reduction that uses dual-energy CT data. The HD750 Discovery system (GE Healthcare, Milwaukee, WI) uses a single X-ray source that rapidly switches between two kilovoltage settings (80 and 140 kVp) to acquire projections using alternating high and low energy X-ray spectra (Hsieh, 2009; Pessis et al., 2013). With projection data acquired at two different energies, it is then possible to generate synthesized virtual monochromatic images that depict how an object would look if it were imaged using a monoenergetic X-ray source (Goodsitt et al., 2011). Although they are not truly monochromatic images, these virtual monochromatic images show reduced beam hardening artifacts in comparison to conventional polyenergetic images (Li et al., 2011; Silva et al., 2011; Yu et al., 2012). The GSI dual-energy CT system has shown promise in diagnostic imaging for patients with orthopedic prostheses (Lee et al., 2012), spinal screws (Wang et al., 2013), and fiducial markers (Brook et al., 2012). Although there has been some interest in using GSI dual-energy CT for radiation therapy treatment planning (Yagi et al., 2013), no studies to the authors' knowledge have to date performed a thorough evaluation of this dual-energy CT system as an artifact mitigation method for treatment planning purposes.
To further reduce artifacts, GE has developed metal artifact reduction software (MARs) specifically for use with GSI monochromatic imaging that addresses the photon starvation aspect of metal streak artifacts (Lee et al., 2012). It should be noted that for this study GSI virtual monochromatic imaging and GSI imaging with MARs will be evaluated separately as two different metal artifact reduction methods. Although GSI images and MARs images can be reconstructed from the same acquired projection data, it is the authors' opinion that the two methods are sufficiently different and should be considered separately. GSI virtual monochromatic imaging shows reduced beam hardening artifacts without MARs, while application of MARs is a post processing step on the monochromatic images that can further reduce artifacts but can also affect the appearance of metal implants (Lee et al, 2012; Wang et al. 2013).
Although studies of these artifact mitigation methods have been published, these have typically focused on only a single type of implant, such as a hip prosthesis, have evaluated only a single metal artifact mitigation method, or have evaluated only those metrics that are important for diagnostic imaging. Therefore, a more extensive evaluation of these commercial methods would be valuable, especially one that includes the various implants that are commonly encountered in radiation therapy and criteria that are relevant for treatment planning and dose calculation accuracy. This would provide users with information about the merits and pitfalls of each method. Thus, the purpose of this study was to evaluate the success of these three commercial artifact mitigation methods based on several criteria: the accuracy of CT numbers in regions of interest, accuracy in the representation of the size of metal objects, and reduction in the severity of streak artifacts. To perform this evaluation, we used four different phantoms: a geometric tissue characterization phantom and three anthropomorphic phantoms equipped with metal implants, including a hip prosthesis, dental fillings, and spinal fixation rods.
2. Methods and materials
2.1. Imaging protocol
Several phantoms were used to evaluate the artifact mitigation methods. All phantoms were scanned using both the Philips Brilliance (Cleveland, OH) and the Discovery™ CT750 HD (GE Healthcare, Milwaukee, WI) scanners. Each phantom was scanned without metal to acquire an artifact-free image (“baseline scan”) and with metal (“metal scan”). For the Philips scanner, each phantom was scanned using 120kVp and then reconstructed with and without the O-MAR algorithm. For the GE scanner, each phantom was scanned using polyenergetic imaging, i.e., 120kVp, and with dual-energy mode, which allows for monochromatic image reconstruction. For the GSI dual-energy scans, monochromatic images were generated at two different energies, 70keV and 140keV. 70keV was chosen because it closely matches the contrast-to-noise ratio of the conventional 120kVp scans (Zhang et al., 2011); 140keV was chosen because it is the highest energy available and thus allowed us to evaluate the GSI system at a wide range of reconstruction energies. Image sets were generated at both monochromatic energies (70keV and 140keV) with and without the MARs algorithm. CT protocols were matched between the two different vendors as closely as possible based on various acquisition and reconstruction parameters; these parameters are listed in table 1 for all the phantom scans in this study. All reconstructed images were 12-bit depth images. In summary, phantom images were obtained using conventional imaging protocols (“Philips 120kVp” and “GE 120kVp”) and the three artifact mitigation methods that we investigated: O-MAR, GSI monochromatic imaging (“GSI 70keV” and “GSI 140keV”), and GSI monochromatic imaging with MARs (“MARs 70keV” and “MARs 140keV”).
Table 1.
Scan protocols for all phantom scans using the Philips Brilliance and the HD750 GE Discovery CT scanners. All protocols are helical scans.
| Phantom | Protocol | Pitch | mA | Tube rotation time (s) | Filter | SFOV (cm) | Slice thickness (cm) | DFOV (cm) | Recon kernel | CTDIvol (mGy) |
|---|---|---|---|---|---|---|---|---|---|---|
| RMI phantom | Philips 120kVp | 0.938 | 375 | 0.75 | B | 60 | 3 | 36 | B | 19.9 |
| GE 120kVp | 0.969 | 450 | 0.5 | Medium | 50 | 2.5 | 36 | Standard | 21.2 | |
| GE GSI preset #35 | 0.969 | 630 | 0.5 | Medium | 50 | 2.5 | 36 | Standard | 20.2 | |
|
| ||||||||||
| Head phantom | Philips 120kVp | 0.688 | 202 | 0.75 | B | 60 | 3 | 25 | B | 26.2 |
| GE 120kVp | 0.516 | 280 | 0.6 | Medium | 50 | 2.5 | 25 | Standard | 26.0 | |
| GE GSI preset #32 | 0.516 | 375 | 0.6 | Medium | 50 | 2.5 | 25 | Standard | 26.0 | |
|
| ||||||||||
| Pelvic phantom | Philips 120kVp | 0.938 | 263 | 0.75 | B | 60 | 3.0 | 36 | B | 13.9 |
| GE 120kVp | 0.984 | 265 | 0.6 | Medium | 50 | 2.5 | 36 | Standard | 12.7 | |
| GE GSI preset #41 | 0.984 | 360 | 0.6 | Medium | 50 | 2.5 | 36 | Standard | 12.8 | |
|
| ||||||||||
| Spine phantom | Philips 120kVp | 0.938 | 300 | 0.75 | B | 60 | 3.0 | 50 | B | 15.9 |
| GE 120kVp | 0.969 | 265 | 0.7 | Medium | 50 | 2.5 | 50 | Standard | 17.1 | |
| GE GSI preset #25 | 0.969 | 375 | 0.7 | Medium | 50 | 2.5 | 50 | Standard | 17.0 | |
2.2. RMI phantom
The RMI 467 tissue characterization phantom (Gammex, Middleton, WI) contains several interchangeable plugs that mimic various heterogeneous tissues, including adipose, solid water, liver, cortical bone, and lung. To mimic a range of prostheses materials, several custom-made metal cylindrical plugs were also used with this phantom: aluminum, stainless steel, titanium, and Cerrobend. The titanium plug is actually a bundle of 7 smaller rods. Metal and tissue substitute plugs were 2.8 cm in diameter. The phantom was scanned with a single metal plug in a peripheral location (for each of the four materials) and with two metal plugs in a bilateral configuration (figure 1). For the bilateral configuration, titanium and stainless steel plugs were chosen because these materials are commonly used for hip prostheses (Reft et al., 2003). Data analysis was performed using the central slice of the RMI phantom image set, and all scans were repeated three times to investigate the reproducibility of the various imaging techniques and artifact mitigation methods. The RMI phantom images were analyzed for all three evaluation criteria: CT number accuracy, metal diameter accuracy, and severity of streak artifacts.
Figure 1.
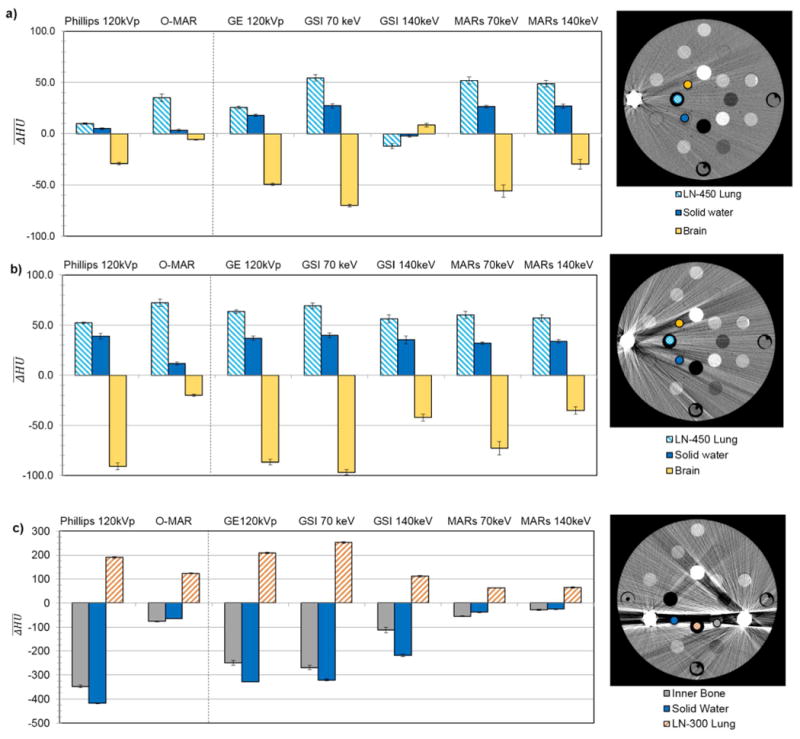
for select tissue substitue regions of interest in the RMI phantom scanned with (a) a unilateral titanium plug, (b) a unilateral stainless steel plug, and (c) bilateral stainless steel and titanium plugs. are grouped by imaging techniqe, including uncorrected imaging methods (120kVp) as well as the metal artifact reduction methods. For each plot, a CT image (Philips 120kVp protocol, WL=0, WW=500) on the right shows the location of the tissue substitute inserts for which is plotted and the position of metal inserts in the phantom. Error bars indicate the standard error of the mean for three repeated scans.
2.3. Anthropomorphic phantoms
Because the results of the RMI phantom were dependent on the arrangement of metals and tissue substitute plugs in the phantom, more clinically applicable results were desired. Therefore, anthropomorphic phantoms were also used to evaluate the artifact mitigation methods in a geometry that more closely represented actual clinical conditions. Three anthropomorphic phantoms were chosen to represent common metal implants encountered in radiation oncology, as described below. For these anthropomorphic phantoms, each method was evaluated on the basis of its ability to reduce the severity of streak artifacts.
2.3.1. Pelvic phantom with hip prosthesis
This anthropomorphic pelvic phantom was designed by the Radiological Physics Center (RPC; Houston, TX) and contains structures mimicking the prostate, bladder, and rectum contained in a centrally located water-filled imaging insert (Followill et al., 2007). The outer portion of the phantom, which is also water-filled, contains structures mimicking the femoral heads. For this study, the phantom was modified to hold a cobalt-chromium hip prosthesis (6.84 g/cm3). The phantom was imaged with and without the hip prosthesis.
2.3.2. Head phantom with dental fillings
To investigate the effectiveness of the metal artifact reduction methods on artifacts caused by dental work, a CIRS Model 606 head phantom (Computerized Imaging Reference Systems, Inc, Norfolk, VA) with articulating lower jaw, tongue, teeth, and air cavities was used. Two teeth in the lower jaw could be removed and interchanged with teeth containing dental restoration materials. In addition, a metal crown was taped on top of one of the original non-metal teeth. This phantom was scanned both with metal (with two fillings and crown) and without metal.
2.3.3. Thoracic phantom with spine stabilization rods
This anthropomorphic phantom was designed by the RPC and contains lung and heart structures, as well as a target structure in the left lung. A spine insert is usually included that contains structures representing the spinal cord, bone, and esophagus. For this study, the spinal insert was replaced with a high impact polystyrene insert. This insert included two titanium rods (9.5 mm diameter), mimicking spinal fixation rods. This phantom was scanned both with and without metal rods. For the baseline scan without the rods, the holes in the rectangular insert were filled in with high impact polystyrene rods.
2.4. Data analysis
2.4.1. CT number accuracy
CT number accuracy was quantified for the various artifact mitigation methods by using scans of the RMI phantom. The mean CT number of select tissue substitute plugs, chosen for their location within regions of streak artifacts, was obtained by using a 14 mm diameter region of interest (ROI) centered on the plug. The mean CT number over the ROI was measured on the baseline scan (no metal; ) and on every scan that included metal ( ), including both uncorrected and corrected metal images. The CT number error was then calculated for each metal scan using Eq. (1).
| (1) |
2.4.2. Metal diameter accuracy
The diameters of the stainless steel plug scanned with the RMI phantom and of the titanium rods scanned with the anthropomorphic thoracic phantom were calculated by identifying the metal pixels in the CT image using a threshold HU value (half the maximum metal HU value) and calculating the metal area in the image. For both metals, the metal area was obtained from five images, and the average metal area was used to calculate the diameter of the metal plug/rod. This calculated diameter was then compared to the physical diameter of the plug/rod obtained by electronic caliper measurements.
2.4.3. Severity of streak artifacts
The severity of streak artifacts was quantified for all four phantoms. The analysis included the entire phantom in the image plane (excluding any regions of air and the metal implant). For the RMI phantom, the analysis was performed for a central slice in the phantom image set, whereas for the anthropomorphic phantoms, multiple slices spanning the metal implant were analyzed. To quantify the severity of streak artifacts, the baseline image was registered to the metal image using rigid, intensity-based image registration in MATLAB. After image registration, an HU error map was created by subtracting the baseline image from the metal image. All pixels with an HU error of >40 HU were considered to be “bad pixels,” i.e., pixels in which the HU accuracy was negatively affected by the presence of streak artifacts. This 40 HU threshold was chosen because it corresponds to approximately a 0.03 g/cm3 density assignment error for water. This density assignment error was found to result in approximately 1%-2% dose calculation errors for 6MV photon treatments and is the electron density tolerance level recommended by Kilby et al. (2002). For each phantom image set analyzed, the percentage of bad pixels (pixels with HU error > 40 HU) was calculated. In addition, to take into account the magnitude of the HU errors of the bad pixels, an error metric Merror was also calculated using Eq. (2), where is the mean absolute CT number error of the bad pixels in the image.
| (2) |
For example, an Merror of 40 could correspond to 50% of the phantom pixels being bad (HU error >40), where the mean absolute CT number error of these bad pixels was 80 HU. For the anthropomorphic phantoms, for which several image planes were analyzed, average values for % bad pixels and Merror across the slices analyzed are reported.
3. Results
3.1. RMI phantom
3.1.1. CT number accuracy
Mean HU errors ( ) due to streak artifacts for conventional CT imaging as well as the artifact mitigation methods can be seen in figure 1 for select tissue substitute regions of interest and various metal configurations of the RMI phantom. The mean HU errors are grouped by imaging technique. In each case, three tissue equivalent inserts were evaluated. These inserts were selected due to their position within the area most strongly affected by the streak artifacts. A decreased absolute value of , i.e., decreased bar height, indicates an improvement in CT number accuracy. In general, the standard deviation of for three repeated scans was low (<10 HU) for all of the artifact mitigation methods for all scan configurations of the RMI phantom, indicating good reproducibility of the artifact mitigation methods. This reproducibility is depicted by the tight error bars in figure 1.
For Philips O-MAR, the HU accuracy was generally improved by application of the algorithm. The improvement in CT number accuracy was the most dramatic for the scan with bilateral steel and titanium plugs (figure 1c). For this metal configuration, for the solid water material, the absolute HU error ( ) decreased from >400 HU to 64 HU after O-MAR. However, the exception to this improvement in CT number accuracy was lung materials, which were made significantly worse with the application of O-MAR in some cases, as can be seen in both figures 1a and 1b. For instance, for lung increased from 52 HU to 72 HU due to O-MAR for the stainless steel plug scan (figure 1b).
For GSI imaging, monochromatic 70keV reconstructions gave similar or slightly worse values for as polyenergetic 120kVp imaging with the GE scanner. In contrast, monochromatic 140keV reconstructions generally gave lower values than 120kVp imaging, often substantially improving HU accuracy (e.g., figure 1c). Application of the MARs algorithm further decreased HU errors, except for the scan with the titanium plug (figure 1a), for which MARs increased HU errors for the 140keV image set. The largest increase in caused by MARs occurred for the LN-450 lung material, for which MARs resulted in an increase in absolute from 12 to 49 for 140keV imaging (figure 1a). However, for the bilateral scan with titanium and stainless steel plugs, MARs was very successful in decreasing the large CT number errors for the tissue equivalent inserts medial to the two metal plugs where the artifacts were most severe. For instance, MARs resulted in a decrease in absolute from >300 HU to 38 HU for the solid water plug for 70keV monochromatic imaging (figure 1c).
Mean CT number errors caused by the aluminum plug were small ( ) for all of the imaging techniques and algorithms studied, while CT number errors caused by the Cerrobend plug were very similar to those of the stainless steel plug (data not shown).
3.1.2. Metal diameter accuracy
All of the imaging techniques were able to represent the diameter of the stainless steel plug/rod with an accuracy of ±1.4 mm (approximately 2 pixels). Of note, whereas all of the other imaging techniques tended to overestimate the stainless steel rod diameter, the MARs algorithm caused an underestimation of the diameter (table 2).
Table 2.
Mean metal area, standard deviation of the metal area across five slices (σ), and calculated diameter for CT images of a stainless steel plug/rod scanned in the RMI phantom and titanium rods scanned in the anthropomorphic thoracic phantom. The diameter error is the difference between the calculated diameter and the physical diameter measured with electronic calipers, 28.6 mm for stainless steel and 9.5 mm for titanium.
| Imaging technique | Stainless steel rod | Titanium rod | ||||||
|---|---|---|---|---|---|---|---|---|
|
|
|
|||||||
| Metal area (mm2) | σ (mm2) | Calculated diameter (mm) | Diameter error (mm) | Metal area (mm2) | σ (mm2) | Calculated diameter (mm) | Diameter error (mm) | |
| Philips 120kVp | 704.0 | 2.1 | 29.9 | 1.4 | 169.4 | 0.5 | 10.4 | 0.9 |
| O-MAR | 693.2 | 1.6 | 29.7 | 1.1 | 166.7 | 0.4 | 10.3 | 0.8 |
| GE 120kVp | 695.0 | 1.6 | 29.7 | 1.2 | 168.2 | 0.5 | 10.3 | 0.9 |
| GSI 70keV | 701.2 | 0.9 | 29.9 | 1.3 | 175.5 | 0.7 | 10.6 | 1.1 |
| GSI 140keV | 699.5 | 1.2 | 29.8 | 1.3 | 148.2 | 0.9 | 9.7 | 0.2 |
| MARs 70keV | 582.1 | 2.3 | 27.2 | -1.3 | 76.5 | 1.3 | 7.0 | -2.5 |
| MARs 140keV | 578.2 | 0.7 | 27.1 | -1.4 | 74.0 | 0.9 | 6.9 | -2.6 |
3.1.3. Severity of streak artifacts
The error metric Merror (Eq. 2), the fraction of bad pixels (those whose error is >40 HU) multiplied by the mean absolute CT number error of these bad pixels, is shown in figure 2 for all scan configurations of the RMI phantom. Philips O-MAR, GSI 140keV, MARs 70keV, and MARs 140keV all successfully decreased the severity of streak artifacts, with MARs 140keV imaging being the most successful method overall, based on this metric.
Figure 2.
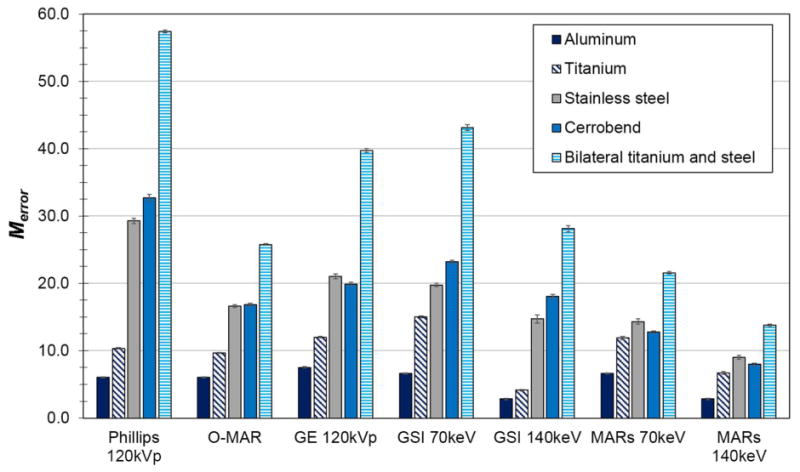
Merror, the fraction of bad pixels in the phantom image multiplied by the mean absolute CT number error of the bad pixels, for various imaging techniques and metal scan configurations of the RMI phantom.
3.2. Anthropomorphic phantoms
The anthropomorphic phantoms were evaluated qualitatively and quantitatively for their severity of streak artifacts. The quantitative results (% bad pixels and Merror) are summarized in table 3.
Table 3.
Summary of quantitative results for three anthropomorphic phantoms with metal implants. Listed for each phantom are the number of images analyzed, the mean percentage of bad pixels for those images, and the error metric Merror, which takes into account both the number of bad pixels and the magnitude of CT number errors of the bad pixels.
| Imaging technique | Hip prosthesis | Dental fillings | Spine stabilization rods | ||||||
|---|---|---|---|---|---|---|---|---|---|
|
|
|
|
|||||||
| No. of images | % bad pixels | Merror | No. of images a | % bad pixels | Merror | No. of images | % bad pixels | Merror | |
| Philips 120kVp | 36 | 46.6 | 61.0 | 6 | 27.2 | 50.1 | 21 | 6.9 | 7.9 |
| O-MAR | 36 | 31.6 | 29.6 | 6 | 25.0 | 41.0 | 21 | 9.1 | 7.2 |
| GE 120kVp | 44 | 36.8 | 38.0 | 6 | 22.4 | 41.7 | 21 | 12.2 | 12.9 |
| GSI 70keV | 44 | 33.8 | 36.4 | 6 | 22.8 | 42.2 | 21 | 19.2 | 22.0 |
| GSI 140keV | 44 | 29.2 | 32.5 | 6 | 20.4 | 38.0 | 21 | 5.9 | 4.3 |
| MARs 70keV | 44 | 19.1 | 15.1 | 6 | 32.6 | 55.8 | 21 | 17.4 | 12.7 |
| MARs 140keV | 44 | 12.1 | 10.0 | 6 | 24.7 | 35.5 | 21 | 11.6 | 8.0 |
Includes two images (one superior and one inferior to the images containing the metal fillings) that do not contain any metal
3.2.1. Pelvic phantom with hip prosthesis
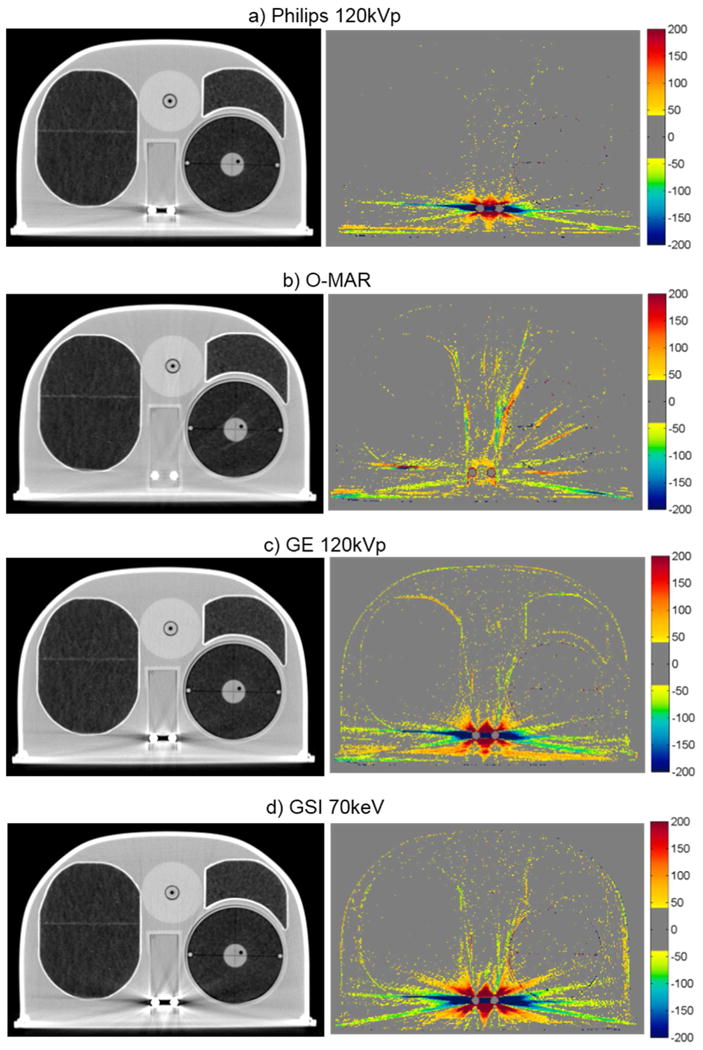
The artifact mitigation methods were generally successful in reducing the severity of streak artifacts for the pelvic phantom with hip prosthesis. This can be seen qualitatively in figure 3, which shows CT images and CT number difference maps between the metal-free baseline and metal (with Co-Cr hip prosthesis) images of this phantom. Both the number and severity of bad pixels were generally reduced by the artifact mitigation methods, as can be seen by a decrease in both the % of bad pixels and Merror compared with the uncorrected 120kVp images (table 3). Philips O-MAR reduced the mean percentage of bad pixels from 46.6% to 31.6% and reduced Merror by a factor of 2. For the GE system, GSI 140keV imaging resulted in a slight improvement in the severity of streak artifacts, reducing the mean percentage of bad pixels from 36.8% to 29.2%, compared with conventional 120kVp imaging. MARs 140keV imaging gave the most substantial improvement, reducing the bad pixels further to 12.1% and reducing Merror by nearly a factor of 4 (table 3). Based on these metrics, MARs 140keV was the most successful method for reducing the severity of streak artifacts for this phantom. However, it can be seen from figures 3f and 3g that the MARs algorithm causes a decrease in the CT number in the center femoral head portion of the implant that was not observed for the other imaging methods.
Figure 3.
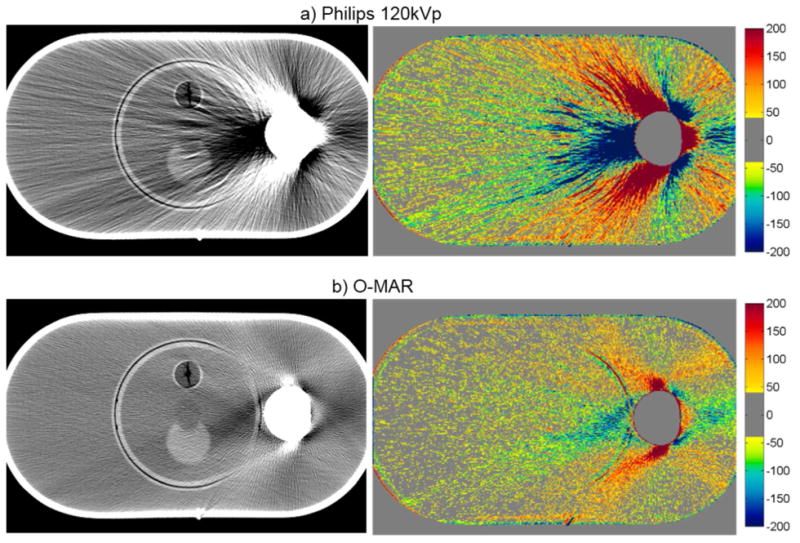
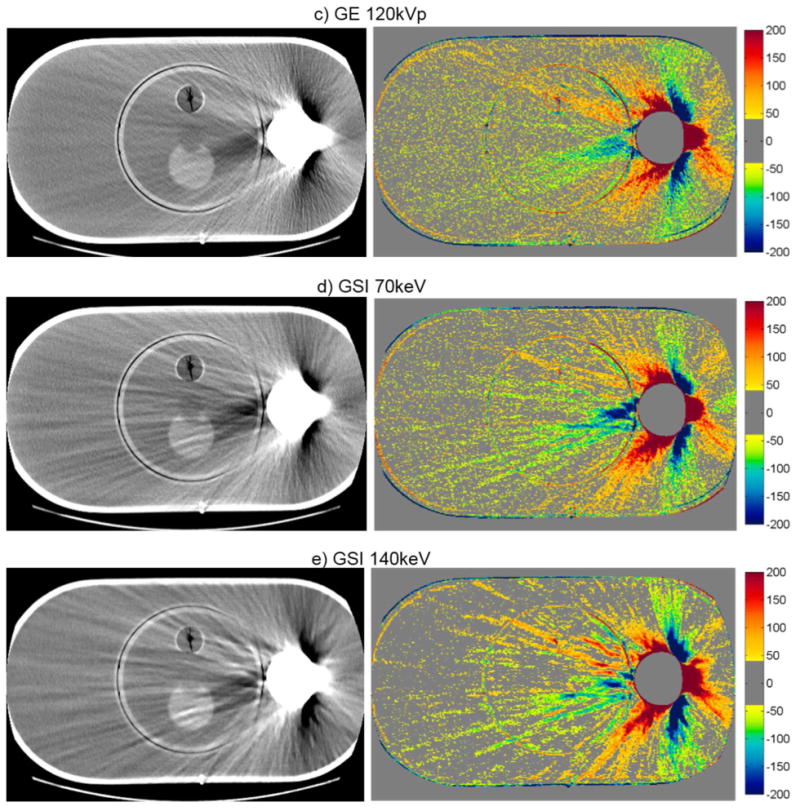
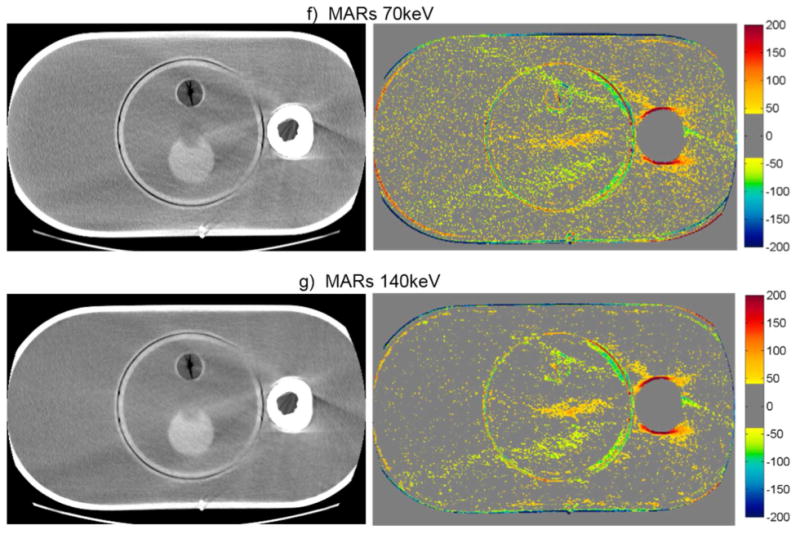
CT images of the pelvic phantom with hip prosthesis (WL=0, WW=500), side by side with the corresponding CT number difference maps between the baseline and the metal scans of the phantom for uncorrected imaging methods (“Philips 120kVp” and “GE 120kVp”) and artifact mitigation methods (“O-MAR”, “GSI”, and “MARs”).This image intersects the femoral head portion of the prosthesis.
3.2.2. Head phantom with dental fillings
For the head phantom with dental fillings, none of the artifact mitigation methods were particularly successful, as is evident by the HU difference maps of figure 4 and the quantitative results of table 3. While Philips O-MAR and GSI 140keV imaging resulted in small reductions of the percentage of bad pixels (with a change of 2.2% and 2.0%, respectively), the MARs algorithm actually increased the percentage of bad pixels for both 70keV and 140keV imaging, meaning that the artifacts were worsened by the application of the MARs algorithm for this phantom. The image in figure 4 shows some reduction in streak artifacts due to the artifact mitigation methods, specifically for O-MAR and MARs 140keV. However, in other image planes, there was less success, particularly toward the edges of the fillings. In fact, the MARs algorithm introduced additional artifacts on images that contained no metal themselves but were adjacent to image locations containing the metal fillings (“out-of-plane” artifacts). Figure 5 illustrates these artifacts introduced by the MARs algorithm. Because this particular image contains no portion of the metal fillings, the GSI 140keV image contains very few HU errors (figure 5a). However, MARs introduced artifacts in this image and caused a large increase in the number of bad pixels (HU error > 40) (figure 5b). To take into account these “out-of-plane” artifacts in our artifact severity metrics, two additional images, one superior and one inferior to the metal fillings, were included in our data analysis (table 3).
Figure 4.
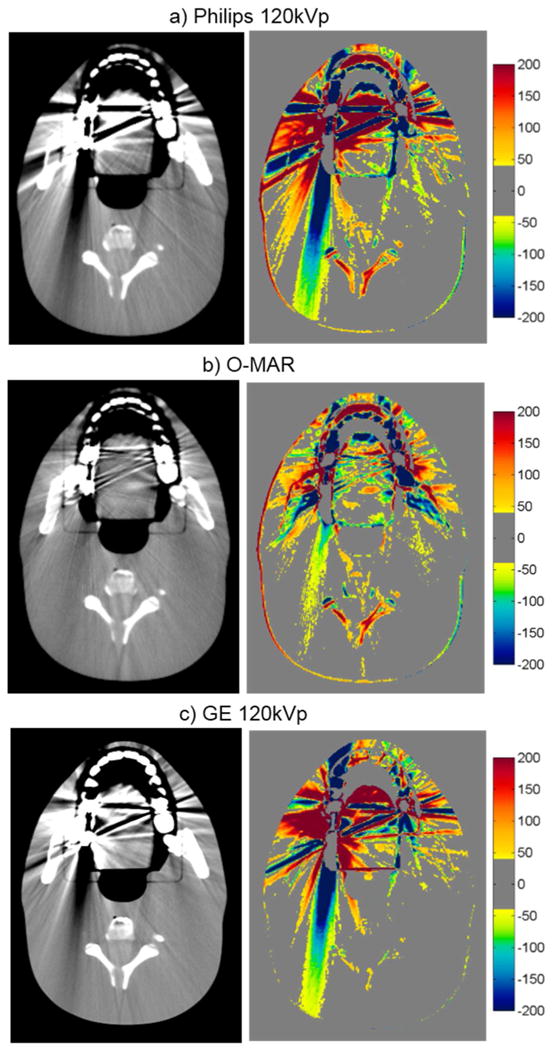
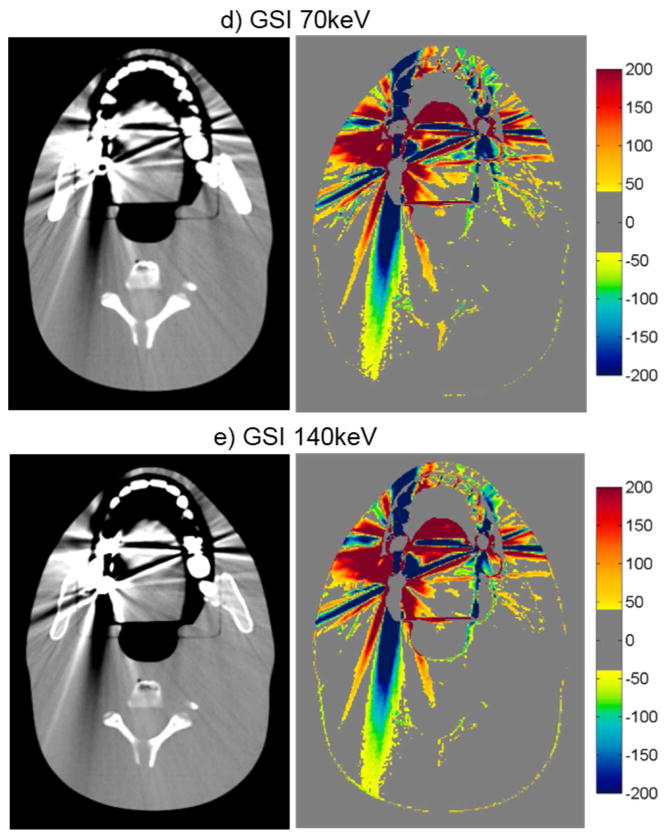
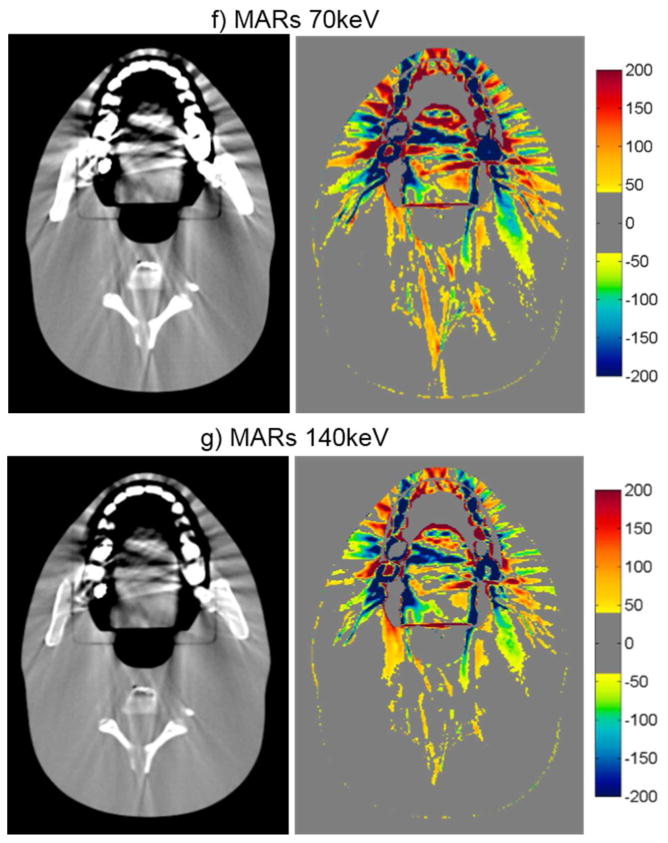
CT images of the head phantom with dental fillings (WL=0, WW=500), side by side with the corresponding CT number difference maps between the baseline and the metal scans of the phantom for uncorrected imaging methods (“Philips 120kVp” and “GE 120kVp”) and artifact mitigation methods (“O-MAR”, “GSI”, and “MARs”).
Figure 5.
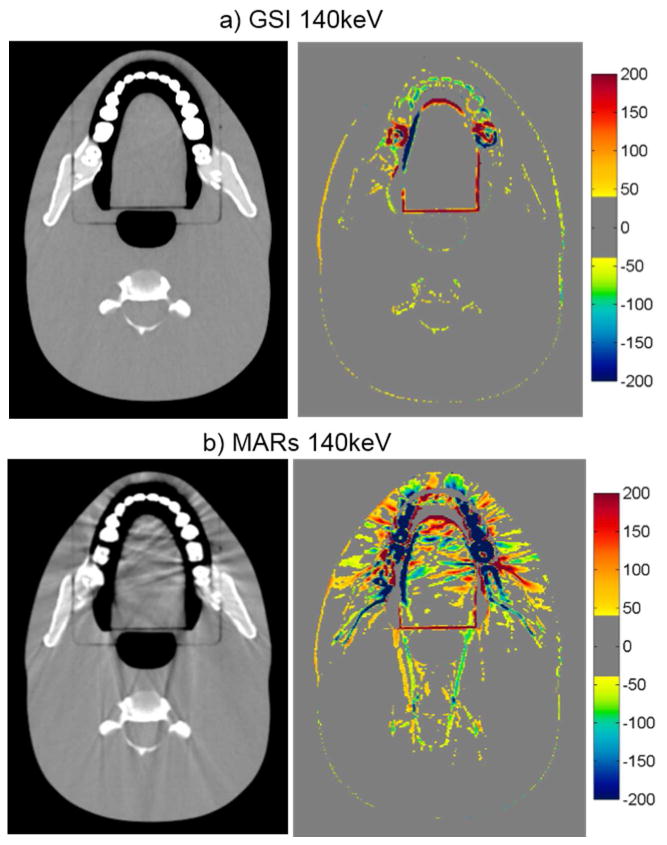
Grayscale CT images of the head phantom with dental fillings (WL=0, WW=500), side by side with the corresponding CT number difference maps between the baseline and the metal scans of the phantom for a) GSI 140keV and b) MARs 140keV imaging. Shown is an image of the head phantom that does not contain any portion of the metal fillings, illustrating out-of-plane artifacts introduced by the MARs algorithm.
3.2.3. Thoracic phantom with spine stabilization rods
The qualitative ability of the methods investigated to mitigate CT artifacts for the thoracic phantom with spinal rods is shown in figure 6. O-MAR actually resulted in an increase in the percentage of bad pixels, introducing new artifacts farther away from the metal (figure 6a versus 6b). However, this was offset by a decrease in the magnitude of HU errors of these bad pixels, particularly for pixels in close proximity to the metal rods, resulting in comparable values for the error metric Merror for imaging with and without O-MAR (table 3). GSI and GSI with MARs also showed mixed results. At 70 keV, both GSI and GSI with MARs showed an increase in the percentage of bad pixels, although the overall severity (Merror) was reduced slightly for the MARs case. However, at 140 keV, both the percentage of bad pixels and the severity of the artifacts were improved with GSI and GSI with MARs. Of note, similar to the Philips O-MAR algorithm, the MARs algorithm introduced artifacts far away from the rods for both energies investigated (figure 6f and 6g). GSI 140keV imaging (without MARs) was the most successful in reducing the severity of streak artifacts for this phantom and exhibited no added artifacts.
Figure 6.
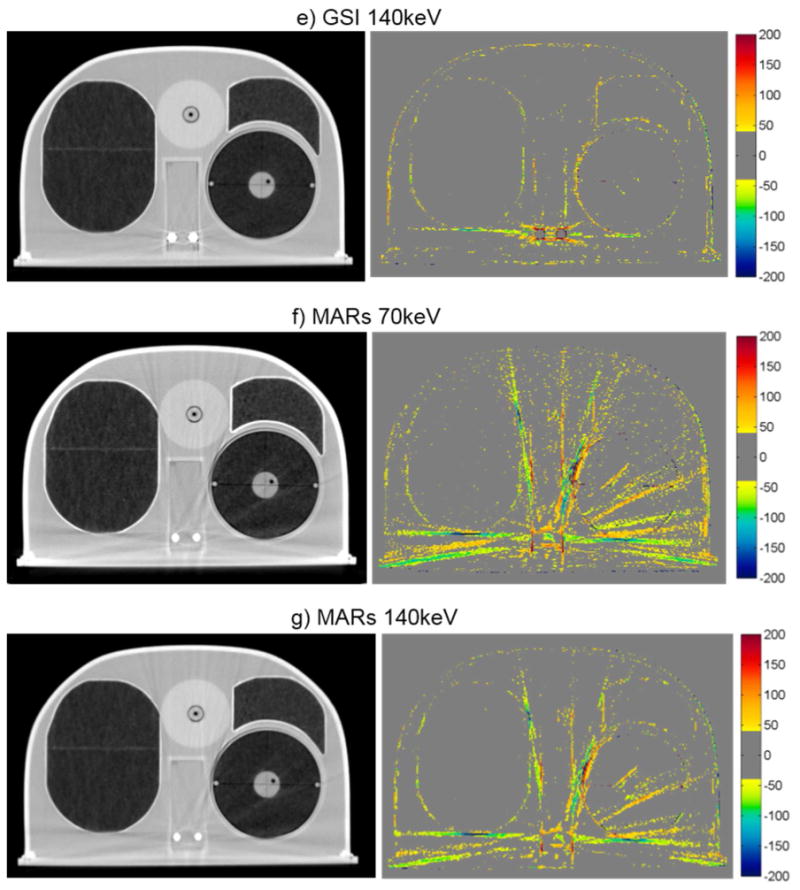
Grayscale CT images of the anthropomorphic thoracic phantom with titanium spinal rods (WL = -250, WW = 1250), side by side with the corresponding CT number difference maps between the baseline and the metal scans of the phantom for uncorrected imaging methods (“Philips 120kVp” and “GE 120kVp”) and artifact mitigation methods (“O-MAR”, “GSI”, and “MARs”).
The accuracy of the size of the titanium rods was also investigated by using the CT images of this phantom. Both O-MAR and GSI imaging were able to accurately represent the diameter to within 1.1 mm (approximately 1 pixel), as shown in table 2. However, MARs imaging at 70kev and 140keV underestimated the diameter of the titanium rod by about 2.6 mm, a 26% underestimation. To further investigate this underestimation of the titanium rod diameter by the MARs algorithm, profiles were taken through the titanium rod for all imaging methods (figure 7). From figure 7, it can be seen that while GSI imaging and application of O-MAR do not affect the shape or the FWHM of the profiles, application of the MARs algorithm not only decreases the FWHM but also results in a less steep fall off at the edges of the titanium rods.
Figure 7.
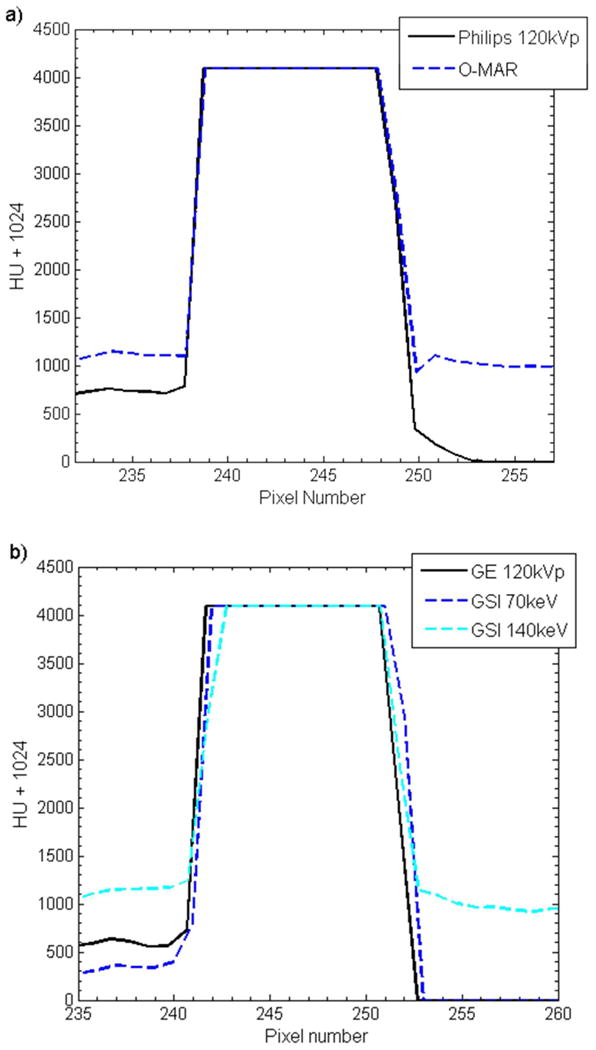
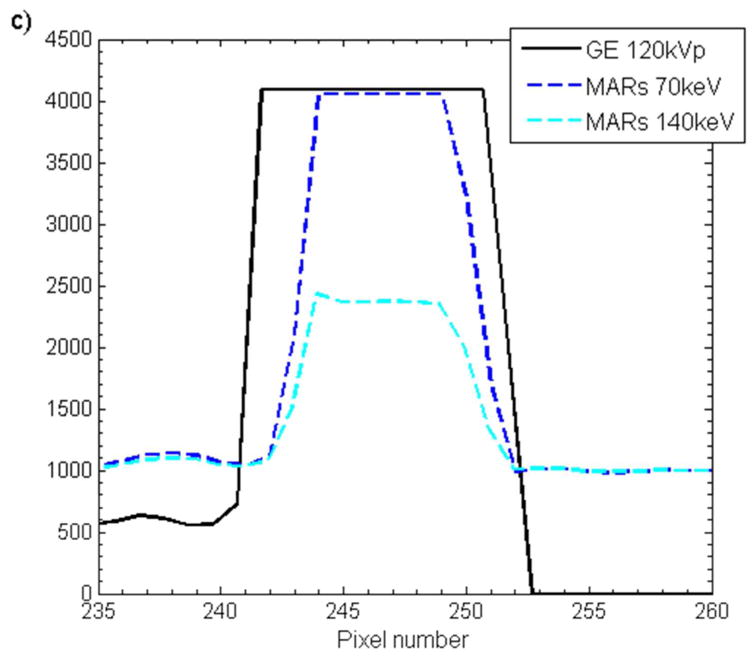
Horizonal pixel intensity profiles taken across one of the titanium rods scanned with the thoracic phantom for a) O-MAR, b) GSI imaging (“GSI 70keV” and “GSI 140keV”), and c) GSI imaging with MARs applied (“MARs 70keV” and “MARs 140keV”). The corresponding uncorrected imaging methods (“Philips 120kVp” and “GE 120kVp”) are also shown for comparison.
4. Discussion
In this study, three commercial metal artifact reduction methods were evaluated using metrics that evaluate image quality in the context of radiation therapy. Three anthropomorphic phantoms were used to evaluate how successful each method was at reducing artifacts for three common types of metal implants. Although each method exhibited some success in improving CT images, none of the methods were globally effective for all of the sites investigated, and some exhibited some limitations that users should be aware of. Strengths and weaknesses of each method are summarized in table 4.
Table 4.
Summary of our results for the various anthropomorphic phantoms and general impressions of the metal artifact reduction methods. √ indicates that the method resulted in a small reduction in streak artifacts, √√ indicates a more substantial reduction in streak artifacts, and ★ indicates that the method was the most successful method of the three investigated and was highly successful for the given site. X indicates that the method is not recommended for use at a particular site.
| Pelvic | Head | Thoracic | Weaknesses/Drawbacks | |
|---|---|---|---|---|
| O-MAR | √√ | √ | √ |
|
| GSI 140keV monochromatic imaging | √ | √ | ★ |
|
| MARs 140keV monochromatic imaging | ★ | X | √ |
|
For the case of a unilateral hip prosthesis, both O-MAR and MARs were fairly successful in reducing the severe artifacts caused by the implant. The geometry of the hip prosthesis case represents perhaps the most ideal geometry for metal artifact reduction methods in that a large metal implant is located in a fairly homogeneous environment. Thus, it is not surprising that the metal artifact reduction methods were successful for this particular site. In fact, O-MAR is designed primarily for orthopedic implants, and Li et al. (2012) previously found that O-MAR was successful for patients with hip prostheses, particularly for patients with large bilateral hip prostheses. The MARs algorithm is similar to O-MAR in that it is a projection modification approach to metal artifact reduction, whereby the projections affected by the metal object are identified and corrected for based on uncorrected data. However, MARs has the advantage that it is applied onto virtual monochromatic images that exhibit reduced beam hardening artifacts in comparison to polyenergetic imaging. Thus, the MARs 140keV imaging was the most successful method for the case of the hip prosthesis.
While the hip prosthesis case was an ideal case for metal artifact reduction, the case of dental fillings is perhaps the most challenging geometry. Dental fillings are small metal implants surrounded by a highly heterogeneous local environment including the teeth as well as air cavities. The methods investigated in this study were generally not successful in reducing the artifacts caused by dental fillings. Despite being designed for orthopedic implants, O-MAR did offer a slight benefit for the dental fillings, as did GSI virtual monochromatic imaging at 140keV, although gains were fairly modest. Notably, application of the MARs algorithm to the monochromatic images resulted in an increase in the overall severity of streak artifacts. Furthermore, MARs caused “out-of-plane” artifacts in adjacent image locations that did not contain any metal (figure 5). Although the exact cause of these “out-of-plane” artifacts is not known to the user, it is postulated that the MARs algorithm is sensitive the heterogeneities in close proximity to the metal implant, e.g., teeth and air gaps. The fact that induced artifacts are observed in adjacent image plans suggests that MARs performs some level of smoothing on the sinogram data, perhaps with a 3D convolution kernel that may not be appropriate for small metal implants such as dental fillings.
The case of the anthropomorphic thoracic phantom with two titanium spinal rods represents an intermediate level of difficult for the metal artifact reduction methods in that both the size of the metal implant and the level of heterogeneity in the environment surrounding the metal are intermediate between the case of the hip prosthesis and that of the dental fillings. For this phantom, we found that both O-MAR and MARs introduced similar artifacts; streaks were introduced between the titanium rods and the edges of the heart structure and between the rods and the edges of the target in the left lung. Interestingly, the artifacts were not introduced in a symmetric manner since no additional streaks were observed in the right lung, suggesting that these projection modification algorithms struggle with heterogeneities and material interfaces. Brook et al. (2012) also observed a similar introduction of additional artifacts when MARs was used for patients with gold fiducial markers, and other studies evaluating metal artifact reduction methods that perform linear interpolation of projection data also observed secondary artifacts introduced between metals and heterogeneities such as bone and contrast material (Prell et al., 2009; Boas and Fleischmann, 2011). It should be noted that Philips states that O-MAR is contraindicated for cases in which a metal implant is located near low-density tissue, such as lung, although the specifics of this recommendation are vague in terms of proximity (Philips White Paper, 2012). For this phantom, GSI monochromatic imaging was the most successful method for reducing artifacts caused by the titanium rods with 140keV virtual monochromatic images showing nearly complete artifact reduction (figure 6e).
GSI dual-energy CT data can be reconstructed at any energy from 40keV to 140keV to generate virtual monochromatic images. In this study, we evaluated 70keV and 140keV only. One limitation of this study is that only two energies were investigated. Lee et al. (2012) investigated MARs for metal artifact reduction of titanium and steel implants and found that 80keV and 110keV were the optimal energies for titanium and stainless steel respectively, while Wang et al. (2013) found that the optimal monochromatic energy level for pedicle screws was 110-140keV. Thus, the two energies we chose to investigate spanned the energies found to be successful in the literature. In our phantom studies, we found that GSI monochromatic 70keV images gave similar results to 120kVp images, while monochromatic 140keV images showed better artifact reduction than 70keV. The reduced artifacts in the 140keV images in comparison to the 70keV images can be explained by the fact that this high energy reconstruction has a higher proportion of information from the high energy projection data vs. the low energy projection data (140kVp vs. 80kVp). Since the high energy projections contain reduced beam hardening in comparison to the low energy projections, this reduced beam hardening propagates to the 140keV virtual monochromatic images.
We also investigated how accurate the various metal artifact reduction methods were able to accurately represent the size of metal objects. We found that the MARs underestimated the diameter of both stainless steel and titanium rods. For 29 mm diameter stainless steel rod, MARs images were able to preserve the diameter to within 1.4 mm (5% underestimation). However, for 9.5 mm diameter titanium rods, application of MARs resulted in a 2.6 mm (26%) underestimation of the diameter (table 2). In agreement with our results, Lee et al. (2012) found that while 140keV MARs images gave accurate dimensions for a stainless steel prosthesis (within 1 mm), the thickness of titanium was underestimated by approximately 3 mm. Wang et al. (2013) investigated MARs for patients with pedicle screws and found that the MARs algorithm resulted in unacceptable distortion in the shape and size screws. Profiles through the titanium rod revealed that not only did MARs decrease the width of the metal profile but MARs also affected the shape of the profile (figure 7c). In comparison to the profiles acquired from GSI images, the MARs profiles exhibit a larger penumbra region, suggesting that some sort of smoothing was applied with the MARs algorithm. It can also be seen from the MARs 140keV profile in figure 7c that MARs affects the HU values of metal implants. We investigated how MARs affects the HU values of various metals in our study (titanium, stainless steel, and Co-Cr alloy) and found that MARs consistently maps metals to a pre-defined HU level, with these pre-defined HU values varying as a function of monochromatic reconstruction energy. This data suggests that metal pixels are identified prior to application of the MARs algorithm, and these pre-defined metal HU values are inserted back into the image after application of MARs. Interestingly, it was also observed that the MARs algorithm can decrease HU values in the center of large metal implants (figures 3f and 3g).
In addition to metal objects appearing smaller than reality in the image plane, we also observed a distortion in the size of metal objects along the scan direction. Specifically, for the hip prosthesis, no metal was visible on the MARs image at the image location containing the most superior portion of the femoral head component of the prosthesis (this metal was visible at the same image location with both GSI imaging without MARs and 120kVp polyenergetic imaging). The same effect was observed for the edge of the titanium rods in the spine phantom. Brook et al. (2012) found similar distortions, in that MARs caused some gold fiducial markers to be barely visible in patient scans. These distortions again suggest that MARs performs some form of smoothing on the image data.
Successful reduction of streak artifacts will allow more confidence in the contouring of the target and surrounding structures, allow more flexibility of beam arrangements, and improve dose calculation accuracy by providing more accurate CT numbers. Li et al. (2012) found small dosimetric differences (generally <1% of prescription dose) between treatment plans calculated on the O-MAR vs. non-OMAR images for prostate cancer patients with unilateral hip prostheses. However, in the head and neck region, where targets and critical organs can be located very close to dental restorations, the artifact mitigation methods may have a greater impact on dose calculation accuracy. Future studies are planned to investigate the dosimetric impact of these metal artifact reduction methods, in conjunction with a novel implementation of collapsed cone convolution/superposition dose calculation using metal kernels (Huang et al., 2013).
5. Conclusion
Commercial metal artifact reduction methods were evaluated for their effectiveness in reducing metal artifacts in CT images. Although the metal artifact reduction methods were evaluated based on metrics that are most relevant to treatment planning dose calculation accuracy, our results nonetheless provide useful information about CT imaging in general. Our data suggest that all three of the artifact mitigation methods can be used effectively for large orthopedic implants in fairly homogenous environments, such as for hip prostheses, while more varied results were observed for artifacts caused by small metal implants in heterogeneous environments, such as dental fillings or spinal fixation rods. Both the O-MAR and MARs algorithms introduced secondary artifacts when applied in the heterogeneous environment of the thorax. The MARs algorithm should be used with caution in certain scenarios, as it was found to underestimate the size of metal implants and introduced new artifacts into imaging planes beyond the metal when applied to dental artifacts. Although GSI virtual monochromatic imaging was not observed to cause any additional artifacts in our phantom studies, it did not offer as much of a benefit as the other two methods for large orthopedic implants.
Acknowledgments
The authors would like to thank John Costales for his generous help with modifying the RPC phantoms for this project, Tamara Locke for her help in preparing this manuscript, and Adam Chandler for his discussions and insight into the GE system. This work was supported by Public Health Service grants CA10953, CA081647, and CA21661 awarded by the National Cancer Institute, United States Department of Health and Human Services, as well as by the National Institutes of Health through MD Anderson's Cancer Center Support Grant NCI P30 CA016672.
References
- Metal Artifact Reduction for Orthopedic Implants (O-MAR) White Paper. Philips Healthcare; 2012. [Google Scholar]
- Barrett JF, Keat N. Artifacts in CT: recognition and avoidance. Radiographics : a review publication of the Radiological Society of North America, Inc. 2004;24:1679–91. doi: 10.1148/rg.246045065. [DOI] [PubMed] [Google Scholar]
- Bazalova M, Beaulieu L, Palefsky S, Verhaegena F. Correction of CT artifacts and its influence on Monte Carlo dose calculations. Med Phys. 2007;34:2119–32. doi: 10.1118/1.2736777. [DOI] [PubMed] [Google Scholar]
- Boas FE, Fleischmann D. Evaluation of Two Iterative Techniques for Reducing Metal Artifacts in Computed Tomography. Radiology. 2011;259:894–902. doi: 10.1148/radiol.11101782. [DOI] [PubMed] [Google Scholar]
- Brook OR, Gourtsoyianni S, Brook A, Mahadevan A, Wilcox C, Raptopoulos V. Spectral CT with metal artifacts reduction software for improvement of tumor visibility in the vicinity of gold fiducial markers. Radiology. 2012;263:696–705. doi: 10.1148/radiol.12111170. [DOI] [PubMed] [Google Scholar]
- Bushberg JT. The essential physics of medical imaging. Philadelphia: Wolters Kluwer Health/Lippincott Williams & Wilkins; 2012. [Google Scholar]
- Chu JC, Ni B, Kriz R, Amod Saxena V. Applications of simulator computed tomography number for photon dose calculations during radiotherapy treatment planning. Radiother Oncol. 2000;55:65–73. doi: 10.1016/s0167-8140(00)00159-6. [DOI] [PubMed] [Google Scholar]
- Followill DS, Evans DR, Cherry C, Molineu A, Fisher G, Hanson WF, Ibbott GS. Design, development, and implementation of the radiological physics center's pelvis and thorax anthropomorphic quality assurance phantoms. Med Phys. 2007;34:2070–6. doi: 10.1118/1.2737158. [DOI] [PubMed] [Google Scholar]
- Glide-Hurst C, Chen D, Zhong H, Chetty IJ. Changes realized from extended bit-depth and metal artifact reduction in CT. Medical Physics. 2013;40:061711. doi: 10.1118/1.4805102. [DOI] [PubMed] [Google Scholar]
- Goodsitt MM, Christodoulou EG, Larson SC. Accuracies of the synthesized monochromatic CT numbers and effective atomic numbers obtained with a rapid kVp switching dual energy CT scanner. Med Phys. 2011;38:2222–32. doi: 10.1118/1.3567509. [DOI] [PubMed] [Google Scholar]
- Hilgers G, Nuver T, Minken A. The CT number accuracy of a novel commercial metal artifact reduction algorithm for large orthopedic implants. J Appl Clin Med Phys. 2014;15:4597. doi: 10.1120/jacmp.v15i1.4597. [DOI] [PMC free article] [PubMed] [Google Scholar]
- Hsieh J. TU-E-210A-01: Dual-Energy CT with Fast-KVp Switch. Medical Physics. 2009;36:2749. [Google Scholar]
- Huang JY, Eklund D, Childress NL, Howell RM, Mirkovic D, Followill DS, Kry SF. Investigation of various energy deposition kernel refinements for the convolutionsuperposition method. Med Phys. 2013;40:121721. doi: 10.1118/1.4831758. [DOI] [PMC free article] [PubMed] [Google Scholar]
- Kilby W, Sage J, Rabett V. Tolerance levels for quality assurance of electron density values generated from CT in radiotherapy treatment planning. Phys Med Biol. 2002;47:1485–92. doi: 10.1088/0031-9155/47/9/304. [DOI] [PubMed] [Google Scholar]
- Lee YH, Park KK, Song HT, Kim S, Suh JS. Metal artefact reduction in gemstone spectral imaging dual-energy CT with and without metal artefact reduction software. European radiology. 2012;22:1331–40. doi: 10.1007/s00330-011-2370-5. [DOI] [PubMed] [Google Scholar]
- Li B, Yadava G, Hsieh J. Quantification of head and body CTDI(VOL) of dual-energy x-ray CT with fast-kVp switching. Med Phys. 2011;38:2595–601. doi: 10.1118/1.3582701. [DOI] [PubMed] [Google Scholar]
- Li H, Noel C, Chen H, Harold Li H, Low D, Moore K, Klahr P, Michalski J, Gay HA, Thorstad W, Mutic S. Clinical evaluation of a commercial orthopedic metal artifact reduction tool for CT simulations in radiation therapy. Med Phys. 2012;39:7507–17. doi: 10.1118/1.4762814. [DOI] [PMC free article] [PubMed] [Google Scholar]
- Mahnken AH, Raupach R, Wildberger JE, Jung B, Heussen N, Flohr TG, Gunther RW, Schaller S. A new algorithm for metal artifact reduction in computed tomography: in vitro and in vivo evaluation after total hip replacement. Investigative radiology. 2003;38:769–75. doi: 10.1097/01.rli.0000086495.96457.54. [DOI] [PubMed] [Google Scholar]
- Papanikolaou N, Battista JJ, Boyer A. AAPM Report No. 85. Tissue inhomogeneity corrections for megavoltage photon beams. Madison, WI: 2004. [Google Scholar]
- Pessis E, Campagna R, Sverzut JM, Bach F, Rodallec M, Guerini H, Feydy A, Drape JL. Virtual monochromatic spectral imaging with fast kilovoltage switching: reduction of metal artifacts at CT. Radiographics : a review publication of the Radiological Society of North America, Inc. 2013;33:573–83. doi: 10.1148/rg.332125124. [DOI] [PubMed] [Google Scholar]
- Prell D, Kyriakou Y, Beister M, Kalender WA. A novel forward projection-based metal artifact reduction method for flat-detector computed tomography. Physics in Medicine and Biology. 2009;54:6575. doi: 10.1088/0031-9155/54/21/009. [DOI] [PubMed] [Google Scholar]
- Reft C, Alecu R, Das IJ, Gerbi BJ, Keall P, Lief E, Mijnheer BJ, Papanikolaou N, Sibata C, Van Dyk J. Dosimetric considerations for patients with HIP prostheses undergoing pelvic irradiation. Report of the AAPM Radiation Therapy Committee Task Group 63. Med Phys. 2003;30:1162–82. doi: 10.1118/1.1565113. [DOI] [PubMed] [Google Scholar]
- Silva AC, Morse BG, Hara AK, Paden RG, Hongo N, Pavlicek W. Dual-energy (spectral) CT: applications in abdominal imaging. Radiographics : a review publication of the Radiological Society of North America, Inc. 2011;31:1031–46. doi: 10.1148/rg.314105159. discussion 47-50. [DOI] [PubMed] [Google Scholar]
- Spadea MF, Verburg JM, Baroni G, Seco J. The impact of low-Z and high-Z metal implants in IMRT: A Monte Carlo study of dose inaccuracies in commercial dose algorithms. Med Phys. 2014;41:011702. doi: 10.1118/1.4829505. [DOI] [PubMed] [Google Scholar]
- Spirydovich S, Papiez L, Langer M, Sandison G, Thai V. High density dental materials and radiotherapy planning: comparison of the dose predictions using superposition algorithm and fluence map Monte Carlo method with radiochromic film measurements. Radiother Oncol. 2006;81:309–14. doi: 10.1016/j.radonc.2006.10.010. [DOI] [PubMed] [Google Scholar]
- Verburg JM, Seco J. CT metal artifact reduction method correcting for beam hardening and missing projections. Physics in Medicine and Biology. 2012;57:2803. doi: 10.1088/0031-9155/57/9/2803. [DOI] [PubMed] [Google Scholar]
- Wang Y, Qian B, Li B, Qin G, Zhou Z, Qiu Y, Sun X, Zhu B. Metal artifacts reduction using monochromatic images from spectral CT: evaluation of pedicle screws in patients with scoliosis. European journal of radiology. 2013;82:e360–6. doi: 10.1016/j.ejrad.2013.02.024. [DOI] [PubMed] [Google Scholar]
- Wei J, Sandison GA, Hsi WC, Ringor M, Lu X. Dosimetric impact of a CT metal artifact suppression algorithm for proton, electron and photon therapies. Phys Med Biol. 2006;51:5183–97. doi: 10.1088/0031-9155/51/20/007. [DOI] [PubMed] [Google Scholar]
- Wieslander E, Knoos T. Dose perturbation in the presence of metallic implants: treatment planning system versus Monte Carlo simulations. Phys Med Biol. 2003;48:3295–305. doi: 10.1088/0031-9155/48/20/003. [DOI] [PubMed] [Google Scholar]
- Yagi M, Ueguchi T, Koizumi M, Ogata T, Yamada S, Takahashi Y, Sumida I, Akino Y, Konishi K, Isohashi F, Tomiyama N, Yoshioka Y, Ogawa K. Gemstone spectral imaging: determination of CT to ED conversion curves for radiotherapy treatment planning. J Appl Clin Med Phys. 2013;14:4335. doi: 10.1120/jacmp.v14i5.4335. [DOI] [PMC free article] [PubMed] [Google Scholar]
- Yu L, Leng S, McCollough CH. Dual-energy CT-based monochromatic imaging. AJR American journal of roentgenology. 2012;199:S9–S15. doi: 10.2214/AJR.12.9121. [DOI] [PubMed] [Google Scholar]
- Zhang D, Li X, Liu B. Objective characterization of GE discovery CT750 HD scanner: gemstone spectral imaging mode. Med Phys. 2011;38:1178–88. doi: 10.1118/1.3551999. [DOI] [PubMed] [Google Scholar]
- Zhao S, Robertson DD, Wang G, Whiting B, Bae KT. X-ray CT metal artifact reduction using wavelets: an application for imaging total hip prostheses. IEEE transactions on medical imaging. 2000;19:1238–47. doi: 10.1109/42.897816. [DOI] [PubMed] [Google Scholar]


