

Abstract
Fast-scan cyclic voltammetry (FSCV) is an electrochemical technique which permits the in vivo measurement of extracellular fluctuations in multiple chemical species. The technique is frequently utilized to sample sub-second (phasic) concentration changes of the neurotransmitter dopamine in awake and behaving rats. Phasic dopamine signaling is implicated in reinforcement, goal-directed behavior, and locomotion and FSCV has been used to investigate how rapid changes in striatal dopamine concentration contribute to these and other behaviors. This unit describes the instrumentation and construction, implantation, and use of necessary components required to sample and analyze dopamine concentration changes in awake rats with FSCV.
Keywords: Fast-scan cyclic voltammetry, dopamine, reward, nucleus accumbens, motivation, reinforcement
INTRODUCTION
The neurotransmitter dopamine plays a central role in the underlying mechanisms governing motivation, reinforcement, and motor behavior, while its pathology is associated with neurological disorders including schizophrenia and Parkinson’s disease. Multiple approaches have been utilized to understand dopamine’s function in these processes. Here, we focus on an analytical tool, fast-scan cyclic voltammetry (FSCV), to measure dopamine concentration in dopamine terminal regions of behaving animals. FSCV measures dopamine concentration in situ and with spatial (micrometer) and temporal (subsecond) resolution that is unparalleled by alternative in vivo techniques used to measure neurochemical transmission such as microdialysis and positron emission tomography (PET) (Watson et al., 2006; Sossi and Ruth, 2005).
Spatial and temporal acuity together with the high chemical sensitivity (nanomolar range) of FSCV makes it particularly well suited for quantification of burst-like (phasic) dopamine release events which are critical for learning (Stuber et al., 2008; Flagel et al., 2011; Schultz, 2013) and goal-directed behavior (Phillips et al., 2003b; Roitman et al., 2004). While the techniques described here are optimized for correlating phasic dopamine release in the nucleus accumbens (NAc) with rat behavior, FSCV can also detect extracellular concentration changes of other analytes including serotonin (Hashemi et al., 2009, 2011), norepinephrine (Baur et al., 1988; Park et al., 2011), adenosine (Swamy and Venton, 2007), oxygen (Venton et al., 2003), histamine (Hashemi et al., 2011), nitric oxide (Iravani et al., 1998), ascorbic acid (Venton et al., 2002) and pH (Runnels et al., 1999). Excellent review papers are available which thoroughly describe how the approach has been used in awake and behaving rats (Stamford, 1990; Phillips et al., 2003a; Robinson et al., 2003). The technique has also been used in other species including Drosophila (Vickrey et al., 2009), lamprey (Ryczko et al., 2013), mice (Parker et al., 2010; Natori et al., 2009; Ehrich et al., 2014), monkeys (Ariansen et al., 2012; Schluter et al., 2014), and humans (Kishida et al., 2011).
Importantly, FSCV permits correlating dopamine fluctuations with an animal’s behavior, a feature that has greatly advanced our understanding of the regulation of dopamine signaling (Garris et al., 1997, 1999; Venton et al., 2006; Owesson-White et al., 2012) and its role in learning (Stuber et al., 2008; Owesson-White et al., 2008; Aragona et al., 2009), goal directed behavior (Garris et al., 1999; Phillips et al., 2003b; Roitman et al., 2004; Cheer et al., 2007) and decision-making (Day et al., 2010; Sugam et al., 2012). The reader is strongly encouraged to review the published works of Dr. R. Mark Wightman and his collaborators from 1995 to present for use of the technique in behaving subjects (Stamford et al., 1984; Kuhr and Wightman, 1986; Wightman et al., 1988; Jones et al., 1996; Garris et al., 1997; Venton et al., 2002; Phillips et al., 2003a; Heien et al., 2004; Keithley et al., 2011). Here, we focus on the use of carbon fiber microelectrodes that are driven acutely (once per recording session) through the brain of awake behaving rats to dopamine terminal regions. Recent work from the laboratory of Dr. Paul Phillips has established a different approach which utilizes a chronic indwelling electrode (Clark et al., 2010) and the reader is encouraged to also review work from this group.
STRATEGIC PLANNING
FSCV is best suited for capturing fast, phasic changes in dopamine concentration because background subtraction must occur temporally close (within ~10–90 s) to the release event. Therefore changes in dopamine concentration over the course of minutes to hours are better suited for a non-differential technique such as microdialysis. In awake and behaving animals, FSCV recordings are most easily obtained soon after the animal recovers (5–10 days) from implantation of a cannula, reference and stimulating electrode (see below for detail). For this reason, experimental design timelines should be carefully planned, especially for behavioral experiments, which require animal training. If possible, animals should be trained to a behavioral criterion before surgical implantation of the cannula and given retraining sessions following recovery. Experimental designs that incorporate a within-session experimental manipulation are ideally suited for FSCV (see (Cone et al., 2014), for example) while experiments that require comparisons within animal but across days present complications. Each placement of the electrode samples from a different set of dopamine release sites (Venton et al., 2003; Dreyer et al., 2010) and thus differences in magnitude of dopamine release across recording locations become difficult to interpret. We acknowledge that in cases where a within-subjects factor cannot be adequately integrated into the experimental design, obtaining data from a large number of animals in the different conditions will make between-subjects comparisons more robust.
BASIC PROTOCOL 1
Fast-Scan Cyclic Voltammetry (FSCV)
FSCV is a powerful technique that allows dopamine concentration to be measured in awake, behaving subjects with high temporal and spatial acuity. The most critical factor in conducting these experiments is fabrication and assessment of the carbon-fiber recording electrodes as measurements are heavily dependent on electrode quality. In addition, a proper understanding of the analysis conventions, particularly interpretation of color plot data, is a vital aspect that will aid with performing experiments, interpreting data and troubleshooting.
Materials
Carbon fiber (7 µm in diameter, Goodfellow Corporation, Oakdale, PA, #C005722)
Thermo/ Barnant vacuum pump (Midland Scientific Inc., Omaha, NE, #BAR 400–3910)
10 cm borosilicate glass capillary tube (4 inches, 0.6 mm OD × 0.4 mm ID; A-M Systems, Carlsborg, WA, #624500)
Vertical microelectrode puller (Narishige Group, Tokyo, Japan, #PE-22)
Light microscope with a graticule in the eyepiece
Microscope slide coated in clear packing tape
Sculpting putty
Scalpel with a #11 surgical blade (Fisher Scientific, Pittsburgh, PA, # 14–840-16)
Gold pins (Newark, Palatine, IL, #SPC15509)
Bare wires (30 gauge, 3 inches, UL1423 type, Squires Electronics, Inc., Cornelius, or, custom)
3M heat shrinkable flexible polyolefin tubing in 3 sizes (3/32” ID, APD, Inc, Ontario, CA, #00–051128–59888-7), (3/64” ID, Digi-Key, Thief River Falls, MN, #KY364C–ND), (3/64” ID, Altex, San Antonio, TX, #HST3/64)
Micromanipulator (University of Illinois at Chicago Research Resources Center, Chicago, IL, custom) (Figure 3A)
Silver print conductive paint (GC Electronics, Rockford, IL, #22–024)
Isopropyl alcohol (Sigma-Aldrich, St Louis, MO, #I9030)
Silver wire (0.5 mm diameter, Sigma-Aldrich, St Louis, MO, #327026-20G)
Devcon 5-minute epoxy (Fisher Scientific, Pittsburgh, PA, #NC9987160)
1 N HCl (Fisher Scientific, Pittsburgh, PA, #SA48-1)
9 V battery with stainless steel or copper wires soldered to the terminals
Twisted stainless steel stimulating electrodes (20 mm, Plastics One, Roanoke, VA, #MS303T/2-B/SPC)
Sprague Dawley Rats (Charles River, Wilmington, MA)
Stainless steel surgical screws (3/16”, Small Parts through Amazon, ASIN #B000FN5XE0)
Surgical drill bit (0.7 mm diameter tip, Fine Science Tools, Foster City, CA, #19008-07)
Guide cannula (BASi, West Lafayette, IN, #MD-2251)
Jet-repair dental acrylic (Lang Dental, Wheeling, IL, #1405)
Flow injection system (University of Illinois at Chicago Research Resources Center, custom)
Polyimide-insulated stainless steel electrode (0.01” diameter, 3” length, tapered tip size 8°, AC resistance 12 M Ohms, A-M Systems, Carlsborg, WA, #571500)
Lesion making device (Ugo Basile, Comerio, Italy, #53500)
Figure 3.

Construction of a manipulator-housed carbon fiber electrode. (A) A piece of capillary glass was loaded with a carbon fiber, pulled to form a taper and tight seal, and the fiber was cut to 50–100 µm before back loading through a micromanipulator. A 0.1 cm piece of shrinkwrap (stopelectrode) prevents the electrode from moving forward through the manipulator. (B) A constructed connecting wire with a 0.1 cm piece of shrinkwrap (stopwire), and a 1 cm piece of shrinkwrap (solidifying cuff) in place. (C) A fully constructed microelectrode with solidifying cuff anchoring the wire to the manipulator.
Hardware:
Multifunction input/output card: PCI-6052E (16 bit, 333 kHz) (National Instruments, Austin, TX).
Potentiostat: EI-400 biopotentiostat (Cypress Systems, Lawrence, KS, #66-El-400) or Custom (FSCV interface with integrated timing circuitry combined with amplifier/current-to-voltage converter headstage (Electronics and Materials Engineering (EME) Shop, Seattle, WA).
Headstage: low-pass-filtered amplifier/current-to-voltage headstage, standard amplification is 200nA/Volt. Up to four channels for FSCV. Various configurations of this headstage allow for recording in small animals (mice, birds, fish) and larger animals such as rats and monkeys (EME Shop, Seattle, WA) (Figure 1B–C).
Commutator: 9 or 25 channel (Crist Instruments, Hagerstown, MD, #4-TBC-9S or 4-TBC-25). A 25 channel commutator with a liquid tube cannula is also available from Crist Instruments for experiments which utilize a fluid line (#4-TBC-9-LT) (Figure 1B–C).
Breakout box interface and power supply: a multifunction piece of equipment which separates digital and analog signals, sets the grounding scheme, reduces environmental noise and filters and divides the applied waveform (custom, Electronics and Materials Engineering (EME) Shop, Seattle, WA) (Figure 1A).
Extra-tall behavioral chamber with TTL output card (DIG-726TTL) to allow for time-stamping animal- and machine-generated events in the voltammetry record (Med Associates Inc., St Albans, VT, custom to accommodate experimental needs). The extra-tall chamber diminishes the probability of artifacts imparted to the recording because of the manipulator housing the electrode knocking into the roof or walls of the chamber (Figure 1C).
Micromanipulator loaded with a carbon fiber electrode: components for constructing electrodes appear in context (Materials and Methods) (Figure 3).
Computer with 2, preferably 3, full height and full length PCI slots.
Figure 1.

Necessary hardware for in vivo awake and behaving FSCV. A. Breakout box interface (middle) with associated power supply (left) and Model 2200 analog stimulus isolator (right). B. 25-channel commutator (above) and custom headstage (below). C. Med-associates behavioral chamber with commutator and headstage.
Hardware for Stimulation:
Digital-to-analog card: PCI-6711 (National Instruments, Austin, TX, #777740-01). This card is used in conjunction with the PCI-6052E (see Hardware) to reduce overlap of stimulation with the data acquisition scans.
Constant-current stimulator: such as Neurolog NL800 (Harvard Apparatus, Holliston, MA, #650276), ISO-flex stimulus isolator (A.M.P.I, Jerusalem, Israel) or Model 2200 analog stimulus isolator (A-M Systems, Sequim, WA, #850000) (Figure 1A).
Software:
Analysis software options include: HDCV (Bucher et al., 2013), TarHeel CV (UNC Electronics Facility, Chapel Hill, NC) or Demon (Yorgason et al., 2011) (Wake Forest Innovations, Winston-Salem, NC) for:
- -
visualization of color plots and current traces
- -
cutting and splicing voltammetry files to TTLs (recorded events)
- -
performance of principal components analysis (chemometrics)
- -
compiling chemometric data files for graphing and statistical analysis
PROTOCOL STEPS
Fabricate a recording electrode for FSCV
Load glass with a single carbon fiber
- Isolate a single carbon fiber, 7 µm in diameter and 10 cm long (length of the glass capillary), against the background of a well illuminated sheet of white paper taped to a flat surface. Tape one end of the fiber to the paper.It is important that a single fiber which is at least 10 cm long (length of glass capillary) is isolated.
Aspirate the fiber through the 10 cm borosilicate glass capillary tube until the fiber extends from both ends.
Cut the fiber so it extends approximately 1 cm from each end of the glass tube.
Pull glass into two halves
-
4
Mark the midpoint of the capillary tube with a permanent marker.
-
5Load the capillary tube into the vertical microelectrode puller with the marked midpoint positioned in the heating element of the puller.Precise positioning inside the heating element will depend on the desired length of the electrode. It is important to note that magnet and heat settings on the electrode puller will have to be optimized to achieve the correct length taper ending in a tight glass seal around the carbon fiber (Figure 2). Our experience has been that the best seals are made without the use of the magnet.
-
6Pull the fiber-loaded capillary tube into two halves and cut the carbon fiber between the two halves with scissors before removing the electrodes from the puller.It is critical to note that not every electrode will be pulled with an acceptable seal. Care should be taken to visually inspect each seal before trimming and using electrodes.
Figure 2.

Carbon fiber recording electrodes with either a short, suboptimal taper (top), or long, ideal taper (bottom). Seals between the end of the glass pipette and protruding carbon fiber are indicated by red arrows. In our experience, the long, gradual taper and tight seal of the bottom electrode make it better suited for FSCV recordings of dopamine. 20 × magnification.
Trim the carbon fiber
-
7Use a scalpel with a #11 surgical blade to cut the carbon fiber extending through the tapered seal to 50–100 µm beyond the seal.To achieve the desired length, electrodes are cut under a light microscope using 10X magnification and a graticule in the eyepiece. To stabilize the electrode for cutting, the microscope slide is covered in clear packing tape and a small amount of sculpting putty is placed at the end of the slide to both stabilize and slightly angle the barrel end of the electrode. In addition to stabilizing the electrode for cutting, coating the microscope slide in packing tape helps to stabilize the scalpel during the cutting process. Only electrodes with a long, gradual taper to a tight seal around the carbon fiber should be cut (Figure 2).
Make a connecting wire
-
8
Solder a small gold pin to the end of a 7.6 cm wire.
-
9
Slide the blue insulation of the wire along the wire until it is flush with the gold pin.
-
10
Cover the pin-wire connection with a 1 cm piece of 3M heat shrinkable flexible polyolefin tubing (3/32” ID).
-
11
Apply a 0.1 cm piece of shrinkwrap tubing (3/64” ID) to the junction between the blue insulation and the bare wire to serve as a stop (stopwire).
-
12Thread a 1 cm piece of larger shrinkwrap tubing (3/64” ID) up the wire, over the stopwire and to the end closest to the pin (Figure 3).This larger piece of shrinkwrap tubing serves to solidify the connection between the wire, glass capillary and micromanipulator (solidifying cuff; as described below).
Load a micromanipulator
-
13
Backload an electrode into the micromanipulator and secure in place with a 0.1 cm piece of shrinkwrap (3/64” ID) attached to the very back end of the glass capillary where it emerges from the screw stock of the manipulator (stopelectrode; Figure 3A).
-
14Coat the exposed portion of the connecting wire with a layer of silver print conductive paint and threaded through the lumen of the capillary until the stopwire and stopelectrode shrinkwrap pieces make contact.Take care to ensure the wire is no longer than the length of the glass electrode before the taper and cut if necessary.
-
15
Slightly rotate the wire while inserting it to ensure a connection between the wire and the carbon fiber.
-
16
Place the solidifying cuff over the stopwire, stopelectrode and 1–2 mm of the micromanipulator screwstock and heat to solidify the assembly (Figure 3).
-
17
Clean the electrode tip by lowering it into purified and filtered isopropyl alcohol for 10–20 minutes before use.
-
18Inspect the recording electrode before use under 10X magnification.It is important to confirm the integrity of the glass seal, the absence of cracks or other abnormalities, and that the carbon fiber makes contact with the wire in the lumen of the glass capillary tube.
Fabricate a Ag/AgCl reference electrode
-
19
Insert a 1 cm piece of silver wire (0.5 mm diameter) into the socket of a gold connector pin
-
20
Apply a 5-minute epoxy to the junction between the pin and the wire.
-
21Chlorinate the silver reference electrode by electroplating in 1 N HCl.Reference electrodes should be chlorinated immediately before anesthetizing an animal for surgery. To chlorinate, connect the positive terminal of a 9 V battery to the gold pin of the reference electrode while the negative terminal is soldered to a wire (stainless steel or copper). Submerge both the negative terminal wire and silver wire of the reference electrode in 1 N HCl for approximately 30 seconds. During plating, the acid surrounding the wire and the reference electrode should bubble and plating should be visible on the surface of the silver wire. Do not submerge the gold pin of the reference electrode. Allow the HCl to dry before implanting the reference electrode into the brain of the animal.
Shape a stimulating electrode
-
22
Bend stimulating electrode wires at a 90 degree angle from the base of the pedestal and again at a 90 degree angle about 5 mm down the wire from the first bend.
-
23
Separate the twisted wires of the stimulating electrode approximately 1 mm and cut them to equal lengths (Figure 4).
Figure 4.

A shaped stimulating electrode. Note the 90 degree angle of the twisted stainless steel wires and the 1 mm terminal separation of the wires (1.25 × magnification).
Perform surgery
-
24
Anesthetize laboratory rat with intraperitoneal ketamine (100mg/kg)/ xylazine (10mg/kg).
-
25
Shave the scalp and fix the head in a stereotaxic frame.
-
26
Clean the scalp with betadine and ethanol.
-
27
Make a 15 mm longitudinal incision along the midline of the scalp.
-
28
Clear underlying fascia with a scalpel and gauze.
-
29
Retract the skin to expose a 15 mm (longitudinal)×10 mm (lateral) area of skull
-
30
Secure four stainless steel surgical screws (3/16”; Figure 5) to the skull.
-
31Drill holes over the desired targets (e.g. NAc for guide cannula; ventral tegmental area (VTA) for stimulating electrode) according to stereotaxic coordinates (Figure 5).The hole for the stimulating electrode must be at least 1 mm in diameter to accommodate the electrode.
-
32
Lower a guide cannula (see Materials as micromanipulators are designed to mate with this specific cannula; cut to 2.5 mm below the pedestal) over the dopamine terminal region of interest.
-
33
Place the reference electrode in the contralateral cortex.
-
34Use dental acrylic to cement the reference electrode and guide cannula in place (Figure 5).If rats will be implanted with a stimulating electrode, care must be taken to avoid cementing over the drilled hole over the VTA or the area behind it where the stimulating electrode pedestal will be placed.
-
35
If a stimulating electrode will be implanted, clear dura mater from the surface of the brain.
-
36If applicable, lower the stimulating electrode and cement it in place.Prior to lowering, the stimulating electrode may need to be adjusted so that the stimulating prongs are straight in the anterior/posterior and medial/lateral planes. To optimize stimulating electrode placement, the stimulating electrode should first be lowered 7 mm into the brain. At this time, a recording electrode can be lowered through the guide cannula and to the level of the NAc and FSCV performed while the VTA is stimulated (e.g. 150 µA, 4 ms monophasic current pulses; 60 pulses delivered at 60 Hz). FSCV software can be used in conjunction with stimulus isolators (e.g. Iso-Flex system from A.M.P.I., see Hardware). The stimulating electrode should be lowered in 0.2 mm increments until robust dopamine release is detected at the recording electrode and then cemented in place. In our experiences, this depth is approximately 8.3 mm ventral to brain surface. If a dopamine terminal region other than the NAc is being targeted then the position of the stimulating electrode may need to be altered; for example, targeting substantia nigra or medial forebrain bundle might be preferable.
Figure 5.

Dorsal surface of a rat skull with sutures emphasized for illustration of a surgical preparation. Closed circles indicate placement of drill holes for a reference electrode (black) and voltammetry cannula (red). The open red circle indicates placement of a larger hole for the stimulating electrode. Associated coordinates for a voltammetry cannula and stimulating electrode are listed (AP=anterior/posterior, ML=medial/lateral, relative to Bregma; DV=dorsal/ventral, relative to the brain surface, *= refer to “Surgically implanting animals for FSCV” section for details regarding dorsal/ventral depth). A reference electrode hole is drilled on the skull over the contralateral forebrain. Four screws are secured in the locations indicated by a black X.
Collect FSCV data from awake and behaving animals
Setup
-
37Position the carbon electrode tip flush with the end of the micromanipulator and retract three complete clockwise turns such that the tip of the carbon fiber electrode is recessed into the lumen of the micromanipulator.This serves to protect the tip of the electrode during mating with the cannula and also helps track the depth of electrode as it courses through the brain. Each counterclockwise full turn of the manipulator advances the electrode 0.33 mm.
-
38
Remove the BASi cannula obturator from the animal.
-
39
Tether the animal to the FSCV headstage via the implanted stimulating electrode and its corresponding cable that is part of the headstage assembly.
-
40
Insert the micromanipulator into the BASi cannula and lock it in place via a locking ring that is part of the guide cannula.
-
41
Connect both gold pins [mated to: 1) the Ag/AgCL reference electrode; and 2) the carbon fiber electrode] to their corresponding pins on the headstage.
-
42
Apply the “triangular” voltage waveform (referred to simply as triangular waveform) (See “Set FSCV Parameters” below) before power is delivered to the system.
Lower the carbon fiber electrode
-
43Lower the electrode into the brain region of interest.Targeting the NAc requires approximately 45 counter-clockwise turns of the manipulator (3 turns to account for the recession of the electrode tip up the manipulator barrel, 25 turns to reach the bottom of the voltammetry guide cannula, and approximately 17 turns more to ultimately reach the NAc). The oscilloscope (part of the Tarheel CV software suite; see below) should be monitored for changes in background current with every manipulator turn, as a break in the electrode while lowering is evident by a sudden change in the shape or complete disappearance of the background. Usually the background current will grow in size before collapsing when resistance is met in the brain that causes the glass to break (Figure 6).
-
44Secure the micromanipulator lock and allow the animal to move throughout the behavioral chamber.Typically, 30 minutes is allowed for behavioral habituation and electrode conditioning (“scanning”, see below).
Figure 6.
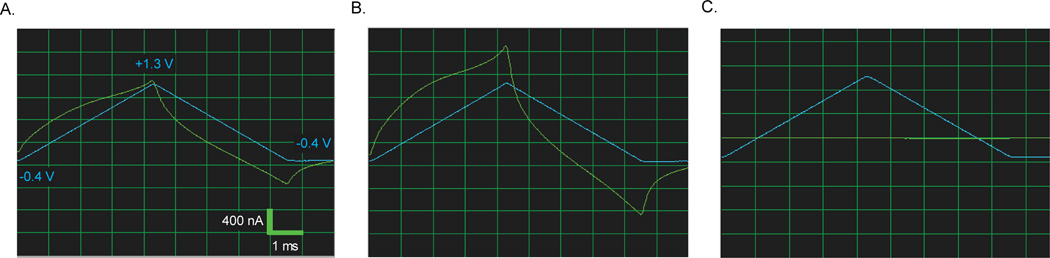
Background current produced by application of a triangular voltage waveform (blue line) as an electrode that breaks as it is lowered into the brain. (A) Background current (green trace) from a compromised electrode. Note the shape of the background current and the lack of an inflection in current during the anodic scan. (B) As this electrode was advanced through the brain, the background quickly increased before it was lost (C) due to a break of the carbon fiber at the level of the seal.
Set FSCV Parameters
-
45
To measure dopamine, hold the carbon fiber electrode at −0.4 V relative to the Ag/AgCl electrode. Set the software to change the voltage at a rate of 400 V/s to +1.3 V and back to −0.4 V in a triangular waveform fashion (scan). Thus, the duration of each full scan is 8.5 ms.
Scan the electrode
-
46Repeatedly apply the triangular waveform for 20 minutes at a rate of 60 Hz.Adequate scan time before beginning an experiment helps reduce background current drift that occurs with fresh carbon fiber electrodes. The rapid scan frequency increases the rate at which the electrode, and hence the background current, equilibrates to the local environment. As analysis for dopamine requires background subtraction, a stable background current is critical. Scan applications also etch the surface of the carbon fiber electrode to increase the adsorption of dopamine on the surface of the electrode (Heien et al., 2003). The electrode background should increase in size and take on a characteristic shape on the oscilloscope (Figure 7).
-
47
Lower the frequency to 10 Hz for at least an additional 10 minutes before conducting experiments and recording at 10 Hz.
Figure 7.

Background current produced by application of a triangular voltage waveform (blue line) as a carbon fiber electrode “scans” in the brain. Immediately after insertion into the brain, electrodes produce a background current (A) that gradually increases in size as the waveform is repeatedly applied (60 Hz) for 20 minutes. It should be noted that electrodes with good integrity normally display a background current where the time between the first peak on the anodic scan to the peak at the switching potential is 3 ms. (B) As the electrode equilibrates, the background potential increases. Switching the scanning frequency to 10 Hz (C) results in slight but stable changes in the shape of the background.
Apply stimulation
-
48
Set the frequency and duration of stimulation pulses using software (e.g. TarHeel CV).
-
49Set the amplitude of current pulses using a stimulus isolator (e.g. ISO-Flex, A.M.P.I, see Hardware).By implanting a stimulating electrode in the VTA, the delivery of current pulses to the dopamine cell bodies can act as a positive control for the detection of dopamine (Roitman et al., 2004) or can be used as a platform on which to examine the modulation of dopamine (Cone et al., 2013; Daberkow et al., 2013; Siciliano et al., 2014).
Synchronize FSCV with behavior
-
50Turn on TTL pulses in FSCV software.Commercially available hardware and software for conducting behavioral experiments using animal subjects (e.g. MedAssociates, Inc.) are designed to communicate with other systems using TTL pulses. FSCV software packages mentioned above capture TTL pulses and thus dopamine concentration changes relative to discrete behavioral events can be analyzed.
Calibrate the FSCV recording electrode
-
51Calibrate the FSCV recording electrode to assess the electrode’s sensitivity to dopamine (see Sinkala et al. 2012 for details).Dopamine fluctuations are recorded in current (nA). To convert fluctuations in the dopamine-evoked current to dopamine concentration, each electrode should be calibrated in a known concentration of dopamine using a flow injection system. Sinkala et al. 2012 describe a flow injection system that is gravity fed and uses laminar flow to briefly expose an electrode to a known concentration of dopamine. Electrode sensitivity can vary as a function of brain tissue exposure (Logman et al., 2000) and length of exposed carbon fiber. While current as a function of concentration tends to be linear (Sinkala et al., 2012), for conservative calibrations, multiple concentrations of dopamine should be used.
Mark the carbon fiber placement
-
52
Backload a polyimide-insulated stainless steel electrode into a micromanipulator.
-
53
Advance the electrode to the same depth in the brain as the carbon fiber electrode during data collection.
-
54
Make an electrolytic lesion with a lesion making device.
-
55Remove the brain and process the tissue for the presence of a lesion using light microscopy.Slight differences in electrode placement in either the medial-lateral or dorsal-ventral planes can lead to the sampling of dopamine from functionally and/or histochemically different subterritories. As behaviorally-relevant changes in dopamine concentration have been found to be regionally selective (Aragona et al., 2009; Brown et al., 2011; Wheeler et al., 2011; Willuhn et al., 2012), it is important to identify the recording location. One approach is to pass current through the carbon fiber to create a small lesion which can be verified histologically (see Garris et al., 1994 or Park et al., 2009 for example). However, this destroys the electrode and does not permit an opportunity to calibrate the electrode after use. The alternative method is described above.
Data Analysis
A variety of software programs are freely available for analysis of electrochemical data, including High Definition Cyclic Voltammetry (HDCV; University of North Carolina, Chapel Hill, NC) and Demon Voltammetry and Analysis Software (Demon; Wake Forest University, Winston-Salem, NC). Given that the use of HDCV and Demon are described in detail in previous publications ((Bucher et al., 2013; Yorgason et al., 2011), respectively), we will refrain from listing step-by-step instructions for analysis that depend on the specific software platform used by the experimenter.
Identifying dopamine release
Following background subtraction, changes in current over time at all applied scanning potentials are visually represented as a color plot (Figure 9A). To determine if dopamine is present at a given time, current by voltage plots (background subtracted cyclic voltammograms; CVs) can be constructed and examined. Figure 9 illustrates an example of stimulation applied to the dopamine cell bodies via a chronically implanted stimulating electrode. The current as a function of recording electrode voltage during the stimulation is plotted in Figure 9B. Prominent peaks at ~ 0.6 V (0.645 V) on the anodic scan and ~-0.2 V (−20.267 V) on the cathodic scan are indicative of dopamine. As the magnitude of oxidative current is directly proportional to dopamine concentration, the current at 0.645 V across time is plotted to determine the timecourse of changes in extracellular dopamine (Figure 9C). Current changes are converted into concentration after data collection by calibrating the electrode in a flow injection system (see Electrode Calibration, above) to determine the calibration factor (nA of current per nM of dopamine). This calibration factor can be used to calculate the concentration of a single dopamine release event or to statistically identify current changes that result from dopamine fluctuations (see Chemometric Analysis below).
Figure 9.

Visualization, confirmation and quantification of currents resulting from an electrically stimulated dopamine release event (at “STIM”). (A) A background subtracted color plot depicts changes in current (color) at a range of applied potentials (y- axis) over time (x-axis). As FSCV is a differential technique, background current, measured at approximately 1 second before the time of the peak current (white dashed line), is subtracted from all applied potentials. To confirm that the current changes observed are from the oxidation and reduction of dopamine, a cyclic voltammogram (CV) (B) is generated by plotting the changes in background-subtracted current as a function of applied potential (red dashed line). The resulting CV is characteristic of dopamine, with a peak oxidation potential of 0.645 V (blue arrow in A and B). (C) To quantify the changes in dopamine resulting from electrical stimulation, current at the peak oxidation potential of dopamine is plotted over time (blue dashed line in A). In this example, electrical stimulation of the VTA evokes a 10.3 nA spike in current.
Chemometric Analysis
The calibration factor along with example CVs (for example, obtained from electrical stimulation of the VTA) are used as inputs for chemometric analysis, which extracts dopamine concentration from the multivariate FSCV data obtained during awake and behaving experiments. Dopamine concentration can be extracted from electrochemical data using either principal component or partial least squares regressions (Heien et al., 2004; Faber and Rajkó, 2007; Hermans et al., 2008; Keithley et al., 2009, 2011). Both HDCV and Demon software have chemometric analysis features built in for extraction of dopamine concentration.
COMMENTARY
Background Information
FSCV involves the rapid application of a voltage ramp to an electrode which induces the oxidation and reduction of chemical species at the surface of the electrode that are electroactive within this voltage range. Electron transfer between the electrode surface and the analyte of interest is detected as current. Most studies using FSCV for the detection of dopamine make use of carbon fiber microelectrodes, although other surfaces and surface coatings have been used (Pihel et al., 1996; Singh et al., 2011; Tsai et al., 2012; Arumugam et al., 2013; Patel et al., 2013). The major advantage of FSCV, given that a range of voltages are applied to the electrode, is that these redox currents occur at unique potentials for each electrochemical species, thus allowing for multiple species to be detected and discriminated simultaneously (Heien et al., 2004; Keithley et al., 2009; Keithley and Wightman, 2011; Hashemi et al., 2011).
While other parameters have been used and ongoing work continues to focus on optimizing measurements (Kile et al., 2012; Keithley et al., 2011), here, and specifically for measuring dopamine in awake and behaving rodents, a nonoxidizing “holding potential” of −0.4 V, relative to an Ag/AgCl reference electrode is applied to the carbon fiber. The potential is then ramped up to +1.3 V (anodic scan) and back down to −0.4 V (cathodic scan) at a rate of 400 V/s. This triangular waveform of applied voltage can be repeated frequently. In practice, FSCV for dopamine detection in awake and behaving subjects employs a waveform application frequency of 10 Hz. Each application of the triangular waveform produces a large non-faradaic background current that is detected at the carbon fiber electrode. In addition, electrochemically active species will oxidize and reduce at known potentials along the scan. Dopamine oxidizes to dopamine-ortho-quinone with the oxidation peak occurring at ~0.65 V during the anodic scan and reduces from dopamine ortho-quinone back to dopamine with the peak reduction occurring at ~-0.2 V during the cathodic scan.
When two electrons from the hydroxyl group of the catechol are shed and gained back, a faradaic current is produced which is added to the background current of the electrode at the potentials mentioned above. The stable background current on the electrode is typically 2–3 orders of magnitude greater than the current produced by dopamine detection. However, the background current is also stable from scan to scan and can therefore be subtracted out to leave only current changes over time. Using background subtraction, an increase in current at ~0.65 V and a decrease at ~-0.2 V, is indicative of dopamine present at the electrode surface. Plotting current as a function of applied voltage generates a background subtracted cyclic voltammogram (CV), which is used to identify an analyte, as the characteristic redox potentials are unique for different neurotransmitters and ‘interfering’ substances (e.g. changes in pH, ascorbic acid, and neurotransmitter metabolites (Smeets and González, 2000; Robinson et al., 2003; Heien et al., 2004)). As the focus of this manuscript is on the detection of dopamine in behaving rodents, it should be noted that one confound is that CVs for dopamine and norepinepherine are indistinguishable. Thus, additional steps must be taken to dissociate changes in the two neurotransmitters if measurements are made in regions with substantial dopamine and norepinephrine inputs.
For a given release event, the current generated at the peak oxidation potential for dopamine is directly proportional to the concentration of dopamine at the sampling region of the electrode (Heien et al., 2004; Day et al., 2007; Anstrom et al., 2009; Jones et al., 2010). Analyzing the time course of current changes at the peak oxidation potential of dopamine can be used to understand the temporal dynamics of signaling during behavior or following experimenter-evoked release. The peak current resulting from a given release event is dependent on both the amount of dopamine released as well as the sources that contribute to signal decay, such as reuptake by the dopamine transporter, diffusion, and breakdown by monoamine oxidase (MAO) or catechol-O-methyltransferase (COMT). The dynamics of dopamine release are easily visualized as a color plot, which displays current coded as color over time at all scanning potentials of the electrode (see Figure 9 for example). Electrodes should be calibrated before or after use in vivo to convert current measured during an experiment into concentration of dopamine (Sinkala et al., 2012); although some recent work suggests this conversion can be approximated from the magnitude of the electrode’s non-faradaic background current (Roberts et al., 2013). Calibration is typically performed in a flow injection system where the electrode is bathed with buffer and a known concentration of dopamine (100–1000 nM) is briefly introduced. Following electrode calibration, principal component analysis (PCA) can be used to extract dopamine concentration from the electrochemical data (Heien et al., 2004; Keithley et al., 2009).
CRITICAL PARAMETERS AND TROUBLESHOOTING
Surgery
Voltammetry cannula are lowered with the obdurator (dummy stylet) in place. The cannula and the obdurator fit together with a notch and are secured into place with an omega-ring. It is critical that the notch and omega-ring stay clear of dental cement during surgery, as separation of the obdurator from the voltammetry cannula would otherwise be impossible. In addition, if cement were to obstruct part of the notch, the manipulator would not fully insert into the cannula and lock into place with the omega ring. In general, use caution when applying cement around the voltammetry cannula.
Many experiments utilizing FSCV require a positive control to demonstrate detection of dopamine at the recording electrode. For this and other reasons, often a stimulating electrode is implanted at the site of the dopamine cell bodies. Twisted stainless steel stimulating electrodes must be modified in order to maximize the space between the voltammetry cannula and the stimulating electrode. This is done so that the stimulator plug on the voltammetry headstage does not interfere with the ability to insert a manipulator into the voltammetry cannula.
FSCV in awake subjects requires multiple implants to be cemented together (headcap). Headcaps can be crowded, and for this reason, placement of headcap components should be planned ahead of surgery. The most common space constraint involves the stimulating electrode, as the headstage mount attaches to the stimulating electrode and is bulky. The stimulating electrode must therefore be constructed and oriented such that the mount is free from other cannula when the stimulating electrode is in place. It is helpful to confirm adequate space and orientation before surgery begins. Confirm that the separated prongs of the stimulating electrode are straight in a medial/lateral plane and the 90 degree bend extends posteriorly. The headstage mount should plug in behind the site where the stimulating electrode is lowered into the brain. It is common to have to adjust the stimulating electrode in order to have the pedestal of the stimulating electrode in a position where it is free from other hardware. If the 90 degree bend of the stimulating electrode is anteriorly oriented (towards the voltammetry cannula) it can be impossible to plug a manipulator into the voltammetry cannula once the headstage is connected. If the manipulator and headstage touch, unnecessary mechanical noise will be introduced into the recordings. Screw placement is also critical such that they do not prohibit the lowering of the stimulating electrode to the appropriate depth or interfere with placement of the voltammetry cannula.
Electrode Construction
Recording electrodes are handmade through a multistep process. It is imperative that electrodes are hand selected to meet criteria (outlined in Methods) and are otherwise discarded. We estimate that only 30% of pulled electrodes are ever lowered into an animal due to poor tapers, seals, length of cut carbon fibers, poor electrical contact between the carbon fiber and connecting wire, or breakage during fabrication. At each step of construction, electrodes should be assessed for quality. Once an electrode is in the brain, its background current, as monitored on an oscilloscope, is the best way to quickly assess the quality of an electrode and to replace those which are unlikely to yield good recordings. If recordings are confounded with artifacts, often times it is due to poor electrode quality. As it is common to have to switch electrodes, multiple electrodes should be prepared ahead of time to do so.
If an electrode breaks while in the animal’s brain, the electrode should be raised and all glass should be removed if possible. An obdurator or lesioning electrode can be used clear the electrode path from any microscopic residual glass. While less likely to be successful, it is possible to lower a second electrode through the track of a broken one. Electrode breaks in vivo should rarely happen if electrodes are properly constructed and experiments occur within 10 days of surgery.
Shifting applied potential
Due to changes in the reference electrode that occur after extended time in the brain, it may be necessary to shift the applied waveform by 0.2 V across all voltages. This situation is determined by monitoring the shape of the background current. On the anodic scan of an equilibrated electrode, there should be 3 ms between the first peak and the peak that occurs at the switching potential observed in the background current (Figure 7B and C for example). If there is less than 3 ms, as in Figure 8A, then the entire triangular waveform should be shifted by +0.2 V ((−0.2 V to +1.5V to −0.2 V; Figure 8B).
Figure 8.

A “flattened” background current is observed if it is necessary to shift the applied voltage ramp. Electrode background currents that require shifting of the reference electrode have flattened background currents resulting from the anodic scan (A). Shifting the reference electrode by +0.2 V restores the characteristic shape of the anodic background current and increases the temporal difference between the peak of the background waveform and the point at which the background current crosses the applied waveform triangle (B).
Noise reduction
Mechanical and electrical noise are two frequently encountered issues during FSCV recordings. Attempts to reduce noise include the use of a Faraday cage, proper grounding techniques, use of shielded power cables, and insulation of pins and wires on the headstage. Headstage pins should be replaced regularly in order to ensure tight electrical connections between the headstage and electrode. Care should be taken to ensure that the wire and carbon fiber are sealed together with Silverprint paint in the barrel of the glass electrode before a recording begins. The micromanipulator lock should be checked to ensure tightness. As most noise arises from a compromised or subpar electrode, replacing it with a fresh one is a good initial troubleshooting step when encountering mechanical noise.
ANTICIPATED RESULTS
Dopamine will oxidize and reduce at characteristic potentials along the triangular waveform voltage scan (see Figure 9 for example; ~0.65 V for oxidation and ~-0.27 V for reduction). Oxidation of dopamine can be verified using colorplots and CVs centered on the time point of interest. An example CV for dopamine is shown in Figure 9B. Note the large peak in current at 0.647 V. Monitoring this potential over time (blue arrow and blue dashed horizontal line in Figure 9A), current evoked by stimulation of dopamine cell bodies can be seen to increase rapidly before decaying at an exponential rate (note; the decay is governed mostly by dopamine reuptake via the dopamine transporter). Dopamine release events also occur independent of electrical stimulation to the dopamine cell bodies. That is, they occur spontaneously or are evoked by behaviorally-relevant stimuli. In general, these release events appear similar in shape and duration to electrically-evoked dopamine release but differ greatly in magnitude. Spontaneous or behaviorally-evoked dopamine release events measure approximately 0.5-1.5 nA, while electrically-evoked release via VTA stimulation with 120 µA (60 pulses at 60 Hz) can elicit anywhere from 1–50 nA (Figure 9C). These figures can vary widely across animals, as the magnitude of release is dependent on numerous factors including placement of the stimulating electrode, number of release sites that the electrode is capable of detecting, density of dopamine transporters in the vicinity of the electrode, as well as the characteristics of the recording electrode. Another important consideration is that kinetics of dopamine reuptake may differ across striatal subregions due to distribution of the dopamine transporter (Richfield, 1991; Ciliax et al., 1995; Wu et al., 2001; Brown et al., 2011). Decreases in current below baseline following dopamine release, especially after stimulated release, are most likely attributed to shifts in pH. A characteristic CV for a pH signal can be used to identify a pH shift (Takmakov et al., 2010) and chemometrics can be used to separate these signals from dopamine signals.
TIME CONSIDERATIONS
Constructing the necessary electrodes (recording, reference and stimulating) to conduct a FSCV experiment in a cohort of 4 awake and behaving rats takes approximately 2 hours. Recording electrodes should be made in excess, as they often need to be replaced for various reasons (see Critical Parameters and Troubleshooting). Allot six hours to surgically implant a cohort of 4 rats. Less time will be needed if rats do not require a stimulating electrode. Data collection time varies with experiment and can take anywhere between 45 minutes and 4 hours for each rat. We estimate that data analysis, including electrode calibration, for each animal takes approximately 2 hours.
ACKNOWLEDGEMENTS
The authors acknowledge financial support from DA025634.
LITERATURE CITED
- Anstrom KK, Miczek KA, Budygin EA. Increased phasic dopamine signaling in the mesolimbic pathway during social defeat in rats. Neuroscience. 2009;161:3–12. doi: 10.1016/j.neuroscience.2009.03.023. [DOI] [PMC free article] [PubMed] [Google Scholar]
- Aragona BJ, Day JJ, Roitman MF, Cleaveland NA, Wightman RM, Carelli RM. Regional specificity in the real-time development of phasic dopamine transmission patterns during acquisition of a cue-cocaine association in rats. The European journal of neuroscience. 2009;30:1889–1899. doi: 10.1111/j.1460-9568.2009.07027.x. [DOI] [PMC free article] [PubMed] [Google Scholar]
- Ariansen JL, Heien MLAV, Hermans A, Phillips PEM, Hernadi I, Bermudez MA, Schultz W, Wightman RM. Monitoring extracellular pH, oxygen, and dopamine during reward delivery in the striatum of primates. Frontiers in behavioral neuroscience. 2012;6:36. doi: 10.3389/fnbeh.2012.00036. [DOI] [PMC free article] [PubMed] [Google Scholar]
- Arumugam PU, Zeng H, Siddiqui S, Covey DP, Carlisle JA, Garris PA. Characterization of ultrananocrystalline diamond microsensors for in vivo dopamine detection. Applied physics letters. 2013;102:253107. doi: 10.1063/1.4811785. [DOI] [PMC free article] [PubMed] [Google Scholar]
- Baur JE, Kristensen EW, May LJ, Wiedemann DJ, Wightman RM. Fast-scan voltammetry of biogenic amines. Analytical Chemistry. 1988;60:1268–1272. doi: 10.1021/ac00164a006. [DOI] [PubMed] [Google Scholar]
- Brown HD, McCutcheon JE, Cone JJ, Ragozzino ME, Roitman MF. Primary food reward and reward-predictive stimuli evoke different patterns of phasic dopamine signaling throughout the striatum. The European journal of neuroscience. 2011;34:1997–2006. doi: 10.1111/j.1460-9568.2011.07914.x. [DOI] [PMC free article] [PubMed] [Google Scholar]
- Bucher ES, Brooks K, Verber MD, Keithley RB, Owesson-White C, Carroll S, Takmakov P, McKinney CJ, Wightman RM. Flexible software platform for fast-scan cyclic voltammetry data acquisition and analysis. Analytical chemistry. 2013;85:10344–10353. doi: 10.1021/ac402263x. [DOI] [PMC free article] [PubMed] [Google Scholar]
- Cheer JF, Aragona BJ, Heien MLAV, Seipel AT, Carelli RM, Wightman RM. Coordinated accumbal dopamine release and neural activity drive goal-directed behavior. Neuron. 2007;54:237–244. doi: 10.1016/j.neuron.2007.03.021. [DOI] [PubMed] [Google Scholar]
- Ciliax BJ, Heilman C, Demchyshyn LL, Pristupa ZB, Ince E, Hersch SM, Niznik HB, Levey AI. The dopamine transporter: immunochemical characterization and localization in brain. The Journal of neuroscience?: the official journal of the Society for Neuroscience. 1995;15:1714–1723. doi: 10.1523/JNEUROSCI.15-03-01714.1995. [DOI] [PMC free article] [PubMed] [Google Scholar]
- Clark JJ, Sandberg SG, Wanat MJ, Gan JO, Horne EA, Hart AS, Akers CA, Parker JG, Willuhn I, Martinez V, et al. Chronic microsensors for longitudinal, subsecond dopamine detection in behaving animals. Nature methods. 2010;7:126–129. doi: 10.1038/nmeth.1412. [DOI] [PMC free article] [PubMed] [Google Scholar]
- Cone JJ, Chartoff EH, Potter DN, Ebner SR, Roitman MF. Prolonged high fat diet reduces dopamine reuptake without altering DAT gene expression. PloS one. 2013;8:e58251. doi: 10.1371/journal.pone.0058251. [DOI] [PMC free article] [PubMed] [Google Scholar]
- Cone JJ, McCutcheon JE, Roitman MF. Ghrelin acts as an interface between physiological state and phasic dopamine signaling. The Journal of neuroscience?: the official journal of the Society for Neuroscience. 2014;34:4905–4913. doi: 10.1523/JNEUROSCI.4404-13.2014. [DOI] [PMC free article] [PubMed] [Google Scholar]
- Daberkow DP, Brown HD, Bunner KD, Kraniotis SA, Doellman MA, Ragozzino ME, Garris PA, Roitman MF. Amphetamine paradoxically augments exocytotic dopamine release and phasic dopamine signals. The Journal of neuroscience. 2013;33:452–463. doi: 10.1523/JNEUROSCI.2136-12.2013. [DOI] [PMC free article] [PubMed] [Google Scholar]
- Day JJ, Jones JL, Wightman RM, Carelli RM. Phasic nucleus accumbens dopamine release encodes effort- and delay-related costs. Biological psychiatry. 2010;68:306–309. doi: 10.1016/j.biopsych.2010.03.026. [DOI] [PMC free article] [PubMed] [Google Scholar]
- Day JJ, Roitman MF, Wightman RM, Carelli RM. Associative learning mediates dynamic shifts in dopamine signaling in the nucleus accumbens. Nature neuroscience. 2007;10:1020–1028. doi: 10.1038/nn1923. [DOI] [PubMed] [Google Scholar]
- Dreyer JK, Herrik KF, Berg RW, Hounsgaard JD. Influence of phasic and tonic dopamine release on receptor activation. The Journal of neuroscience?: the official journal of the Society for Neuroscience. 2010;30:14273–14283. doi: 10.1523/JNEUROSCI.1894-10.2010. [DOI] [PMC free article] [PubMed] [Google Scholar]
- Ehrich JM, Phillips PE, Chavkin C. Kappa Opioid Receptor Activation Potentiates the Cocaine-Induced Increase in Evoked Dopamine Release Recorded in vivo in the Mouse Nucleus Accumbens. Neuropsychopharmacology. 2014 doi: 10.1038/npp.2014.157. [DOI] [PMC free article] [PubMed] [Google Scholar]
- Faber NM, Rajkó R. How to avoid over-fitting in multivariate calibration-The conventional validation approach and an alternative. Analytica Chimica Acta. 2007;595:98–106. doi: 10.1016/j.aca.2007.05.030. [DOI] [PubMed] [Google Scholar]
- Flagel SB, Clark JJ, Robinson TE, Mayo L, Czuj A, Willuhn I, Akers CA, Clinton SM, Phillips PEM, Akil H. A selective role for dopamine in stimulus-reward learning. Nature. 2011;469:53–57. doi: 10.1038/nature09588. [DOI] [PMC free article] [PubMed] [Google Scholar]
- Garris PA, Christensen JR, Rebec GV, Wightman RM. Real-time measurement of electrically evoked extracellular dopamine in the striatum of freely moving rats. Journal of neurochemistry. 1997;68:152–161. doi: 10.1046/j.1471-4159.1997.68010152.x. [DOI] [PubMed] [Google Scholar]
- Garris PA, Ciolkowski EL, Pastore P, Wightman RM. Efflux of dopamine from the synaptic cleft in the nucleus accumbens of the rat brain. The Journal of neuroscience?: the official journal of the Society for Neuroscience. 1994;14:6084–6093. doi: 10.1523/JNEUROSCI.14-10-06084.1994. [DOI] [PMC free article] [PubMed] [Google Scholar]
- Garris PA, Kilpatrick M, Bunin MA, Michael D, Walker QD, Wightman RM. Dissociation of dopamine release in the nucleus accumbens from intracranial self-stimulation. Nature. 1999;398:67–69. doi: 10.1038/18019. [DOI] [PubMed] [Google Scholar]
- Hashemi P, Dankoski EC, Petrovic J, Keithley RB, Wightman RM. Voltammetric detection of 5-hydroxytryptamine release in the rat brain. Analytical chemistry. 2009;81:9462–9471. doi: 10.1021/ac9018846. [DOI] [PMC free article] [PubMed] [Google Scholar]
- Hashemi P, Dankoski EC, Wood KM, Ambrose RE, Wightman RM. In vivo electrochemical evidence for simultaneous 5-HT and histamine release in the rat substantia nigra pars reticulata following medial forebrain bundle stimulation. Journal of neurochemistry. 2011;118:749–759. doi: 10.1111/j.1471-4159.2011.07352.x. [DOI] [PMC free article] [PubMed] [Google Scholar]
- Heien MLAV, Johnson MA, Wightman RM. Resolving neurotransmitters detected by fast-scan cyclic voltammetry. Analytical chemistry. 2004;76:5697–5704. doi: 10.1021/ac0491509. [DOI] [PubMed] [Google Scholar]
- Heien MLAV, Phillips PEM, Stuber GD, Seipel AT, Wightman RM. Overoxidation of carbon-fiber microelectrodes enhances dopamine adsorption and increases sensitivity. The Analyst. 2003;128:1413–1419. doi: 10.1039/b307024g. [DOI] [PubMed] [Google Scholar]
- Hermans A, Keithley RB, Kita JM, Sombers LA, Wightman RM. Dopamine detection with fast-scan cyclic voltammetry used with analog background subtraction. Analytical chemistry. 2008;80:4040–4048. doi: 10.1021/ac800108j. [DOI] [PubMed] [Google Scholar]
- Iravani MM, Millar J, Kruk ZL. Differential release of dopamine by nitric oxide in subregions of rat caudate putamen slices. Journal of neurochemistry. 1998;71:1969–1977. doi: 10.1046/j.1471-4159.1998.71051969.x. [DOI] [PubMed] [Google Scholar]
- Jones JL, Day JJ, Aragona BJ, Wheeler RA, Wightman RM, Carelli RM. Basolateral Amygdala Modulates Terminal Dopamine Release in the Nucleus Accumbens and Conditioned Responding. Biological Psychiatry. 2010;67:737–744. doi: 10.1016/j.biopsych.2009.11.006. [DOI] [PMC free article] [PubMed] [Google Scholar]
- Jones SR, Lee TH, Wightman RM, Ellinwood EH. Effects of intermittent and continuous cocaine administration on dopamine release and uptake regulation in the striatum: in vitro voltammetric assessment. Psychopharmacology. 1996;126:331–338. doi: 10.1007/BF02247384. [DOI] [PubMed] [Google Scholar]
- Keithley RB, Heien ML, Wightman RM. Multivariate concentration determination using principal component regression with residual analysis. Trends in analytical chemistry?: TRAC. 2009;28:1127–1136. doi: 10.1016/j.trac.2009.07.002. [DOI] [PMC free article] [PubMed] [Google Scholar]
- Keithley RB, Takmakov P, Bucher ES, Belle AM, Owesson-White CA, Park J, Wightman RM. Higher sensitivity dopamine measurements with faster-scan cyclic voltammetry. Analytical chemistry. 2011;83:3563–3571. doi: 10.1021/ac200143v. [DOI] [PMC free article] [PubMed] [Google Scholar]
- Keithley RB, Wightman RM. Assessing principal component regression prediction of neurochemicals detected with fast-scan cyclic voltammetry. ACS chemical neuroscience. 2011;2:514–525. doi: 10.1021/cn200035u. [DOI] [PMC free article] [PubMed] [Google Scholar]
- Kile BM, Walsh PL, McElligott ZA, Bucher ES, Guillot TS, Salahpour A, Caron MG, Wightman RM. Optimizing the Temporal Resolution of Fast-Scan Cyclic Voltammetry. ACS chemical neuroscience. 2012;3:285–292. doi: 10.1021/cn200119u. [DOI] [PMC free article] [PubMed] [Google Scholar]
- Kishida KT, Sandberg SG, Lohrenz T, Comair YG, Sáez I, Phillips PEM, Montague PR. Sub-second dopamine detection in human striatum. PloS one. 2011;6:e23291. doi: 10.1371/journal.pone.0023291. [DOI] [PMC free article] [PubMed] [Google Scholar]
- Kuhr WG, Wightman RM. Real-time measurement of dopamine release in rat brain. Brain research. 1986;381:168–171. doi: 10.1016/0006-8993(86)90707-9. [DOI] [PubMed] [Google Scholar]
- Logman MJ, Budygin EA, Gainetdinov RR, Wightman RM. Quantitation of in vivo measurements with carbon fiber microelectrodes. Journal of neuroscience methods. 2000;95:95–102. doi: 10.1016/s0165-0270(99)00155-7. [DOI] [PubMed] [Google Scholar]
- Natori S, Yoshimi K, Takahashi T, Kagohashi M, Oyama G, Shimo Y, Hattori N, Kitazawa S. Subsecond reward-related dopamine release in the mouse dorsal striatum. Neuroscience research. 2009;63:267–272. doi: 10.1016/j.neures.2008.12.011. [DOI] [PubMed] [Google Scholar]
- Owesson-White CA, Cheer JF, Beyene M, Carelli RM, Wightman RM. Dynamic changes in accumbens dopamine correlate with learning during intracranial self-stimulation. Proceedings of the National Academy of Sciences of the United States of America. 2008;105:11957–11962. doi: 10.1073/pnas.0803896105. [DOI] [PMC free article] [PubMed] [Google Scholar]
- Owesson-White CA, Roitman MF, Sombers LA, Belle AM, Keithley RB, Peele JL, Carelli RM, Wightman RM. Sources contributing to the average extracellular concentration of dopamine in the nucleus accumbens. Journal of neurochemistry. 2012;121:252–262. doi: 10.1111/j.1471-4159.2012.07677.x. [DOI] [PMC free article] [PubMed] [Google Scholar]
- Park J, Kile BM, Wightman MR. In vivo voltammetric monitoring of norepinephrine release in the rat ventral bed nucleus of the stria terminalis and anteroventral thalamic nucleus. European Journal of Neuroscience. 2009;30:2121–2133. doi: 10.1111/j.1460-9568.2009.07005.x. [DOI] [PMC free article] [PubMed] [Google Scholar]
- Park J, Takmakov P, Wightman RM. In vivo comparison of norepinephrine and dopamine release in rat brain by simultaneous measurements with fast-scan cyclic voltammetry. Journal of neurochemistry. 2011;119:932–944. doi: 10.1111/j.1471-4159.2011.07494.x. [DOI] [PMC free article] [PubMed] [Google Scholar]
- Parker JG, Zweifel LS, Clark JJ, Evans SB, Phillips PEM, Palmiter RD. Absence of NMDA receptors in dopamine neurons attenuates dopamine release but not conditioned approach during Pavlovian conditioning. Proceedings of the National Academy of Sciences of the United States of America. 2010;107:13491–13496. doi: 10.1073/pnas.1007827107. [DOI] [PMC free article] [PubMed] [Google Scholar]
- Patel AN, Tan S, Miller TS, Macpherson JV, Unwin PR. Comparison and reappraisal of carbon electrodes for the voltammetric detection of dopamine. Analytical chemistry. 2013;85:11755–11764. doi: 10.1021/ac401969q. [DOI] [PubMed] [Google Scholar]
- Phillips PEM, Robinson DL, Stuber GD, Carelli RM, Wightman RM. Real-time measurements of phasic changes in extracellular dopamine concentration in freely moving rats by fast-scan cyclic voltammetry. Methods in molecular medicine. 2003a;79:443–464. doi: 10.1385/1-59259-358-5:443. [DOI] [PubMed] [Google Scholar]
- Phillips PEM, Stuber GD, Heien MLAV, Wightman RM, Carelli RM. Subsecond dopamine release promotes cocaine seeking. Nature. 2003b;422:614–618. doi: 10.1038/nature01476. [DOI] [PubMed] [Google Scholar]
- Pihel K, Walker QD, Wightman RM. Overoxidized polypyrrole-coated carbon fiber microelectrodes for dopamine measurements with fast-scan cyclic voltammetry. Analytical chemistry. 1996;68:2084–2089. doi: 10.1021/ac960153y. [DOI] [PubMed] [Google Scholar]
- Richfield EK. Quantitative autoradiography of the dopamine uptake complex in rat brain using [3H]GBR 12935: binding characteristics. Brain research. 1991;540:1–13. doi: 10.1016/0006-8993(91)90486-f. [DOI] [PubMed] [Google Scholar]
- Roberts JG, Toups JV, Eyualem E, McCarty GS, Sombers LA. In situ electrode calibration strategy for voltammetric measurements in vivo. Analytical chemistry. 2013;85:11568–11575. doi: 10.1021/ac402884n. [DOI] [PMC free article] [PubMed] [Google Scholar]
- Robinson DL, Venton BJ, Heien MLAV, Wightman RM. Detecting subsecond dopamine release with fast-scan cyclic voltammetry in vivo. Clinical chemistry. 2003;49:1763–1773. doi: 10.1373/49.10.1763. [DOI] [PubMed] [Google Scholar]
- Roitman MF, Stuber GD, Phillips PEM, Wightman RM, Carelli RM. Dopamine operates as a subsecond modulator of food seeking. The Journal of neuroscience. 2004;24:1265–1271. doi: 10.1523/JNEUROSCI.3823-03.2004. [DOI] [PMC free article] [PubMed] [Google Scholar]
- Runnels PL, Joseph JD, Logman MJ, Wightman RM. Effect of pH and surface functionalities on the cyclic voltammetric responses of carbon-fiber microelectrodes. Analytical chemistry. 1999;71:2782–2789. doi: 10.1021/ac981279t. [DOI] [PubMed] [Google Scholar]
- Ryczko D, Grätsch S, Auclair F, Dubé C, Bergeron S, Alpert MH, Cone JJ, Roitman MF, Alford S, Dubuc R. Forebrain dopamine neurons project down to a brainstem region controlling locomotion. Proceedings of the National Academy of Sciences of the United States of America. 2013;110:E3235–E3242. doi: 10.1073/pnas.1301125110. [DOI] [PMC free article] [PubMed] [Google Scholar]
- Schluter EW, Mitz AR, Cheer JF, Averbeck BB. Real-time dopamine measurement in awake monkeys. PloS one. 2014;9:e98692. doi: 10.1371/journal.pone.0098692. [DOI] [PMC free article] [PubMed] [Google Scholar]
- Schultz W. Updating dopamine reward signals. Current opinion in neurobiology. 2013;23:229–238. doi: 10.1016/j.conb.2012.11.012. [DOI] [PMC free article] [PubMed] [Google Scholar]
- Siciliano CA, Calipari ES, Ferris MJ, Jones SR. Biphasic mechanisms of amphetamine action at the dopamine terminal. The Journal of neuroscience?: the official journal of the Society for Neuroscience. 2014;34:5575–5582. doi: 10.1523/JNEUROSCI.4050-13.2014. [DOI] [PMC free article] [PubMed] [Google Scholar]
- Singh YS, Sawarynski LE, Dabiri PD, Choi WR, Andrews AM. Head-to-head comparisons of carbon fiber microelectrode coatings for sensitive and selective neurotransmitter detection by voltammetry. Analytical chemistry. 2011;83:6658–6666. doi: 10.1021/ac2011729. [DOI] [PMC free article] [PubMed] [Google Scholar]
- Sinkala E, McCutcheon JE, Schuck MJ, Schmidt E, Roitman MF, Eddington DT. Electrode calibration with a microfluidic flow cell for fast-scan cyclic voltammetry. Lab on a chip. 2012;12:2403–2408. doi: 10.1039/c2lc40168a. [DOI] [PMC free article] [PubMed] [Google Scholar]
- Smeets WJAJ, González A. Catecholamine systems in the brain of vertebrates: new perspectives through a comparative approach. Brain Research Reviews. 2000;33:308–379. doi: 10.1016/s0165-0173(00)00034-5. [DOI] [PubMed] [Google Scholar]
- Sossi V, Ruth TJ. Micropet imaging: in vivo biochemistry in small animals. Journal of neural transmission. 2005;112:319–330. doi: 10.1007/s00702-004-0272-2. [DOI] [PubMed] [Google Scholar]
- Stamford JA. Fast cyclic voltammetry: measuring transmitter release in “real time”. Journal of neuroscience methods. 1990;34:67–72. doi: 10.1016/0165-0270(90)90043-f. Available at: [DOI] [PubMed] [Google Scholar]
- Stamford JA, Kruk ZL, Millar J, Wightman RM. Striatal dopamine uptake in the rat: in vivo analysis by fast cyclic voltammetry. Neuroscience letters. 1984;51:133–138. doi: 10.1016/0304-3940(84)90274-x. [DOI] [PubMed] [Google Scholar]
- Stuber GD, Klanker M, de Ridder B, Bowers MS, Joosten RN, Feenstra MG, Bonci A. Reward-predictive cues enhance excitatory synaptic strength onto midbrain dopamine neurons. Science. 2008;321:1690–1692. doi: 10.1126/science.1160873. Available at: [DOI] [PMC free article] [PubMed] [Google Scholar]
- Sugam JA, Day JJ, Wightman RM, Carelli RM. Phasic nucleus accumbens dopamine encodes risk-based decision-making behavior. Biological psychiatry. 2012;71:199–205. doi: 10.1016/j.biopsych.2011.09.029. [DOI] [PMC free article] [PubMed] [Google Scholar]
- Swamy BEK, Venton BJ. Subsecond detection of physiological adenosine concentrations using fast-scan cyclic voltammetry. Analytical chemistry. 2007;79:744–750. doi: 10.1021/ac061820i. [DOI] [PubMed] [Google Scholar]
- Takmakov P, Zachek MK, Keithley RB, Bucher ES, McCarty GS, Wightman RM. Characterization of local pH changes in brain using fast-scan cyclic voltammetry with carbon microelectrodes. Analytical chemistry. 2010;82:9892–9900. doi: 10.1021/ac102399n. [DOI] [PMC free article] [PubMed] [Google Scholar]
- Tsai H-Y, Lin Z-H, Chang H-T. Tellurium-nanowire-coated glassy carbon electrodes for selective and sensitive detection of dopamine. Biosensors & bioelectronics. 2012;35:479–483. doi: 10.1016/j.bios.2012.03.011. [DOI] [PubMed] [Google Scholar]
- Venton BJ, Michael DJ, Wightman RM. Correlation of local changes in extracellular oxygen and pH that accompany dopaminergic terminal activity in the rat caudate-putamen. Journal of neurochemistry. 2003;84:373–381. doi: 10.1046/j.1471-4159.2003.01527.x. [DOI] [PubMed] [Google Scholar]
- Venton BJ, Seipel AT, Phillips PEM, Wetsel WC, Gitler D, Greengard P, Augustine GJ, Wightman RM. Cocaine increases dopamine release by mobilization of a synapsin-dependent reserve pool. The Journal of neuroscience. 2006;26:3206–3209. doi: 10.1523/JNEUROSCI.4901-04.2006. [DOI] [PMC free article] [PubMed] [Google Scholar]
- Venton BJ, Troyer KP, Wightman RM. Response Times of Carbon Fiber Microelectrodes to Dynamic Changes in Catecholamine Concentration. Analytical Chemistry. 2002;74:539–546. doi: 10.1021/ac010819a. [DOI] [PubMed] [Google Scholar]
- Vickrey TL, Condron B, Venton BJ. Detection of endogenous dopamine changes in Drosophila melanogaster using fast-scan cyclic voltammetry. Analytical chemistry. 2009;81:9306–9313. doi: 10.1021/ac901638z. [DOI] [PMC free article] [PubMed] [Google Scholar]
- Watson CJ, Venton BJ, Kennedy RT. In vivo measurements of neurotransmitters by microdialysis sampling. Analytical chemistry. 2006;78:1391–1399. doi: 10.1021/ac0693722. [DOI] [PubMed] [Google Scholar]
- Wheeler RA, Aragona BJ, Fuhrmann KA, Jones JL, Day JJ, Cacciapaglia F, Wightman RM, Carelli RM. Cocaine cues drive opposing context-dependent shifts in reward processing and emotional state. Biological psychiatry. 2011;69:1067–1074. doi: 10.1016/j.biopsych.2011.02.014. [DOI] [PMC free article] [PubMed] [Google Scholar]
- Wightman RM, May LJ, Michael AC. Detection of dopamine dynamics in the brain. Analytical chemistry. 1988;60:769A–779A. doi: 10.1021/ac00164a001. [DOI] [PubMed] [Google Scholar]
- Willuhn I, Burgeno LM, Everitt BJ, Phillips PEM. Hierarchical recruitment of phasic dopamine signaling in the striatum during the progression of cocaine use. Proceedings of the National Academy of Sciences of the United States of America. 2012;109:20703–20708. doi: 10.1073/pnas.1213460109. [DOI] [PMC free article] [PubMed] [Google Scholar]
- Wu Q, Reith ME, Wightman RM, Kawagoe KT, Garris PA. Determination of release and uptake parameters from electrically evoked dopamine dynamics measured by real-time voltammetry. Journal of neuroscience methods. 2001;112:119–133. doi: 10.1016/s0165-0270(01)00459-9. [DOI] [PubMed] [Google Scholar]
- Yorgason JT, España RA, Jones SR. Demon Voltammetry and Analysis software: Analysis of cocaine-induced alterations in dopamine signaling using multiple kinetic measures. Journal of Neuroscience Methods. 2011;202:158–164. doi: 10.1016/j.jneumeth.2011.03.001. [DOI] [PMC free article] [PubMed] [Google Scholar]