Abstract
Pathogenic mycobacteria induce the formation of complex cellular aggregates called granulomas that are the hallmark of tuberculosis1,2. Here we examine the development and consequences of vascularisation of the tuberculous granuloma in the zebrafish-Mycobacterium marinum infection model characterised by organised granulomas with necrotic cores that bear striking resemblance to those of human tuberculosis2. Using intravital microscopy in the transparent larval zebrafish, we show that granuloma formation is intimately associated with angiogenesis. The initiation of angiogenesis in turn coincides with the generation of local hypoxia and transcriptional induction of the canonical pro-angiogenic molecule VEGFA. Pharmacological inhibition of the VEGF pathway suppresses granuloma-associated angiogenesis, reduces infection burden and limits dissemination. Moreover, anti-angiogenic therapies synergise with the first-line anti-tubercular antibiotic rifampicin as well as with the antibiotic metronidazole, which targets hypoxic bacterial populations3. Our data suggest that mycobacteria induce granuloma-associated angiogenesis, which promotes mycobacterial growth and increases spread of infection to new tissue sites. We propose the use of anti-angiogenic agents, now being used in cancer regimens, as a host-targeting TB therapy, particularly in extensively drug-resistant disease where current antibiotic regimens are largely ineffective.
The human tuberculous granuloma, a tightly cohesive cellular structure that houses infecting mycobacteria, develops hypoxic areas around its necrotic core4. In tumours, the development of hypoxia is tightly linked to angiogenesis and subsequent metastasis5. In tuberculosis, attention has focused on the possible consequences of granuloma hypoxia to bacterial physiology,4 but relatively little attention has been paid to the functional significance of findings that tuberculous granulomas are extensively vascularised6–8.
In its natural ectothermic hosts, Mycobacterium marinum, the closest relative of the M. tuberculosis complex, causes a disease called fish tuberculosis, a systemic wasting disease with organised epithelioid granulomas with necrotic cores. In zebrafish larvae, mycobacterium-infected macrophages form early granulomas, undergo a hallmark epithelioid transformation, and activate granuloma-specific gene expression programs2,9.
To monitor host vasculature in zebrafish, we used the Tg(kdrl:egfp)s843 line (referred to hereafter as Tg(flk1:EGFP)), in which vascular endothelial cells are fluorescently labelled10. Injection of mycobacteria into the most commonly used caudal vein (CV) site results in granulomas in the immediate vicinity of the richly-vascularised area of the caudal haematopoietic tissue (CHT) (Figure 1A). To determine if a different injection site with sparser and smaller blood vessels was more suitable to detect angiogenesis, assessed primary granulomas that typically formed dorsally after injection into the trunk (Figure 1B and 1C). As with CV injection, trunk injection resulted in most bacteria becoming macrophage-resident in granulomas (Extended Data 1A). Trunk granulomas progressed similarly to CV granulomas, with dissemination into richly-vascularised areas11 (Supplementary Video 1). Using Tg(mpeg1:tomato-caaxxt3) larvae, where macrophages are labelled by membrane-bound Tomato, revealed similar macrophage dynamics11, including the interstitial egress of infected macrophages, the transfer of M. marinum between granulomas, and coalescence of distal bacteria into existing granulomas (Supplementary Videos 2–4). Some infected macrophages invaded vasculature around the primary granuloma (Extended Data 1B and Supplementary Video 5).
Figure 1. Mycobacterium marinum infection induces angiogenesis in the zebrafish infection model.
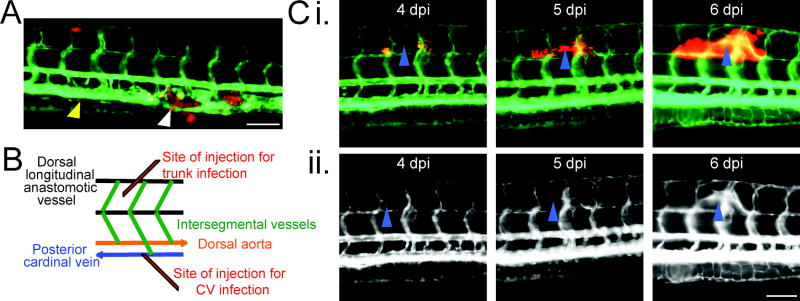
(A) M. marinum-tomato granuloma in the CHT region of a Tg(flk1:EGFP) larva. White arrowhead indicates area of occlusion in the posterior cardinal vein caused by M. marinum granuloma. Yellow arrowhead indicates area of normal posterior cardinal vein width anterior of occlusion.
(B) Schematic depicting location of injection into the trunk of a 2 dpf larva.
(C) Time lapse images of vascular growth around a trunk granuloma from a single Tg(flk1:EGFP) larva from 4 dpi to 6 dpi. i. Depicts M. marinum-tomato and labelled vasculature. ii. Depicts only Tg(flk1:EGFP)-labelled vasculature. Blue arrowhead tracks the growth of a single vessel across all frames.
Images are representative of (A) 10 and (B) 20 individual animals. Scale bars indicate 100 μm.
Imaging of trunk-infected larvae revealed angiogenesis, with growth of vasculature around sites of infection. We observed sprouting from the existing intersegmental vessels (ISVs) starting at 4 dpi, just after the formation of granulomas (Figure 1C). We assessed the features of vessel sprouting through long-term live imaging of infected larvae (Supplementary Videos 6–9). Vessel growth occurred in spurts with extended periods of quiescence or even reversed directionality (Extended Data 1C).
To examine the mode of vascular elongation, we used blue-fluorescent M. marinum to infect the transgenic zebrafish line Tg(fli1a:nlsEGFPy7; flk1:mCherryis5), in which endothelial nuclei are marked by EGFP expression. At 4 dpi, nuclei left the highly-organised ISVs, always towards sites of infection, and subsequently divided within the somites (Extended Data 1D and Supplementary Video 10). Vessels sprouted from both arterial and venous ISVs (Extended Data 1E).
We determined whether new blood vessels generated around the granuloma were functional. Using DsRed-labelled erythrocytes in the transgenic line Tg(flk1:EGFP; gata1:DsRedsd2) we found substantial blood flow through both ectopic vessels that spanned existing vessels completely and into newer blind-ending vessels (Extended Data 1F).
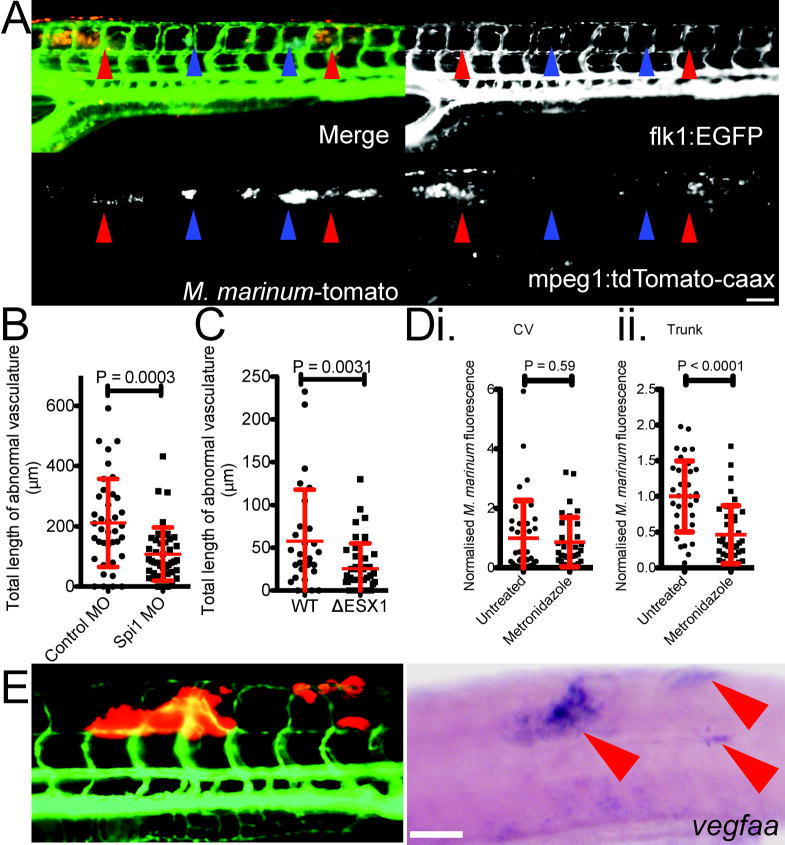
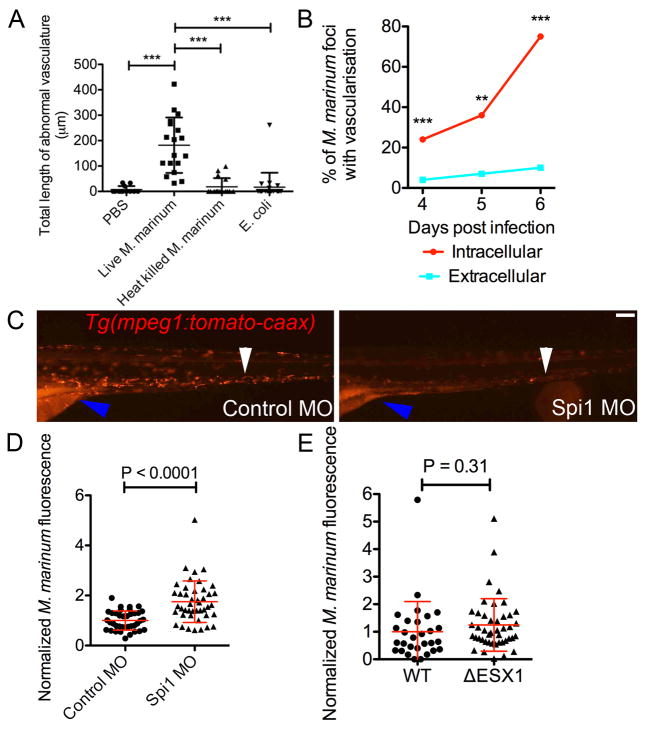
Angiogenesis required persistent M. marinum infection; it did not develop following injection of PBS, heat-killed M. marinum or non-pathogenic Escherichia coli (Extended Data 2A). Tumour-associated macrophages are important drivers of tumour angiogenesis upon tumour hypoxia12. Since macrophages serve as a principal repository of virulent mycobacteria, we assessed if there were differences in vascular recruitment between macrophage-resident and extracellular mycobacteria. Infection of double transgenic Tg(flk1:EGFP, mpeg1:tomato-caaxxt3) embryos infected with M. marinum-cerulean allowed us to discriminate between intracellular and extracellular bacteria (Figure 2A). Enumeration of vascular branching revealed an elevated vascularisation rate for intracellular compared with extracellular foci (OR [95% ci], 4 dpi 6.63 [2.57–17.11], 5 dpi 6.93 [1.51–31.75], 6 dpi 27.84 [10.18–76.18]) (Extended Data 2B).
Figure 2. Mycobacterium marinum induces vascularisation through granuloma formation in cooperation with host leukocytes and the expression of vascular endothelial growth factor.
(A) M. marinum-cerulean distribution in a Tg(flk1:EGFP, mpeg1:tomato-caaxtd3) double transgenic larva. Blue arrows indicate sites of extracellular bacterial growth, red arrows indicate sites of intracellular containment. Image is representative of 48 individual animals.
(B and C) Length of abnormal vasculature in: (B) 5 dpi control and Spi1 morphant larvae, and (C) 4 dpi larvae infected with WT or ΔESX1 M. marinum-tomato. T-test with Welch’s correction, all data are pooled from two biological replicates.
(D) Bacterial burden in i. CV infected and ii. trunk infected larvae treated with 5 mM metronidazole. T-test, data are pooled from three biological replicates.
(E) Distribution of M. marinum-tomato in a Tg(flk1:EGFP) larva (left) and corresponding whole mount in situ hybridisation detection of vegfaa expression in the same larva (right). Red arrowheads indicate sites of M. marinum granulomas. Image is representative of 20 individual animals.
Scale bars indicate 100 μm. Error bars represent mean ± standard deviation.
To demonstrate a functional requirement for macrophages in recruiting vasculature we performed morpholino knockdown of the transcription factor Pu.1/Spi1, which fully ablates all macrophages through 5 dpf13 (Extended Data 2C). As previously reported14, infection burden was markedly increased in the Spi1 knockdown animals (Extended Data 2D). Despite increased burden, the total length of abnormal vasculature was decreased in morpholino-injected animals compared with controls, suggesting that macrophages specifically mediate new vessel growth in the context of inflammation (Figure 2B).
Vascularisation coincided with the formation of granulomas at around 4 dpi. We disrupted mycobacterium-driven granuloma formation, using an ESX1-deficient M. marinum strain (ΔESX1) deficient for granuloma formation15. We infected with 7.5-fold excess ΔESX1 over wildtype, to generate equivalent bacterial burdens at 4 dpi (Extended Data 2E). As expected, both strains were predominantly macrophage-resident, but ΔESX1 infection resulted in fewer granulomas and a marked reduction in angiogenesis (Figure 2C). Thus, macrophage residence per se is not sufficient to induce angiogenesis. Rather, macrophages that have undergone further differentiation to form granulomas appear to be required.
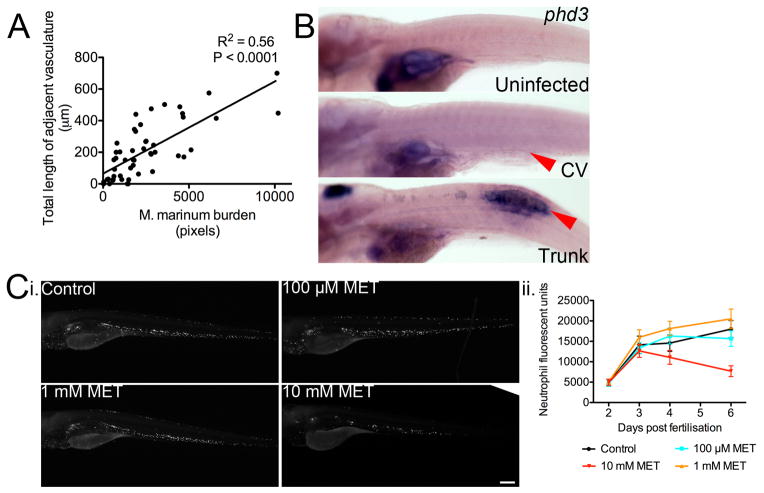
When we analysed the relationship between the size of individual infection foci and the length of recruited vasculature we found a strong correlation (Extended Data 3A). This relationship is reminiscent of the angiogenic switch, in which tumour size is directly related to the requirement for vascularisation due to the development of local hypoxia5.
We therefore asked whether hypoxia develops within granulomas. Activation of HIF-1α increases transcription of prolyl hydroxylase 3 (phd3), which serves as a reporter for hypoxic conditions in zebrafish larvae16,17. We detected robust expression of phd3 within trunk granulomas, but not CHT granulomas, which are already proximate to vasculature (Extended Data 3B) consistent with a lack of hypoxia in the CHT18. Conversely, to assess whether mycobacteria within granulomas were experiencing hypoxia, we investigated the effect of metronidazole treatment19. Metronidazole specifically kills anaerobically-growing bacteria including anaerobically-growing M. tuberculosis, but is ineffective during aerobic growth3,19,20. We utilised a nitroreductase-expressing transgenic line Tg(lyzC:ntr-p2A-lanYFPxt14) to titrate a biologically active dose of metronidazole (Extended Data 3C). Consistent with the phd3 staining, metronidazole treatment reduced bacterial burden in trunk-infected animals but not CV-infected larvae (Figure 2D).
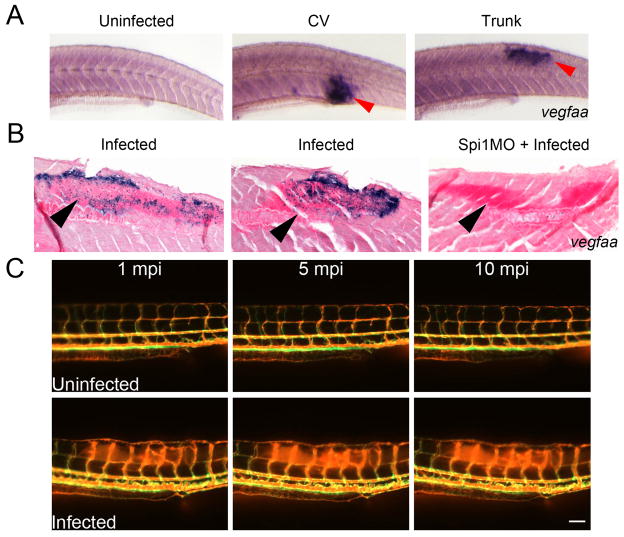
In tumours, hypoxia is known to induce VEGF expression, which in turn stimulates angiogenesis21. VEGF has been associated with TB pathogenesis: it is induced in active pulmonary TB22, and, in a rat corneal model, mediates neovascularisation in granulomas triggered by mycobacterial trehalose-6,6′-dimycolate23. VEGF plays a conserved role in homeostatic blood vessel recruitment in zebrafish24. We observed strong vegfaa expression around sites of mycobacterial granulomas in the trunk (Figure 2E). Similar expression levels were also observed around CHT granulomas indicating that initiation of pro-angiogenic signalling is not dependent on prior development of hypoxia during infection (Extended Data 4A). Analysis of stained sections revealed cells around the edge of mycobacterial granulomas expressing vegfaa, an observation consistent with a primarily macrophage-driven expression pattern that could be reduced by macrophage depletion (Extended Data 4B). In addition to its role in angiogenesis, VEGFA plays an important role in driving vascular permeability25. We performed microangiography on infected animals and found increased vascular leakage, suggesting a local effect of vegfaa expression around infection foci (Extended Data 4C).
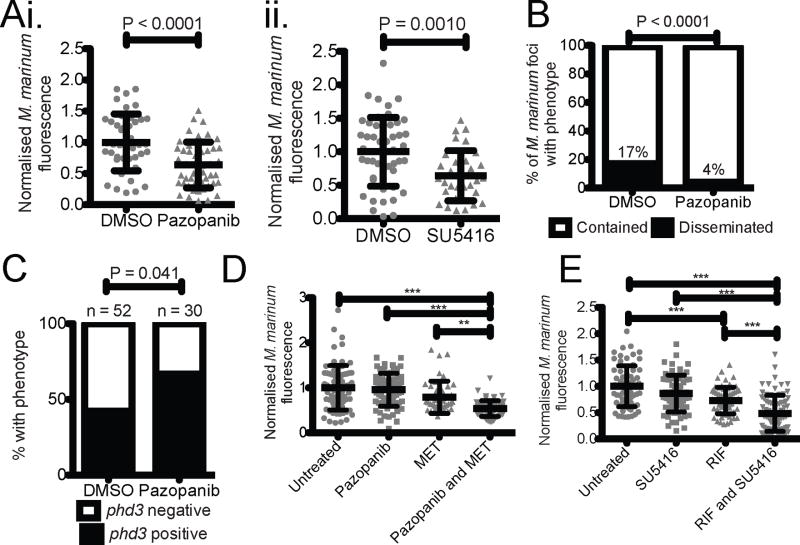
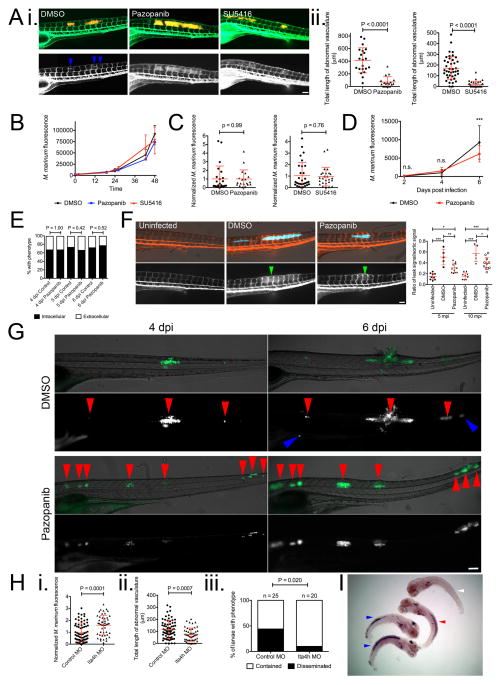
Angiogenesis and, specifically, VEGFR signalling have been targeted in cancer therapies. Our findings suggested that these therapies might also be useful for mycobacterial infections. We chose the well-characterised small molecule SU5416, a prototypical tyrosine kinase receptor, and pazopanib, a clinically relevant VEGFR inhibitor26,27. Treatment of infected animals with SU5416 or pazopanib prevented ectopic angiogenesis around the forming granulomas in Tg(flk1:EGFP) animals and reduced net bacterial burdens (Figure 3A and Extended Data 5A). Neither compound affected in vitro growth of M. marinum, suggesting that the effect on bacterial burden was through targeting host pathways (Extended Data 5B). We confirmed that the treatments were specifically targeting angiogenesis since bacterial burdens were lowered only in trunk-infected and not in CV-infected animals (Extended Data 5C). Additionally, in trunk-infected animals, growth restriction did not occur until after the initiation of angiogenesis at 4 dpi (Extended Data 5D). To determine if VEGFR inhibition affected macrophage recruitment, we compared the association of bacterial foci with macrophages between control and pazopanib-treated larvae. We did not observe any differences in the proportion of macrophage-associated foci at timepoints between 4 and 6 dpi (Extended Data 5E). Together, these data suggest that VEGFR inhibition reduces bacterial burden specifically through restriction of vascularisation.
Figure 3.
Inhibition of Vascular Endothelial Growth Factor Receptor signalling reduces Mycobacterium marinum pathogenicity in zebrafish larvae
(A) Bacterial burden in trunk infected (i) pazopanib and (ii) SU5416 treated larvae. T-test, data are pooled from i. two or ii. three biological replicates.
(B) Bacterial dissemination in untreated and pazopanib-treated larvae. Total number of granulomas and larvae analysed: Untreated 77 granulomas from 18 larvae, Pazopanib 130 granulomas from 22 larvae. Fisher’s exact test.
(C) Expression of phd3 hypoxia marker in untreated and pazopanib-treated infected larvae detected by in situ hybridisation. Total number of larvae analysed = 52 (DMSO), 30 (pazopanib). Fisher’s exact test, data are from a single technical replicate of two pooled biological replicates.
(D) Bacterial burden in pazopanib, MET and pazopanib and MET treated larvae. One-way ANOVA with Tukey’s post-test, data are pooled from three biological replicates.
(E) Bacterial burden in RIF, SU5416, and RIF and SU5416 treated larvae. One-way ANOVA with Tukey’s post-test, data are pooled from three biological replicates.
Error bars represent mean ± standard deviation.
To determine if VEGFR inhibition also reduced infection-induced vascular permeability, we measured permeability in treated and untreated animals matched for infection burden. We found a reduction in vascular leakiness in animals treated with VEGFR inhibitor (Extended Data 5F).
Angiogenesis is thought to play an important role in tumour metastasis5. Analogously, in long-term monitoring experiments, we observed a decreased rate of M. marinum dissemination to distal sites in animals treated with VEGFR antagonist compared with untreated animals (OR 0.27, 95% ci 0.12 to 0.63) (Figure 3B and Extended Data 5G). To investigate if decreased dissemination was solely a consequence of reduced bacterial growth, we examined a hypoinflammatory state caused by knockdown of an enzyme involved in eicosanoid biosynthesis, Lta4h28. Lta4h knockdown increased burden, limited angiogenesis and also decreased dissemination, suggesting a role for angiogenesis in dissemination independent of burden (Extended Data 5H).
We hypothesised that reduced bacterial growth due to decreased oxygen availability may contribute to overall reduced burdens. Pazopanib treatment resulted in an increased number of phd3-positive granulomas (Figure 3C and Extended Data 5I). Moreover, pazopanib treatment increased the effectiveness of metronidazole (Figure 3D). These results suggest that angiogenesis is an important modulator of oxygen availability for infecting mycobacteria and that its limitation can enhance the efficacy of therapies targeting hypoxia. Metronidazole has only marginal therapeutic efficacy in human tuberculosis29; our results suggest combining it or related compounds with VEGFR inhibitors that increase the hypoxic environment. Finally, we showed that targeting of VEGFR signalling could complement the first-line antitubercular drug rifampicin: combination of rifampicin and SU5416 resulted in decreased burden compared to either drug alone (Figure 3E).
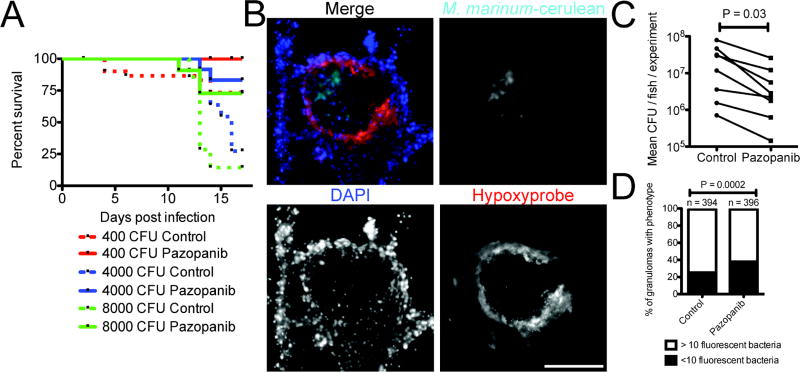
We next addressed the therapeutic effectiveness of VEGFR inhibition in adult animals. We infected with a range of mycobacterial doses from 400–8000 CFU via intraperitoneal injection, treated with pazopanib, and observed survival. Over seventeen days, pazopanib treatment increased survival in animals infected with high doses (4000 and 8000 CFU) of M. marinum, but there was not yet appreciable mortality in the low-dose infection (Figure 4A). At a dose of 500 CFU, where significant mortality was not observed in the first three weeks, we observed granulomas that were completely cellular as well as ones that had developed necrotic cores by two weeks post-infection (Extended Data 6A). Many adult granulomas were hypoxic, as assessed by pimonidazole treatment and staining. Staining was largely specific to granulomas and was concentrated in the cellular rim of the necrotic area, a pattern similar to that seen in macaques19 (Figure 4B and Extended Data 6B).
Figure 4.
Inhibition of Vascular Endothelial Growth Factor Receptor signalling reduces Mycobacterium marinum burden in adult zebrafish
(A) Survival analysis of adult zebrafish infected with 400 CFU (red lines), 4000 CFU (blue lines) or 8000 CFU (green lines) M. marinum. Zebrafish are further grouped into control (dashed lines) or pazopanib treated (solid lines). Log-rank test 400 CFU not significant, 4000 CFU P=0.012, 8000 CFU P=0.029.
(B) Representative image of a necrotic granuloma from a 2 wpi adult Tg(flk1:EGFP) zebrafish infected with M. marinum-cerulean (cyan), and stained for hypoxyprobe (red) and with DAPI (blue). Image is representative of granulomas found in 16 individual animals.
(C) Pooled bacterial burden in pazopanib treated adult zebrafish. Matched T-test.
(D) Comparison of granulomas between control and pazopanib-treated adult zebrafish scored for M. marinum burden as <10 or more than 10 bacteria. Total number of zebrafish analysed = 4 (control), 4 (pazopanib).
Scale bar represents 100 μm. Error bars represent mean ± standard deviation.
Pazopanib treatment increased the mean distance of granulomas to the nearest vasculature (Extended Data 6C). As in larvae, treatment resulted in reduced bacterial burdens, with a mean 4-fold reduction relative to control animals over two weeks (Figure 4C). In week-old established infections, pazopanib treatment for one week resulted in a mean 8-fold reduction in burden (Extended Data 6D).
After six weeks of treatment, vascularisation was still significantly reduced relative to controls (Extended Data 7A). Notably, there was an increased fraction of low-burden or sterile granulomas in the pazopanib-treated animals (Figure 4D and Extended Data 7B). In addition, the drug-treated animals displayed an increased fraction of hypoxic granulomas, and there was an association of hypoxic granulomas with low-burden lesions (Extended Data 7C and 7D). Many low-burden or sterilised hypoxic granulomas in the drug-treated animals had acellular necrotic central areas (Extended Data 6A and 7B). Studies of caseous tuberculous granulomas that are sterile in asymptomatic humans suggest that such an outcome is possible even in the normal course of TB30.
We conclude that angiogenesis triggered by mycobacterial granulomas is an important feature of mycobacterial pathogenesis and has significant consequences to infection pathology and progression. We have shown that interception of this angiogenic program using host-directed therapies can limit mycobacterial disease. These findings suggest the potential utility of host-targeting anti-angiogenic agents as adjunctive therapies.
Methods
Zebrafish handling
All zebrafish husbandry and experimental procedures were performed in accordance and compliance with policies approved by the Duke University Institutional Animal Care and Use Committee (protocol A180-11-07). Clutches of eggs were collected from natural spawning and raised in filtered fish system water at 28°. Pigment development was halted in 1 dpf embryos by the addition of 1-phenyl-2-thiourea (PTU; Sigma-Aldrich; final concentration 45 μg/mL). Unless otherwise indicated, all zebrafish are from the wild-type AB strain.
Infection by microinjection
Embryos were anesthetised at 2 dpf (or 1 dpf for morphants) with tricaine (MS-222; Sigma-Aldrich; final concentration 160 μg/mL) and injected with approximately 200 CFU M. marinum or E. coli in an injection bolus of 10–20 nl as shown in Figure 1B. Infected embryos were then recovered back to filtered fish system water supplemented with PTU. Embryos that were physically damaged by injection handling were discarded and excluded from further analysis.
Live imaging
Conventional and time-lapse fluorescent microscopy was carried out on a Zeiss Observer Z1 inverted microscope. Embryos were anesthetised with tricaine and mounted in 3% (w/v) methylcellulose for static microscopy. Embryos for time-lapse microscopy were anesthetised with 120 μg/mL tricaine, mounted in 0.75% low melting point agarose in 96 well plates and immersed in filtered fish system water supplemented with PTU. Confocal microscopy was performed with an Olympus FV1000 confocal microscope. Images were processed with ImageJ (NIH), Photoshop CS4 (Adobe) and Volocity 5.4 image analysis software (Improvision/PerkinElmer Life and Analytical Sciences).
Image analysis
Abnormal vascular length was measured as the 2 dimensional length of vessels not seen in control embryos in Photoshop using the ruler tool. Infection burden and neutrophil units were measured as the number of pixels above background per embryo in ImageJ using binary thresholding of single channel images and the Analyze Particles function. Macrophage association was scored as having mpeg:tomato-caax expression around sites of M. marinum-wasabi expression. Dissemination was scored by comparing images of infected larvae at 4 and 6 dpi to track M. marinum infection foci.
Whole mount in situ hybridisation
Whole mount in situ hybridisation was carried out essentially as described31. Primers used for cloning vegfaa were previously described32. Primers used for cloning phd3 were: 5′ ATTCCTGTGGGCTTCTCAAC 3′ and 5′ ACACGAACCAAACTGCTCAC 3′. Images of stained embryos were collected on a Nikon AZ100 microscope.
Construction of mpeg1:tomato-caax transgene
The previously characterized mpeg1 promoter33 was PCR amplified using the primers 5′-CCCAAACTCGAGTTGTTGGAGCACATCTGACAT-3′ and 5′-GGGAGGAAGCTTTGTTTTGCTGTCTCCTGCACT-3′. The product was subsequently cloned into p5E MCS34 using XhoI and HindIII sites to generate p5E mpeg1.
To construct a gateway compatible Tomato-CAAX construct, the sequence of Tomato was PCR amplified with the primers 5′-GGGGACAAGTTTGTACAAAAAAGCAGGCTGGACCATGGTGAGCAAGGGCGAGGAG-3′ and 5′-GGGGACCACTTTGTACAAGAAAGCTGGGTAGATCTACTTGTAGAGCTCGTCCATGCCG-3′. These primers introduced a silent SacI site in the 3′ end of the Tomato coding sequence and a BglII site downstream of the Tomato stop codon. The PCR product was subsequently cloned by gateway recombination (Invitrogen) into pDONR221 to generate pME Tomato.
To generate pME Tomato-CAAX, pME Tomato was digested with SacI and BglII and a linker sequence encoding the human H-Ras prenylation signal was cloned into the plasmid to generate pME Tomato-CAAX. Primer sequences for the linker were as follows: top strand- 5′-CTACAAGAAGCTGAACCCTCCTGATGAGAGTGGCCCCGGCTGCATGAGCTGCAAGTGTGTGCTCTCCTA-3′ bottom strand- 5′-GATCTAGGAGAGCACACACTTGCAGCTCATGCAGCCGGGGCCACTCTCATCAGGAGGGTTCAGCTTCTTGTAGAGCT-3′.
The mpeg1:tomato-caax transgene construct was subsequently constructed by recombining p5E mpeg1, pME Tomato-CAAX and p3E polyA into pDestTol2pA2, by Gateway multisite recombination (Invitrogen) as previously characterized34, to generate pDestTol2; mpeg1:tomato-caax.
Construction of mfap4:turquoise transgene
The mfap4 promoter was PCR amplified using the primers 5′-CATGTTCTCGAGGCGTTTCTTGGTACAGCTGG-3′ and 5′-CATGTTGGATCCCACGATctaaagtcatgaagaaaga-3′. The product was subsequently cloned into p5E MCS using XhoI and BamHI sites. The native start codon was mutated using the primer 5′-CTGAGCTGTTGAGGAGAGAGTGAGAAG[ATT]GCAGTAAGTTCTGTGGCTGTTTTATTCC-3′ by inverse PCR with the backbone primers 5′-GTAAGTTCTGTGGCTGTTTTATTC-3′ and 5′-CTTCTCACTCTCTCCTCAACAG-3′. The final p5E mfap4 was then assembled by Gibson assembly using this single stranded oligo and the backbone.
To generate pME Turquoise2, we used the primers 5′-GGGGACAAGTTTGTACAAAAAAGCAGGCTggaccatggtgagcaagggcgaggag-3′ and 5′-GGGGACCACTTTGTACAAGAAAGCTGGGTttacttgtacagctcgtccat-3′ to amplify off pmTurquoise2 H2A (Addgene plasmid #3620235). The PCR product was subsequently cloned into pDONR221 by BP cloning (Invitrogen) to generate pME Turquoise2.
The mfap4:turquoise transgene construct was subsequently constructed by recombining p5E mfap4, pME Turquoise and p3E polyA into pDestTol2pA2 to generate pDestTol2; mfap4:turquoise.
Construction of lyzC:ntr-p2A-lanYFP transgene
The previously characterised lyzC promoter was PCR amplified from the BAC CH211-250A24 (BACPAC resources, Childrens Hospital of Oakland Research Institute) using the primers 5′-CCCATAGGTACCctgatcactggtgtagtgaactc-3′ and 5′-CCCAAACTCGAGATTGTATCACTGCTGATATCTGCTTT-3′. The product was subsequently cloned into p5E MCS using KpnI and XhoI sites to generate p5E lyzC.
To generate pME Ntr, we used the primers 5′-GGGGACAAGTTTGTACAAAAAAGCAGGCTGGACCatgGCCTCCGGACTCAGATCTCGAGC-3′ and 5′-GGGGACCACTTTGTACAAGAAAGCTGGGTcCACTTCGGTTAAGGTGATGTTTTGC-3′ to amplify off pminiTol2-YFP-NTR (Gift from L. Ramakrishnan). The PCR product was subsequently cloned into pDONR221 by BP cloning (Invitrogen) to generate pME Ntr.
To generate p3E p2A-lanYFP, we used the primers 5′-GGGGACAGCTTTCTTGTACAAAGTGGttGGATCCttcagtCTCGAGatggtgagcaagggcgaggag-3′ and 5′-GGGGACAACTTTGTATAATAAAGTTGttacttgtacagctcgtccat-3′ to amplify the dimeric form of lanYFP from pNCS-dlanYFP (Allele Biotechnology). The PCR product was subsequently cloned into pDONR P2R-P3 by BP cloning (Invitrogen) to generate p3E lanYFP. p3E lanYFP was subsequently digested with BamHI and XhoI and ligated with annealed oligos encoding the p2A sequence (GATCcGGAAGCGGAGCTACTAACTTCAGCCTGCTGAAGCAGGCTGGAGACGTGGAGGAGAACCCTGGACCTc and TCGAgAGGTCCAGGGTTCTCCTCCACGTCTCCAGCCTGCTTCAGCAGGCTGAAGTTAGTAGCTCCGCTTCCg36) to generate p3E p2a lanYFP.
The lyzC:ntr-p2A-lanYFP transgene construct was subsequently constructed by recombining p5E lyzC, pME Ntr and p3E p2A-lanYFP into pDestTol2pA2 to generate pDestTol2; lyzC:ntr-p2A-lanYFP.
Nucleic acid microinjection
Tol2 transposase was generated from T3TS-Tol237 using the mMessage mMachine T3 kit (Invitrogen). To generate transgenic zebrafish, embryos at the one-cell stage were injected with approximately 1 nL of trangenesis mixture consisting of 25 ng/μL transposase RNA and 50 ng/μL pDestTol2; transgenesis construct. Positive embryos were selected by fluorescence microscopy, raised to adulthood and transgenic founders were subsequently identified.
Spi1 morpholino sequence 5′ GATATACTGATACTCCATTGGTGGT 3′, Lta4H morpholino sequence 5′ AGCTAGGGTCTGAAACTGGAGTCAT3′. Morpholinos were injected at 10–60 μM.
Drug treatments
Metronidazole (M1547; Sigma-Aldrich; final concentration 5 mM) was dissolved in water, the relatively high concentration of metronidazole seems to be a function of bioavailability in zebrafish as higher concentrations are routinely required for nitroreductase mediated cellular ablation studies38. Pazopanib (sc-364564; Santa Cruz Biotechnology; final concentration 250 nM for larvae, 1 μM for adults) and SU5416 (S8442; Sigma-Aldrich; final concentration 250 nM) were dissolved in DMSO. Metronidazole, pazopanib, SU5416 were added immediately after infection and refreshed every two days for the duration of the experiment. Randomisation into drug treatment groups was achieved by random selection of infected zebrafish from a single pool prior to addition of drugs.
Microangiography
To detect vascular leakiness in wild type and Tg(flk1:EGFP) embryos and ectopic vasculature in WHIM embryos, embryos were anesthetised in tricaine water and injected with a 10 nl bolus of Dextran-Texas Red 70,000 MW (D-1830; Life Technologies; 1 mg/ml final concentration) into the posterior section of the dorsal aorta or posterior cardinal vein. This injection location avoided injection trauma-induced tissue leakage occurring near M. marinum lesions. Injected embryos were rinsed in tricaine water and immediately mounted in methylcellulose for fluorescent microscopy. Vascular leakage was calculated as a ratio of intersomitic dextran-Texas red signal divided by aortic dextran-Texas red signal.
Combined drug treatments
Rifampicin (R3501; Sigma-Aldrich; final concentration 50 μM) was dissolved in DMSO. To achieve a suboptimal dose of VEGFR inhibition, SU5416 was added immediately after infection at a final concentration of 200 nM and refreshed at 3 dpi. Rifampicin was added at 3 dpi and not refreshed for the duration of the experiment.
Metronidazole (final concentration 5 mM) and pazopanib (suboptimal final concentration 200 nM) were added immediately after infection and refreshed every two days for the duration of the experiment.
Adult infections
Adult zebrafish were infected with approximately 500 CFU of fluorescent M. marinum via intra peritoneal injection. Zebrafish were maintained in beakers in a dedicated incubator at 28° with a 14:10 hour light:dark cycle. Pazopanib was added to a final concentration of 1 μM immediately after infection and refreshed every two days for the duration of the experiment.
Bacterial recovery from infected adults
Infected adult zebrafish pretreated with 25 μg/ml hygromycin to reduce microbiota load for two hours prior to harvesting. Zebrafish were euthanised by tricaine overdose and homogenised by bead mill for three bursts of 15 seconds. Homogenate was plated on Middlebrook 7H10 (262710; Difco) supplemented with OADC, hygromycin (H0654; Sigma-Aldrich, 50 μg/l) and amphotericin B (SV3007801; Thermo Scientific, 10 mg/l). Plates were grown at 30° for 10–14 days until fluorescent colonies could be counted.
Hypoxyprobe staining
Infected adult zebrafish were injected with 15 μl of a 10 mg/ml pimonidazole solution (HP7; Hypoxyprobe) every two days from 8 dpi to 14 dpi. Zebrafish were euthanised by tricaine overdose at 14 dpi, fixed in 4% PFA, decalcified in 0.5M EDTA and cyrosectioned. Frozen sections were stained with 4.3.1.3 mouse Dylight 549-MAb (HP7; Hypoxyprobe) or with unconjugated 4.3.1.3 mouse MAb and secondary detection with goat anti-mouse Alexa-Fluor 647 (A-21235; Life Technologies) to detect hypoxic cells.
Statistics
Data are presented as mean ± standard deviation. Experiments were analysed with the statistical tests indicated in figure legends using Prism 5 (Graphpad). Unpaired T-tests were performed unless otherwise indicated. For ANOVA analyses with Tukey’s post-test, P values are indicated as follows * P <0.05, ** P <0.01, *** P < 0.001.
Extended Data
Extended Data 1.
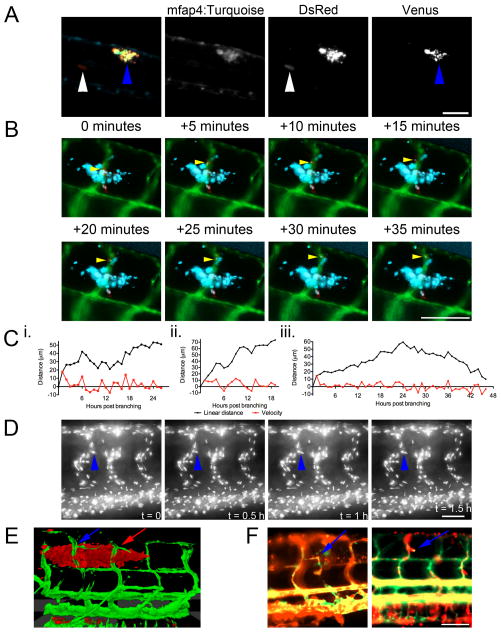
(A) Image of 6 dpi Tg(mfap4:turquoisext27) larvae infected with M. marinum SM2 pMAP49::Venus. Blue arrowheads indicates site of granuloma with induced expression of Venus from phagocytosed M. marinum. White arrowheads indicate sites of extracellular M. marinum growth detected by constitutive DsRed expression but no macrophage-induced Venus expression. Image is representative of granulomas found in 5 individual animals.
(B) Time-lapse images of M. marinum-cerulean dissemination from an established granuloma into the adjacent intersegmental vessel in a Tg(flk1:EGFP, mpeg1:tomato-caaxtd3) double transgenic larva where bacterial are blue labelled, blood vessels are green labelled and macrophages are red labelled. Yellow arrow tracks a single infected macrophage egressing the established granuloma and entering the vasculature. Images are representative of macrophage behaviour in 3 individual animals.
(C) Plots of vessel growth kinetics from three individual branches in individual Tg(flk1:EGFP) larvae. Video of each larva analysed is available in Supplementary Videos 6 and 7 (i.), and 8 and 9 (iii.).
(D) Time-lapse images of nuclear division during vascular growth in a single Tg(fli1a:EGFP-nls) larva. Blue arrowhead indicates nucleus of interest. Images are representative of nuclear division in 10 individual animals. Video of nuclear division is available in Supplementary Video 10.
(E) Three-dimensional rendering of recruited blood vessels in a Tg(flk1:EGFP) larva infected with M. marinum-tomato originating from arterial and venous ISVs as indicated by red and blue arrows, respectively. Image is representative of 10 individual animals.
(F) Extended exposure images of blood flow in Tg(flk1:EGFP, gata1:DsRedsd2) larvae. Blue arrows indicate blood flow through ectopic vessels. Images are representative of blood flow in 20 individual animals. Scale bars indicate 100 μm.
Extended Data 2.
(A) Length of abnormal vasculature in Tg(flk1:EGFP) larvae injected with PBS, live M. marinum, heat killed M. marinum and E. coli. One-way ANOVA with Tukey’s post-test, data are representative of two biological replicates.
(B) Recruitment of vasculature by intracellular and extracellular foci of M. marinum. Total number of foci analysed: 4 dpi 221 intracellular 105 extracellular, 5 dpi 71 intracellular 26 extracellular and 6 dpi 131 intracellular 50 extracellular. Fisher’s exact test.
(C) Comparative images of 5 dpf control and Spi1 morphant Tg(mpeg1:tomato-caax)xt3 larvae. White arrowhead indicates comparative locations within the caudal haematopoietic tissue. Blue arrowhead indicates intestinal and yolk sac autofluorescence. Scale bar indicates 100 μm. Images are representative of transgene expression in 20 animals per treatment group.
(D and E) Bacterial burden in: (D) 5 dpi control and Spi1 morphant larvae, and (E) 4 dpi larvae infected with WT or ΔESX1 M. marinum-tomato. T-test with Welch’s correction, all data are pooled from two biological replicates.
Error bars represent mean ± standard deviation.
Extended Data 3.
(A) Plot of abnormal vasculature length and bacterial burden for individual foci of infection measured by FPC in Tg(flk1:EGFP) larvae. Slope significantly not zero, P < 0.0001 linear regression, data are pooled from three biological replicates.
(B) Whole mount in situ hybridisation detection of phd3 expression. Images are representative of phd3 staining in Uninfected (20/20), CV (20/20) and Trunk (7/20).
(C) i. Images of Tg(lyzC:ntr-p2A-lanYFPxt14) larvae treated with metronidazole as indicated. Green arrowheads indicate comparative locations within caudal haematopoietic tissue. Images are median images from experimental groups Control n=21, 100 μM n=22, 1 mM n=24 and 10 mM n=19. ii. Quantification of neutrophil numbers by area of fluorescence in Tg(lyzC:ntr-p2A-lanYFPxt14) larvae treated with metronidazole from 2 dpf to 6 dpf. Error bars represent mean ± standard deviation.
Extended Data 4.
(A) Whole mount in situ hybridisation detection of vegfaa expression in uninfected, caudal vein injected and trunk injected larvae. Red arrow indicates sites of infection with vegfaa expression. Images are representative of 20 animals per treatment group.
(B) Representative histological sections of whole mount in situ hybridisation detected vegfaa expression in control infected larvae and a Spi1MO-treated infected larva. Black arrows indicate sites of infection identified by increased nuclear fast red staining density. Images are representative of 10 animals per treatment group.
(C) Microangiography of Tg(flk1:EGFP) larvae imaged at 1, 5 and 10 minutes post injection (mpi). Top panels are representative of uninfected larvae, bottom panels are representative of larvae infected with unlabelled M. marinum. Images are representative of 10 animals per treatment group. Scale bars indicate 100 μm.
Extended Data 5.
(A) i. Comparative images of Tg(flk1:EGFP) larvae infected with M. marinum-tomato and treated with DMSO, pazopanib or SU5416. Top panels depict M. marinum-tomato and labelled vasculature. Bottom panels depict only Tg(flk1:EGFP)-labelled vasculature. Blue arrowheads indicate somites with ectopic vasculature. Images are representative of 20 animals per treatment group. ii. Length of abnormal vasculature in pazopanib or SU5416 treated larvae. T-test, data are pooled from two or three biological replicates, respectively.
(B) Growth curve of M. marinum-tomato in 7H9 broth culture supplemented with pazopanib or SU5416. Data are representative of two biological replicates.
(C) Bacterial burden in CV infected larvae treated with either pazopanib or SU5416. T-test, data are pooled from two biological replicates.
(D) Longitudinal bacterial burden from 2 to 6 dpi in trunk infected larvae treated with pazopanib. One-way ANOVA with Tukey’s post-test.
(E) Comparison of M. marinum foci between control and pazopanib treated larvae scored by association with macrophages. Fisher’s exact test.
(F) i. Microangiography of larvae infected with M. marinum-cerulean, injected with high molecular weight dextran-Texas red at 6 and imaged at 5 mpi. Top panels depict M. marinum-cerulean and dextran-Texas red, bottom panels depict only dextran-Texas red in vasculature and leakage around sites of infection. Green arrowheads indicate somites with highest leakage signals in infected larvae. Images are median images from graph in Extended Data 5Fii. ii. Quantification of vascular leakage in uninfected, DMSO and pazopanib treated larvae. One-way ANOVA with Tukey’s post-test, data are representative of two biological replicates.
(G) Dissemination of M. marinum-wasabi in larvae treated with DMSO or pazopanib. Red arrowheads indicate contained foci of infection that remain in the same location through infection, blue arrowheads indicate disseminated foci of infection. Images are representative of data in Figure 3B.
(H) Bacterial burden (i.), length of abnormal vasculature (ii.), and dissemination (iii.) in 5 dpi control and Lta4h morphant larvae.
(I) Whole mount in situ hybridisation detection of phd3 expression in uninfected (white arrow) and M. marinum infected zebrafish larvae. Blue arrows indicate phd3 expression positive larvae with purple staining, red arrow grey associated with bacteria, but lack of purple staining, indicating phd3 expression negative larva. Image is representative of data in Figure 3C.
Scale bars indicate 100 μm. Error bars represent mean ± standard deviation.
Extended Data 6.
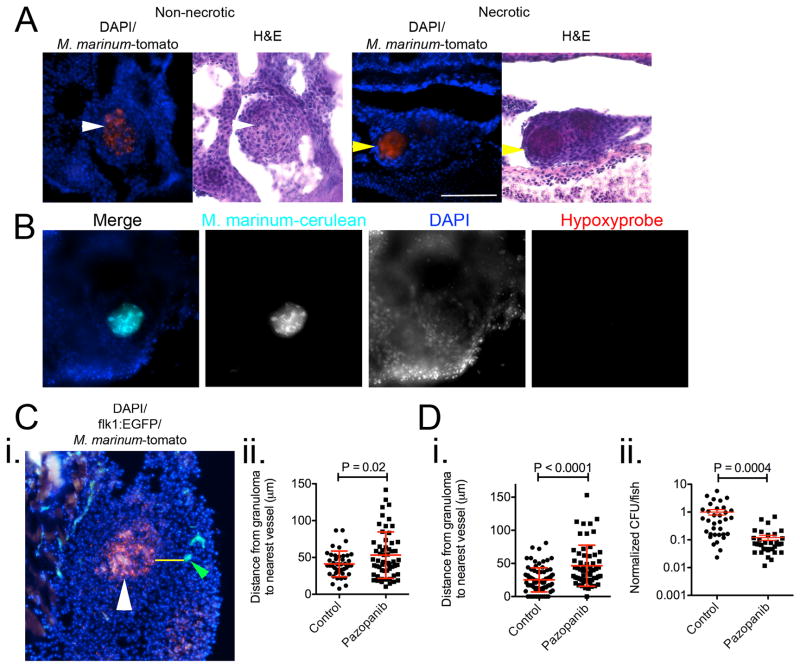
(A) Images of non-necrotic (left) and necrotic (right) M. marinum-tomato granulomas stained with DAPI (top) and haematoxylin & eosin (bottom). White arrows indicate non-necrotic granuloma, yellow arrows indicate necrotic granulomas. Images are representative of granulomas found in 8 individual animals.
(B) Representative image of a necrotic granuloma from a negative control, not injected with pimonidazole, 2 wpi adult Tg(flk1:EGFP) zebrafish infected with M. marinum-cerulean (cyan), and stained for hypoxyprobe (red) and with DAPI (blue). Images are representative of granulomas found in 2 individual animals.
(C) i. Representative image of M. marinum-tomato granuloma in Tg(flk1:EGFP) zebrafish stained with DAPI. White arrow indicates granuloma, yellow line indicates path measured for distance between granuloma and nearest vasculature (indicated by green arrow). Image is representative of data presented in Extended Data 6Cii, Extended Data 6Di and Extended Data 7A. ii. Distance between granulomas and nearest vasculature measured in 2 wpi adult Tg(flk1:EGFP) zebrafish. Total number of zebrafish analysed = 4 (control), 4 (pazopanib).
(D) i. Distance between granulomas and nearest vasculature measured in 2 wpi adult Tg(flk1:EGFP) zebrafish treated with pazopanib for 1 week. Total number of zebrafish analysed = 2 (control), 2 (pazopanib). ii. Bacterial burden in 2 wpi adult zebrafish treated with pazopanib for 1 week. T-test, data are pooled from 3 biological replicates.
Extended Data 7.
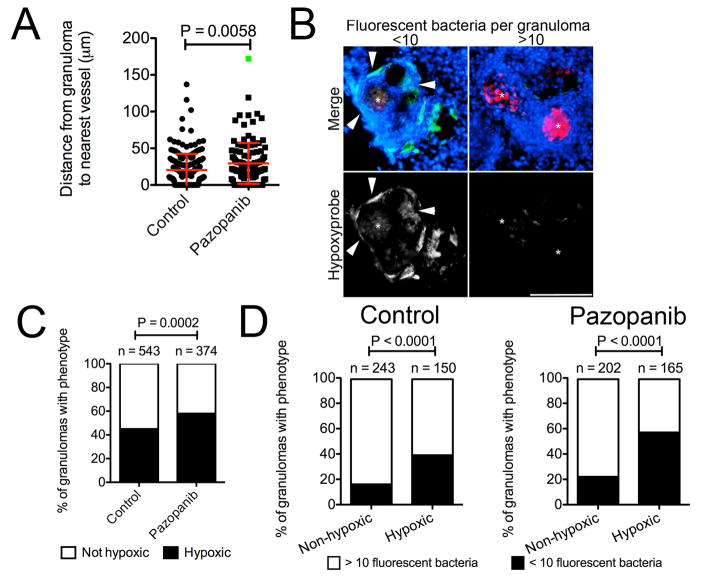
(A) Distance between granulomas and nearest vasculature measured in 6 wpi adult Tg(flk1:EGFP) zebrafish. Total number of zebrafish analysed = 4 (control), 4 (pazopanib). Green dot indicates outlier that was omitted from statistical analysis.
(B) Images of (left) low burden/hypoxic and (right) high burden/non-hypoxic granulomas in zebrafish that were injected with pimonidazole. Asterisks indicate M.marinum-tomato, arrows indicate areas of hypoxia in granuloma. Images are representative of data in Figure 4D, Extended Data 7C and Extended Data 7D.
(C) Comparison of granulomas between control and pazopanib treated adult zebrafish scored for pimonidazole staining. Total number of zebrafish analysed = 4 (control), 4 (pazopanib).
(D) Comparison of granulomas between non-hypoxic and hypoxic granulomas in control and pazopanib treated adult zebrafish scored for M. marinum burden. Total number of zebrafish analysed = 4 (control), 4 (pazopanib).
Scale bars indicate 100 μm. Error bars represent mean ± standard deviation.
Supplementary Material
Acknowledgments
We thank D. Sisk and J. Saelens for technical assistance, L. Ramakrishnan, P. Edelstein and C. Kontos for helpful discussions, L. Ramakrishnan, W. Britton, and J. Coers for critical review of the manuscript, and J. Fuller, C. Gallione, E. Linney, H. Mao, S. Lee, D. Marchuk, H. Matsunami, A. Nixon, J. Perfect, J. Rawls, D. Silver, K. Smith, K. Takaki, J. Tenor, B. Uy for reagents and equipment. This work was funded by an Australian National Health and Medical Research Council CJ Martin Early Career Fellowship (S.H.O); an American Cancer Society Postdoctoral Fellowship PF-13-223-01-MPC (M.R.C); the Duke Summer Research Opportunities Program (N.R.S.); a Malaysian Ministry of Science and Technology and Innovation scholarship (K.S.O); a New Zealand Ministry of Science and Innovation grant UOAX0813 (P.S.C.); the Duke University Center for AIDS Research (CFAR), an NIH funded program (5P30 AI064518), and by a Mallinckrodt Scholar Award, a Searle Scholar Award, a Vallee Foundation Young Investigator Award and an NIH Director’s New Innovator Award 1DP2-OD008614 (D.M.T).
Footnotes
AUTHOR CONTRIBUTIONS
S.H.O. and D.M.T. designed the experiments and wrote the paper. S.H.O., N.R.S., M.I.T. and K.S.O. performed and analysed the experiments. M.R.C., E.M.W and R.W.B generated transgenic zebrafish lines. S.H.O., P.S.C. and D.M.T. supervised the project.
The authors have no competing financial interests.
References
- 1.Ernst JD. The immunological life cycle of tuberculosis. Nat Rev Immunol. 2012;12:581–591. doi: 10.1038/nri3259. [DOI] [PubMed] [Google Scholar]
- 2.Ramakrishnan L. Revisiting the role of the granuloma in tuberculosis. Nat Rev Immunol. 2012;12:352–366. doi: 10.1038/nri3211. [DOI] [PubMed] [Google Scholar]
- 3.Freeman CD, Klutman NE, Lamp KC. Metronidazole. A therapeutic review and update. Drugs. 1997;54:679–708. doi: 10.2165/00003495-199754050-00003. [DOI] [PubMed] [Google Scholar]
- 4.Rittershaus ES, Baek SH, Sassetti CM. The normalcy of dormancy: common themes in microbial quiescence. Cell Host Microbe. 2013;13:643–651. doi: 10.1016/j.chom.2013.05.012. [DOI] [PMC free article] [PubMed] [Google Scholar]
- 5.Folkman J. Role of angiogenesis in tumor growth and metastasis. Seminars in oncology. 2002;29:15–18. doi: 10.1053/sonc.2002.37263. [DOI] [PubMed] [Google Scholar]
- 6.Tsai MC, et al. Characterization of the tuberculous granuloma in murine and human lungs: cellular composition and relative tissue oxygen tension. Cell Microbiol. 2006;8:218–232. doi: 10.1111/j.1462-5822.2005.00612.x. [DOI] [PubMed] [Google Scholar]
- 7.Aly S, et al. Interferon-gamma-dependent mechanisms of mycobacteria-induced pulmonary immunopathology: the role of angiostasis and CXCR3-targeted chemokines for granuloma necrosis. J Pathol. 2007;212:295–305. doi: 10.1002/path.2185. [DOI] [PubMed] [Google Scholar]
- 8.Ulrichs T, et al. Differential organization of the local immune response in patients with active cavitary tuberculosis or with nonprogressive tuberculoma. J Infect Dis. 2005;192:89–97. doi: 10.1086/430621. [DOI] [PubMed] [Google Scholar]
- 9.Davis JM, et al. Real-time visualization of mycobacterium-macrophage interactions leading to initiation of granuloma formation in zebrafish embryos. Immunity. 2002;17:693–702. doi: 10.1016/s1074-7613(02)00475-2. [DOI] [PubMed] [Google Scholar]
- 10.Jin SW, Beis D, Mitchell T, Chen JN, Stainier DY. Cellular and molecular analyses of vascular tube and lumen formation in zebrafish. Development. 2005;132:5199–5209. doi: 10.1242/dev.02087. [DOI] [PubMed] [Google Scholar]
- 11.Davis JM, Ramakrishnan L. The role of the granuloma in expansion and dissemination of early tuberculous infection. Cell. 2009;136:37–49. doi: 10.1016/j.cell.2008.11.014. [DOI] [PMC free article] [PubMed] [Google Scholar]
- 12.Dirkx AE, Oude Egbrink MG, Wagstaff J, Griffioen AW. Monocyte/macrophage infiltration in tumors: modulators of angiogenesis. J Leukoc Biol. 2006;80:1183–1196. doi: 10.1189/jlb.0905495. [DOI] [PubMed] [Google Scholar]
- 13.Rhodes J, et al. Interplay of pu.1 and gata1 determines myelo-erythroid progenitor cell fate in zebrafish. Dev Cell. 2005;8:97–108. doi: 10.1016/j.devcel.2004.11.014. [DOI] [PubMed] [Google Scholar]
- 14.Clay H, et al. Dichotomous role of the macrophage in early Mycobacterium marinum infection of the zebrafish. Cell Host Microbe. 2007;2:29–39. doi: 10.1016/j.chom.2007.06.004. [DOI] [PMC free article] [PubMed] [Google Scholar]
- 15.Volkman HE, et al. Tuberculous granuloma formation is enhanced by a mycobacterium virulence determinant. PLoS Biol. 2004;2:e367. doi: 10.1371/journal.pbio.0020367. [DOI] [PMC free article] [PubMed] [Google Scholar]
- 16.Aprelikova O, et al. Regulation of HIF prolyl hydroxylases by hypoxia-inducible factors. Journal of cellular biochemistry. 2004;92:491–501. doi: 10.1002/jcb.20067. [DOI] [PubMed] [Google Scholar]
- 17.Santhakumar K, et al. A zebrafish model to study and therapeutically manipulate hypoxia signaling in tumorigenesis. Cancer Res. 2012;72:4017–4027. doi: 10.1158/0008-5472.CAN-11-3148. [DOI] [PubMed] [Google Scholar]
- 18.Elks PM, et al. Hypoxia Inducible Factor Signaling Modulates Susceptibility to Mycobacterial Infection via a Nitric Oxide Dependent Mechanism. PLoS Pathog. 2013;9:e1003789. doi: 10.1371/journal.ppat.1003789. [DOI] [PMC free article] [PubMed] [Google Scholar]
- 19.Via LE, et al. Tuberculous granulomas are hypoxic in guinea pigs, rabbits, and nonhuman primates. Infect Immun. 2008;76:2333–2340. doi: 10.1128/IAI.01515-07. [DOI] [PMC free article] [PubMed] [Google Scholar]
- 20.Lin PL, et al. Metronidazole prevents reactivation of latent Mycobacterium tuberculosis infection in macaques. Proc Natl Acad Sci U S A. 2012 doi: 10.1073/pnas.1121497109. [DOI] [PMC free article] [PubMed] [Google Scholar]
- 21.Forsythe JA, et al. Activation of vascular endothelial growth factor gene transcription by hypoxia-inducible factor 1. Mol Cell Biol. 1996;16:4604–4613. doi: 10.1128/mcb.16.9.4604. [DOI] [PMC free article] [PubMed] [Google Scholar]
- 22.Matsuyama W, et al. Increased serum level of vascular endothelial growth factor in pulmonary tuberculosis. Am J Respir Crit Care Med. 2000;162:1120–1122. doi: 10.1164/ajrccm.162.3.9911010. [DOI] [PubMed] [Google Scholar]
- 23.Saita N, Fujiwara N, Yano I, Soejima K, Kobayashi K. Trehalose 6,6′-dimycolate (cord factor) of Mycobacterium tuberculosis induces corneal angiogenesis in rats. Infect Immun. 2000;68:5991–5997. doi: 10.1128/iai.68.10.5991-5997.2000. [DOI] [PMC free article] [PubMed] [Google Scholar]
- 24.Nasevicius A, Larson J, Ekker SC. Distinct requirements for zebrafish angiogenesis revealed by a VEGF-A morphant. Yeast. 2000;17:294–301. doi: 10.1002/1097-0061(200012)17:4<294::AID-YEA54>3.0.CO;2-5. [DOI] [PMC free article] [PubMed] [Google Scholar]
- 25.Dvorak HF, Brown LF, Detmar M, Dvorak AM. Vascular permeability factor/vascular endothelial growth factor, microvascular hyperpermeability, and angiogenesis. Am J Pathol. 1995;146:1029–1039. [PMC free article] [PubMed] [Google Scholar]
- 26.Podar K, et al. The small-molecule VEGF receptor inhibitor pazopanib (GW786034B) targets both tumor and endothelial cells in multiple myeloma. Proc Natl Acad Sci U S A. 2006;103:19478–1948. doi: 10.1073/pnas.0609329103. [DOI] [PMC free article] [PubMed] [Google Scholar]
- 27.Fong TA, et al. SU5416 is a potent and selective inhibitor of the vascular endothelial growth factor receptor (Flk-1/KDR) that inhibits tyrosine kinase catalysis, tumor vascularization, and growth of multiple tumor types. Cancer Res. 1999;59:99–106. [PubMed] [Google Scholar]
- 28.Tobin DM, et al. The lta4h Locus Modulates Susceptibility to Mycobacterial Infection in Zebrafish and Humans. Cell. 2010;140:717–730. doi: 10.1016/j.cell.2010.02.013. [DOI] [PMC free article] [PubMed] [Google Scholar]
- 29.Carroll MW, et al. Efficacy and safety of metronidazole for pulmonary multidrug-resistant tuberculosis. Antimicrob Agents Chemother. 2013;57:3903–3909. doi: 10.1128/AAC.00753-13. [DOI] [PMC free article] [PubMed] [Google Scholar]
- 30.Opie EL, Aronson JD. Tubercle bacilli in latent tuberculous lesions and in lung tissue without tuberculous lesions. Arch Pathol Lab Med. 1927;4:1–21. [Google Scholar]
- 31.Thisse C, Thisse B. High-resolution in situ hybridization to whole-mount zebrafish embryos. Nat Protoc. 2008;3:59–69. doi: 10.1038/nprot.2007.514. [DOI] [PubMed] [Google Scholar]
- 32.Liang D, et al. Cloning and characterization of vascular endothelial growth factor (VEGF) from zebrafish, Danio rerio. Biochim Biophys Acta. 1998;1397:14–20. doi: 10.1016/s0167-4781(97)00233-9. [DOI] [PubMed] [Google Scholar]
- 33.Ellett F, Pase L, Hayman JW, Andrianopoulos A, Lieschke GJ. mpeg1 promoter transgenes direct macrophage-lineage expression in zebrafish. Blood. 2010;117:e49–56. doi: 10.1182/blood-2010-10-314120. [DOI] [PMC free article] [PubMed] [Google Scholar]
- 34.Kwan KM, et al. The Tol2kit: a multisite gateway-based construction kit for Tol2 transposon transgenesis constructs. Dev Dyn. 2007;236:3088–3099. doi: 10.1002/dvdy.21343. [DOI] [PubMed] [Google Scholar]
- 35.Goedhart J, et al. Structure-guided evolution of cyan fluorescent proteins towards a quantum yield of 93% Nat Commun. 2012;3:751. doi: 10.1038/ncomms1738. [DOI] [PMC free article] [PubMed] [Google Scholar]
- 36.Kim JH, et al. High cleavage efficiency of a 2A peptide derived from porcine teschovirus-1 in human cell lines, zebrafish and mice. PLoS ONE. 2011;6:e18556. doi: 10.1371/journal.pone.0018556. [DOI] [PMC free article] [PubMed] [Google Scholar]
- 37.Balciunas D, et al. Harnessing a high cargo-capacity transposon for genetic applications in vertebrates. PLoS Genet. 2006;2:e169. doi: 10.1371/journal.pgen.0020169. [DOI] [PMC free article] [PubMed] [Google Scholar]
- 38.Curado S, Stainier DY, Anderson RM. Nitroreductase-mediated cell/tissue ablation in zebrafish: a spatially and temporally controlled ablation method with applications in developmental and regeneration studies. Nat Protoc. 2008;3:948–954. doi: 10.1038/nprot.2008.58. [DOI] [PMC free article] [PubMed] [Google Scholar]
Associated Data
This section collects any data citations, data availability statements, or supplementary materials included in this article.


