Abstract
Recent evidence indicates that the spontaneous action potential (AP) of isolated sinoatrial node cells (SANC) is regulated by a system of stochastic mechanisms embodied within two clocks: ryanodine receptors of the “Ca2+ clock” within the sarcoplasmic reticulum, spontaneously activate during diastole and discharge local Ca2+ releases (LCRs) beneath the cell surface membrane; clock crosstalk occurs as LCRs activate an inward Na+/Ca2+ exchanger current (INCX), which together with If and decay of K+ channels prompts the “M clock,” the ensemble of sarcolemmal-electrogenic molecules, to generate APs. Prolongation of the average LCR period accompanies prolongation of the average AP beating interval (BI). Moreover, prolongation of the average AP BI accompanies increased AP BI variability. We hypothesized that both the average AP BI and AP BI variability are dependent upon stochasticity of clock mechanisms reported by the variability of LCR period.
We perturbed the coupled-clock system by directly inhibiting the M clock by ivabradine (IVA) or the Ca2+ clock by cyclopiazonic acid (CPA). When either clock is perturbed by IVA (3, 10 and 30μM), which has no direct effect on Ca2+ cycling, or CPA ( 0.5 and 5μM), which has no direct effect on the M clock ion channels, the clock system failed to achieve the basal AP BI and both AP BI and AP BI variability increased. The changes in average LCR period and its variability in response to perturbations of the coupled-clock system were correlated with changes in AP beating interval and AP beating interval variability. We conclude that the stochasticity within the coupled-clock system affects and is affected by the AP BI firing rate and rhythm via modulation of the effectiveness of clock coupling.
Keywords: Ca2+ cycling, ion channels, physiology, sarcoplasmic reticulum, sinoatrial nodal pacemaker cells
1. Introduction
The spontaneous action potential (AP) beating interval (BI) of single isolated sinoatrial node cells (SANC) under basal conditions is neither strictly stationary nor completely random, and continuously shifts from one period to another [1–4]. In fact, there is evidence that pacemaker mechanisms intrinsic to SANC play a role in heart rate variability (HRV) (reviewed in [5]), a reduction of which is associated with an increase in morbidity and mortality in patients with cardiac diseases [6]. It has been suggested that AP beating interval variability (BIV) is attributed to stochastic properties of ion channels, components of the M clock [3].
Recent evidence indicates that the average AP BI of isolated SANC is regulated by a coupled-clock system [7]: during diastolic depolarization, a “Ca2+ clock” within the sarcoplasmic reticulum (SR) discharges local Ca2+ releases (LCRs) close to the cell surface membrane that activate the Na+/Ca2+ exchanger. Na+-Ca2+ exchange current, the f-channel current, and K+ channel current, other members of the ensemble of sarcolemmal electrogenic molecules (“M clock”), concurrently drive the diastolic membrane depolarization to ignite the next AP. The occurrence of an AP synchronizes global ryanodine receptor (RyR) activation. Spontaneous local RyR activation begins to occur during the following diastolic depolarization. LCR periods (i.e., the times of LCR occurrences following the prior AP) are variable, but on average are roughly periodic [8, 9]. Spontaneous local RyR activity that generates LCRs is regulated by both the level of Ca2+ cycling, and by the phosphorylation states of proteins that drive biophysical mechanisms that couple the pacemaker cells’ M and Ca2+ clocks (reviewed in [10]). Among such proteins are SR (phospholamban (PLB) and ryanodine receptors) and M clock proteins (L type and K+ channels). The protein phosphorylation level is regulated by Ca2+ activation of calmodulin-adenylyl cyclase (AC)-dependent protein kinase A (PKA) and Ca2+/calmodulin-dependent protein kinase II (CaMKII).
A reduction in basal intracellular Ca2+ or in the activity of Ca2+-dependent phosphorylation mechanisms decreases spontaneous RyR activation, leading to a lower ensemble LCR Ca2+ signal that occurs later during diastole [11]. Based on the coupled-clock theory the net result of this reduction in LCR Ca2+ signal is less effective activation of NCX and other M clock proteins that are modulated by Ca2+. It has been demonstrated that the average LCR period of the coupled-clock system is related to the average AP BI [12]. Other studies have shown that when the average AP BI becomes prolonged, the AP BIV increases [1]. We hypothesized that both the average AP BI and AP BI variability are dependent upon stochasticity of clock mechanisms reported by the variability of LCR period.
To unravel clock-crosstalk effects on AP BI and AP BIV, we perturbed clock function by directly inhibiting either the M or Ca2+ clock, confirming that the other clock was not directly inhibited, and measured AP BIV and LCR period variability as well as the average AP BI and LCR period. To inhibit the M clock, we employed a range of concentrations of ivabradine (IVA), an If inhibitor, and to inhibit the Ca2+ clock, we employed a range of concentrations of cyclopiazonic acid (CPA), a SR Ca2+ pump inhibitor. Our results revealed that inhibition of either clock produces a similar increase in AP BI, AP BIV, and LCR period and LCR period variability. This increased variability of LCR periods is correlated with the increased AP BIV. These results indicate that while the M and Ca2+ clocks remain coupled in response to either clock perturbation, the perturbed clock system cannot maintain average basal AP BI and LCR period. The increases in average AP BI and LCR period are linked to increases in AP BIV and LCR variability that are due to the effectiveness of clock coupling. Therefore, our results provide new evidence that modulation of the stochasticity inherent to clock mechanisms regulates both pacemaker cell rate and rhythm.
2. Methods
The experimental protocols have been approved by the Animal Care and Use Committee of the National Institutes of Health (protocol #034LCS2013). We superfused single, isolated rabbit SANC with IVA (3, 10 or 30 μM), a direct surface membrane ion channel blocker, or CPA (0.5 or 5 μM), a direct and specific inhibitor of Ca2+ pumping by SERCA2. We measured AP BI, AP BIV, cytosolic Ca2+, SR Ca2+ load and LCR characteristics during diastolic depolarization in spontaneously beating SANC. To prove that IVA or CPA directly affects only the M or Ca2+ clock, respectively, we measured If and ICa,L in voltage-clamped SANC in response to a high concentration of CPA and measured LCR characteristics in permeabilized SANC in response to IVA. A detailed description of the experimental methods is available in the Online Data Supplement.
3. Results
3.1 IVA directly and selectively affects only the M clock and CPA directly and selectively suppresses the intracellular Ca2+clock
To test the hypotheses that average AP BI, AP BIV, average LCR period and LCR period variability regulate and are regulated by stochasticity within coupled-clock mechanisms, we directly perturbed either the M or Ca2+ clock. We then determined the extent to which direct inhibition of each clock affects the coupled-clock mechanism function.
It is essential to demonstrate at the outset that perturbation of a given clock has no direct effect on the other clock. We employed IVA to directly perturb the M clock functions. We used 3 different concentrations of IVA: 3 μM, demonstrated previously to selectively inhibit the funny current and no other M clock component [13, 14]; 10 μM, demonstrated previously to directly inhibit both the L-type channels as well as the funny current [13, 14]; and 30 μM, which also inhibits both the funny current and L-type channels and induces the maximum drug-induced reduction in AP firing rate in SANC [14]. Although the two higher concentrations directly affect only the membrane clock, our goal was to use a drug that directly gradually inhibits only components of the M clock, and not of the Ca2+ clock, per se. In order to prove that IVA does not directly suppress Ca2+ clock function, we examined the effects of IVA on SR Ca2+ cycling by measuring LCR characteristics in permeabilized SANC. IVA did not significantly change LCR frequency (number of LCRs for 100 μm in 1 sec), duration, amplitude and size (Fig. S1). Moreover, neither the Ca2+ signal of individual LCRs nor the LCR ensemble Ca2+ signal significantly changed in response to any concentration of IVA (Table S1). Because IVA at concentrations from 3 to 30 μM did not significantly affect LCR characteristics (Fig. S1, Table S1), it, therefore, did not have a direct effect to suppress SR Ca2+ cycling. Changes in SR Ca2+ cycling that accompany a prolongation of the average AP BI induced by IVA are indirect, and occur via clock crosstalk [7].
We employed CPA to directly perturb the Ca2+ clock and not directly the M clock. We used 2 different concentrations of CPA: 0.5 μM, demonstrated previously to increase the average AP BI to the same degree as 3 μM IVA [7]; and 5 μM, which induces the maximum increase in AP BI in SANC [15]. We measured the direct effect of CPA on the Ca2+ clock by measuring LCR characteristics in permeabilized SANC. In contrast to IVA, both concentrations of CPA significantly changed LCR frequency (number of LCRs for 100 μm in 1 sec), duration, amplitude and size (Fig. S2). Moreover, the Ca2+ signal of individual LCRs and the LCR ensemble Ca2+ signal significantly changed in response to different concentrations of CPA (Table S1). To prove that CPA directly and selectively inhibits SR Ca2+ cycling, and does not directly suppress ion channels crucial to membrane clock function, we examined the effects of 5 μM CPA on ICa,L and If in voltage-clamped SANC. Representative examples of the CPA effect on ICa,L, measured at −5 mV, and the average effect on the I–V relationship of ICa,L are presented in Figures S3A and S3B, respectively. Average ICa,L characteristics are listed in Table S2. Peak ICa,L in voltage-clamped cells, in the presence of 5μM CPA, did not differ from control (−12.9±1 vs −13.1±2 pA/pF, n=8). Moreover, in voltage-clamped SANC, 5μM CPA did not affect peak If amplitude or its kinetics (Table S3, Figure S3C–D). Therefore, CPA selectively and directly inhibits SR Ca2+ cycling and does not directly affect the M clock. The effect of CPA in prolonging the AP BI is due to clock crosstalk between LCRs and INCX [7].
3.2 Direct and specific perturbations of the SANC M or Ca2+ clock similarly affect spontaneous AP BI
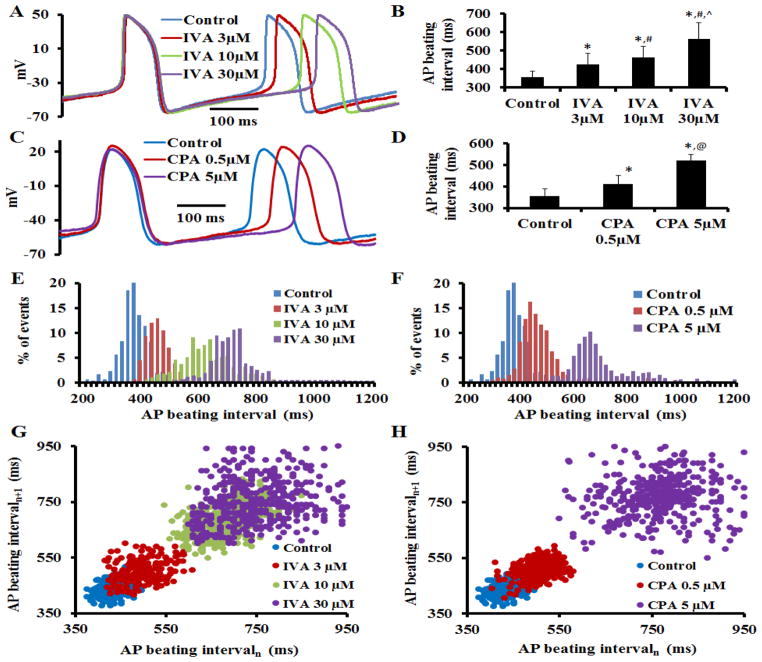
To determine the effect of M clock inhibition (IVA) on AP BI and AP parameters, we superfused single SANC with different concentrations of IVA; each cell was superfused with only one IVA concentration (3, 10, 30 μM) for 10 min. Representative examples of APs and average AP BI are illustrated in Figure 1A–B, respectively. AP parameters in control and in the presence of IVA are summarized in Table S4. On average (n=7 for each concentration) IVA increased the AP BI by 16±2% at 3μM; by 23±4% at 10μM; and by 36±8% at 30μM. In time-control experiments in the absence of drug (n=7), the time-dependent increase in AP BI was only 4±3% (Table S4).
Figure 1. Coupled-clock mechanisms prolongs the spontaneous AP beating interval and increases AP beating interval variability.
(A) Representative AP recordings and (B) average changes in the rate of AP firing in the presence of IVA (n=7 for 3, 10 and 30 μM). (C) Representative AP recordings and (D) average changes in the rate of AP firing in the presence of CPA (n=7 for 0.5, 5 μM). Representative distribution of beating intervals in control and in response to (E) IVA or (F) CPA. Poincaré plots of the beating interval in control and in response to (G) IVA or (H) CPA. *p<0.05 vs. control, #p<0.05 vs. IVA 3μM, ^p<0.05 vs. IVA 10μM, and @p<0.05 vs. CPA 5μM.
Fig. 1C illustrates the effects of CPA on AP BI in a representative SANC. Fig. 1D shows that, on average (n=7 for each concentration), a direct effect on intracellular Ca2+ cycling by CPA was accompanied by an increase in the average spontaneous AP BI (by 18±5% for 0.5μM CPA; by 43±3% for 5μM CPA), i.e., reaching matching AP firing rate reduction effects by low or high IVA concentrations.
3.3 Clock inhibition- induced prolongation of AP BI and an increase in AP BIV
We further investigated whether increases in average AP BI in response to M or Ca2+ clock inhibition were accompanied by changes in AP BIV. Figs. 1E–F illustrate representative examples of the beating interval histograms in the presence of an M clock blocker (IVA) or Ca2+ clock blocker (CPA), respectively. As the IVA or CPA concentration increases, the beating intervals become more scattered around the mean. Poincaré plots (Fig. 1G–H), in which each beating cycle length is plotted against its predecessor, display the scattering between consecutive AP intervals and depict the magnitude of the AP BIV. M or Ca2+ clock blockade increased the scattering pattern of the points within the Poincaré plot compared to control. The increase in scattering around the mean clearly indicates an increase in AP BIV, i.e., a reduction in the extent to which AP BIs are synchronized. This increased AP BIV in response to M or Ca2+ clock inhibition is also clearly demonstrated by AP BIV time-domain variability parameters (SDNN, RMSSD, CV, pNN50, Table S5, see on-line supplement for definitions). Note also that the approximate entropy of the beating interval increases as the average AP BI and AP BIV increase (Table S5). Therefore, the increase in AP BI in response to either M or Ca2+ clock inhibition is accompanied by an increase in AP BIV.
Fig. 2 illustrates that the relationship of the average AP BI to AP BIV, quantified by coefficient of variation (panel A) or approximate entropy (panel B). The average AP BIV to the average AP BI prior to and in response to different concentrations of either IVA or CPA conforms to similar non-linear parabolic functions. Therefore, the average AP BI and AP BIV are integrated functions of the coupled-clock system and are tightly linked.
Figure 2. The relationship between changes in spontaneous AP beating interval and AP beating interval variability induced by IVA and CPA.
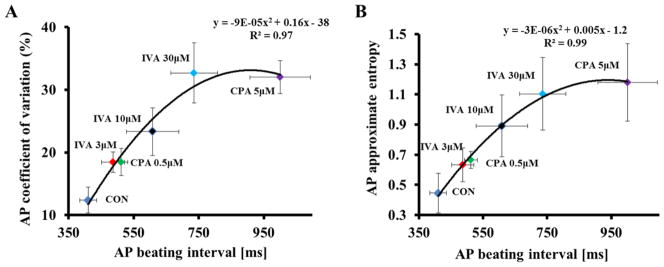
The relationship between average AP BIV quantified by coefficient of variation (A) or approximate entropy (B) to the average AP BI prior to and in response to either different concentrations of IVA or different concentrations of CPA.
3.4 AP BIV and average AP BI are linked to coupled-clock period variability and the average coupled-clock period
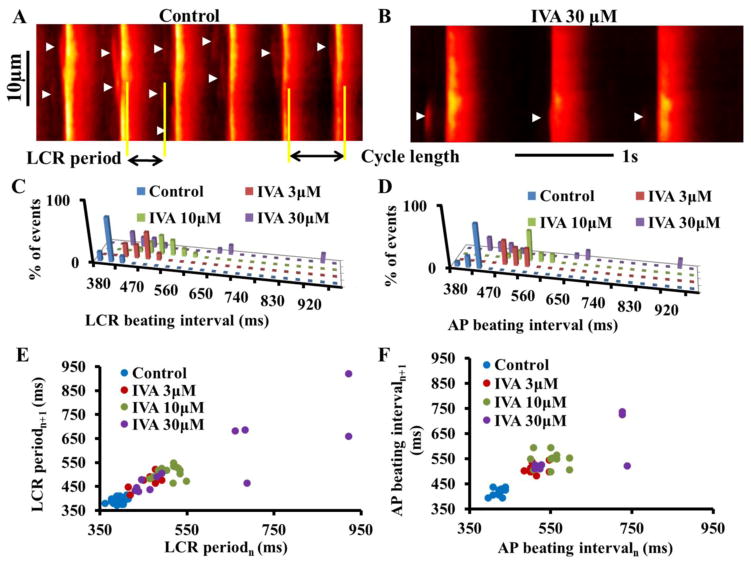
To determine if M clock inhibition to prolong the SANC AP BI is accompanied by an indirect effect on intracellular Ca2+ cycling, we measured Ca2+ in an additional subset of SANC loaded with Fluo 4-AM. Figure 3A illustrates the AP-induced Ca2+ transient and spontaneous diastolic LCRs (arrows) in a representative SANC in control. The interval between spontaneous Ca2+ transients reports accurately the interval between spontaneous APs that induce these Ca2+ transients [16]. Therefore, the interval between Ca2+ transient peaks reports the AP BIs [16]. IVA prolonged the average AP BI and AP BIV in this subset of SANC loaded with florescence indicator (Table S6) to a similar extent as in the non-loaded cells (Table S1).
Figure 3. Prolongation of AP beating interval by IVA indirectly affects the LCR period and LCR period variability.
Confocal line scan images of Ca2+ in a representative SANC (A) in control and (B) in response to 30μM IVA. LCRs are indicated by arrowheads. The LCR period is defined as the time from the peak of the prior AP-induced Ca2+ transient to an LCR onset. Distribution of (C) LCR period and (D) AP beating interval in control and in response to IVA in a representative cell. Poincaré plots of (E) the LCR period and (F) the AP beating interval in control and in response to IVA.
Rate and rhythm of the coupled-clock period
Coupling of the M and Ca2+ clock functions determines the average spatial-temporal characteristics of diastolic LCRs [7]. The effects of IVA on LCR characteristics are listed in Table S7. As the IVA concentration increases the LCR size, duration and the average number of LCRs (normalized to 100 μm cell length and 1-s time interval) become progressively reduced. The LCR period, defined as the time from the peak Ca2+ transient (the onset SR Ca2+ release triggered by the prior AP) to the LCR onset (as illustrated in Fig. 3A), was progressively prolonged as IVA concentration increased. In the same cell, note that the LCR intervals became significantly more scattered around a prolonged mean as the IVA concentration increased. Note in the representative example that both the distribution of the LCR periods and that of the AP BI shifted to the right as IVA concentration increased (Fig. 3C–D). The distributions of LCR periods around the mean and the distributions of the AP BIs around their mean do not statistically differ (Kolmogorov-Smirnov test of z2 value; see on-line supplement) in control or in response to different concentrations of IVA. These results indicate that, in conjunction with its effect to prolong the AP BI and increase the AP BIV, M clock inhibition by IVA concomitantly indirectly regulates the Ca2+ clock, and the LCR period, a readout of the coupled-clock system function, was prolonged. The number of LCRs recorded under these experimental conditions was less than the minimum needed for statistical analysis of BIV time-domain parameters. However, the increase in LCR period variability is clearly reflected in the Poincaré plots (Fig. 3D). M or Ca2+ clock inhibition increased the scattering pattern of the points within the Poincaré plot compared to control. The changes in AP BI scattering (Fig. 3E) in Poincaré plot of cells loaded with fluorescent indicator is similar to that in the non-loaded cells (Fig 1G).
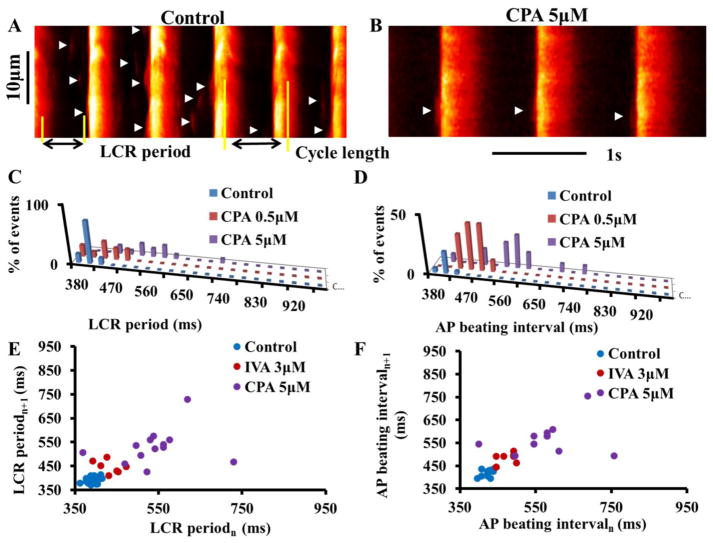
The direct effects of CPA on LCR characteristics were similar to the indirect effect on LCRs in response to IVA (Table S6 and Fig. 4). Note also that the distributions of LCR periods around the mean do not differ from the distributions of the BIs around their mean (Kolmogorov-Smirnov test, see on-line supplement) in control or in response to different concentrations of CPA.
Figure 4. CPA directly affects the LCR period and LCR period variability.
Confocal line scan images of Ca2+ in a representative SANC (A) in control and (B) in response to 5μM CPA. LCRs are indicated by arrowheads. The LCR period is defined as the time from the peak of the prior AP-induced Ca2+ transient to an LCR onset. Distribution of (C) LCR period and (D) AP beating interval in control and in response to CPA in a representative cell. Poincaré plots of (E) the LCR period and (F) the AP beating interval in control and in response to CPA.
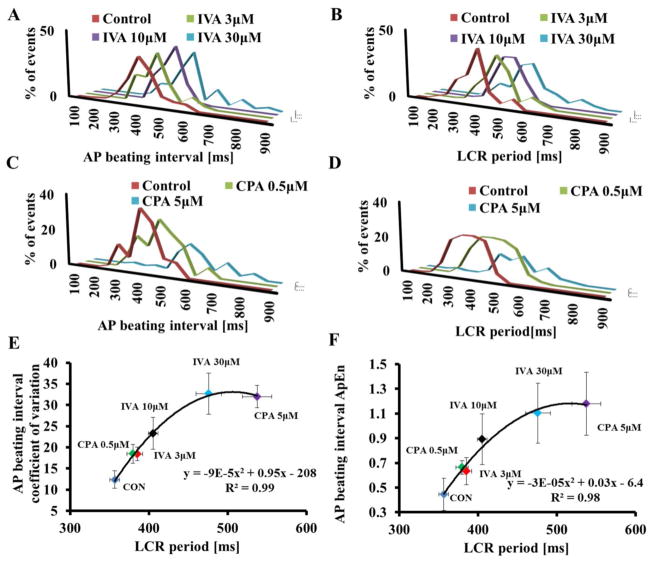
Fig. 5A–D illustrates the average LCR interval and average AP BI histograms in the presence of M clock inhibition (IVA) and Ca2+ clock inhibition (CPA) recorded in a group of cells under these protocols. Note also that the distribution of LCR periods around the mean do not differ from the distribution of the BIs around their mean under this protocol. The average AP BIV, quantified by coefficient of variation (panel 5E) or approximate entropy (panel 5F) in control and in response to either different concentrations of IVA or CPA, is correlated with the average LCR period. The relationship of LCR period to AP BI in response to these perturbations (IVA or CPA) conforms to a nonlinear parabolic line (Fig. 5) strictly similar to the relationship between AP BIV and AP BI (Fig. 2)
Figure 5. Effect of clock uncoupling by IVA or CPA on LCR period variability.
(A) AP-induced Ca2+ transient beating interval and (B) LCR period distributions (n=12 cells for each drug concentration, 121, 77 and 65 LCRs for 3, 10 and 30μM IVA, respectively). (C) AP-induced Ca2+ transient beating interval and (D) LCR period distribution in control (n=12 cells, 152 LCRs) and the presence of 0.5 μM CPA (n=12 cells, 114 LCRs), or 0.5 μM CPA (n=12 cells, 58 LCRs). The relationship between the average AP BIV, quantified by coefficient of variation (E) or as approximate entropy (F) to the LCR period prior to and in response to different concentrations of either IVA or CPA.
IVA and CPA effects on the AP-induced Ca2+ transient characteristics
Table S6 lists the average characteristics of the AP-induced Ca2+ transients prior to and in the present of drugs. Although the peak systolic Ca2+ transient (amplitude) and time to peak Ca2+ were not significantly altered in conjunction with the prolongation of the spontaneous AP BI in response to IVA, the 90% decay time of intracellular Ca2+ (T-90c) was significantly prolonged. Because T-90c is an index of SR Ca2+ pumping kinetics [15], which are modulated by the status of PLB phosphorylation, we measured whether the increase in both AP BI and AP BIV in response to IVA at the ser 16 site is accompanied by a reduction in PLB phosphorylation. There was a trend for IVA at 3 μM to reduce the phosphorylation state at the PLB ser 16 site, which became significantly reduced at concentrations of IVA above 10 μM (Fig. S4).
Direct perturbation of the Ca2+ clock by CPA has effects similar to those of IVA on AP- induced Ca2+ transients. Specifically, the increase in spontaneous AP BI in response to CPA is accompanied by a prolongation of T-90c.
3.5 Changes in the rate of SR Ca2+ refilling are correlated with AP BI and AP BIV
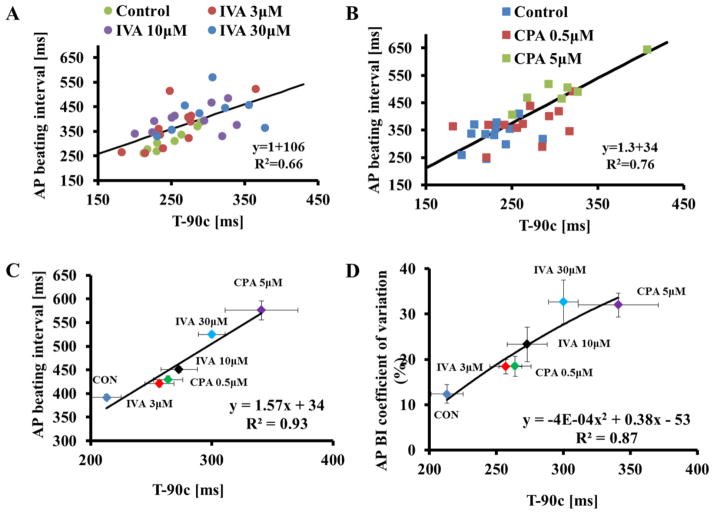
A prolongation of T-90c indicates a reduction in the rate at which the SR refills with Ca2+ [15]. Because 1) IVA and CPA both prolong the T-90c (Fig. 6), 2) and both IVA and CPA prolong the LCR period and 3) because LCR period is linked to the AP BIV in response to either M or Ca2+ clock perturbations, we hypothesized that IVA- and CPA-induced prolongation of the T-90c would be correlated with AP BI and AP BIV. Indeed, Fig. 6A–C demonstrates that the AP BI prolongation prior to and in response to either different concentrations of IVA (panel A) or different concentrations of CPA (panel B) is highly correlated with changes in T-90c. Moreover, the T-90c is also correlated with the average coefficient of variation of AP (panel D).
Figure 6. Both CPA and IVA increase the SR Ca2+ refilling time.
The T-90c in control or in the presence of (A) IVA or (B) CPA is correlated with the average AP cycle length. The relationship between (C) average AP beating interval and (D) average AP beating interval variability (quantified by the coefficient of variation) to T-90c prior to and in response to different concentrations of either IVA or CPA.
3.6 Changes in SR Ca2+ content are correlated with AP BI and AP BIV
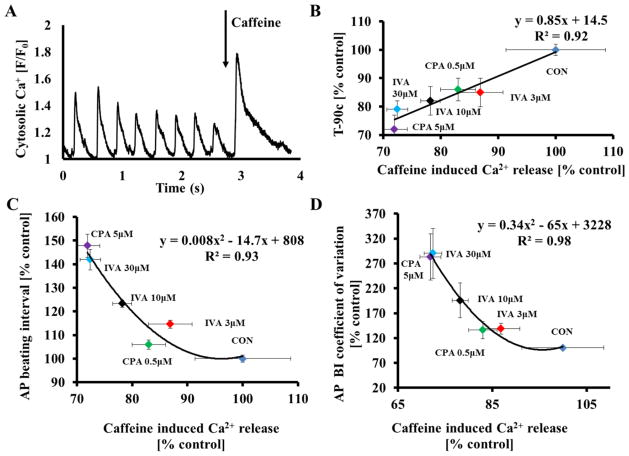
Because prolongation of the AP BI by IVA or CPA results in a reduction of Ca2+ influx which likely reduces the SR Ca2+ content, we tested whether SR Ca2+ load is reduced in response to IVA or CPA. To estimate the SR Ca2+ content, brief, rapid pulses of caffeine were applied (“spritzed”) onto control cells and cells in the presence of drug (Fig. 7A). IVA, at 3 μM, tended to reduce the peak amplitude of the caffeine-induced Ca2+ transient, but only concentrations of IVA above 10 μM significantly reduced it (Fig. S5A). CPA had similar effects as IVA on caffeine-induced Ca2+ release (Fig. S5B).
Figure 7. Both CPA and IVA reduce SR Ca2+ load.
(A) Representative example of the effects of a rapid application of caffeine onto a SANC. (B) The relationship between changes in the average T-90c and caffeine-induced Ca2+ release. The relationship between (C) average AP beating interval and (D) average AP beating interval variability to caffeine-induced Ca2+ release, quantified by coefficient of variation, prior to and in response to different concentrations of either IVA or of CPA.
As hypothesized, the prolongation of T-90c is highly correlated with a reduction in the SR Ca2+ load (Fig. 7B). The AP BIs in control and in response to IVA or CPA are also correlated with changes in SR Ca2+ load in response to these drugs (Fig. 7C). Furthermore, changes in average caffeine-induced Ca2+ release are also correlated with increases in the coefficient of variation of AP prior to and in response to these drugs (Fig. 7D).
3.7 Coupled-clock function controls T-90c, LCR period and AP BI
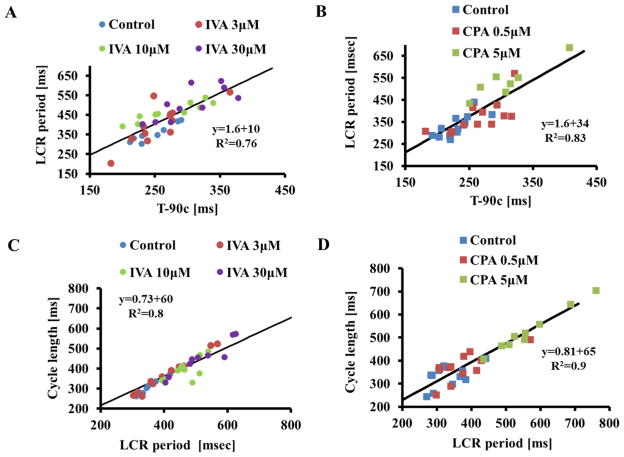
The average T-90c prior to and in response to either different concentrations of IVA (Fig. 8A) or CPA (Fig. 8B) is a linear function of the LCR period. The average AP BI prior to and in response to either different concentrations of IVA (Fig. 8C) or different concentrations of CPA (Fig. 8D) is predicted by the concurrent average LCR period. The average LCR period and average AP BI are readouts of the extent to which synchronization of coupled-clock mechanisms exists [7].
Figure 8. Average AP beating interval and average LCR period are correlated.
The LCR period in control or in the presence of IVA (panel A) or CPA (panel B) are correlated with T- 90c.The LCR period in control or in the presence of IVA (panel C) or CPA (panel D) predicts the concurrent AP cycle length.
4. Discussion
It has been previously shown that an incremental increase in spontaneous AP BI in response to the M clock (IVA) or Ca2+-clock (CPA) inhibition results from changes in crosstalk within the coupled-clock system [7]. The present study extended the range of spontaneous AP BI prolongation in response to IVA or CPA. The first novel finding of the present study is that stochasticity within the coupled-clock system determines the AP BIV. Because the AP BIV and the average AP BI are highly correlated, the stochasticity of coupled-clock mechanisms is also tightly linked to the average AP BI. Therefore, failure to maintain the basal average AP BI when either M or Ca2+ clock function is disturbed reports increased system entropy. Therefore, the complexity of AP BIV goes well beyond autonomic neural input to SANC residing within the sinoatrial node, and SANC response to autonomic receptor stimulation, but also depends on rhythmic mechanisms intrinsic to the pacemaker cells embedded within the sinoatrial node tissue. Specifically, an increase in AP BI in response to suppression of the Ca2+ (CPA) or M (IVA) clock markedly increases time-domain variability indices, and markedly increases beating interval entropy (Fig. 1). A similar link between the increase in AP BI and AP BIV in response to acetylcholine has been previously documented [1, 2, 17]. Note, however, that in contrast to IVA or CPA, which has specific direct effects only on the M or the Ca2+ clock, respectively, acetylcholine works directly on both [18]. Thus, our results show, for the first time, that by inducing specific inhibition of a single clock, the degree of clock coupling (synchronization of coupled-clock mechanisms) determines not only the AP BI, but also AP BIV. Because direct perturbations of the M or the Ca2+ clock lead to similar reductions in AP BI and AP BIV, we may conclude that AP BIV is not determined solely by M clock function, an idea that was previously entertained [4], but also by stochasticity and efficiency of the functions operative within the coupled-clock system.
The second novel, and most important, finding is that changes in LCR period variability are linked to changes in AP BI. Specifically, the pattern of variability in LCR period in response to graded inhibition of either clock is similar to that of AP BIV. Thus, our results demonstrate that the increased variability in AP BI (evoked by selectively perturbing either the M clock or the Ca2+ clock) is related to, and inseparable from, the concurrent variability in LCR periodicity. Similar results were documented in isolated rabbit SANC: beat-to-beat variations in the spontaneous AP firing rate under basal conditions are directly correlated with beat-to-beat variations in the LCR period [8]. We interpret the link between LCR period variability and AP BI variability as resulting from inherently stochastic coupled-clock mechanisms: Stochastic openings of ryanodine receptors generate LCRs during the diastolic depolarization phase. The LCR characteristics (e.g., periodicity) depend upon the available Ca2+ (“the oscillatory substrate”) for SR Ca2+ cycling that is regulated by the balance of Ca2+ influx into and efflux from the cell. Therefore, the stochasticity of LCR periods not only depends upon intrinsic RyR stochasticity of spontaneous RyR activation but also upon sarcolemmal ion channel openings and closings that regulate the cell Ca2+ balance. Thus, the stochasticity of LCR periods is a function of stochasticity inherent to both M (stochastic process of ion channels opening) and Ca2+ clocks (stochastic opening of RyR channels). When the amount of Ca2+ available for Ca2+ pumping into the SR is reduced (either by reducing Ca2+ influx (IVA) or Ca2+ pumping rate (CPA)), the SR Ca2+ cycling kinetics become reduced, as evidenced by a prolongation of AP-induced Ca2+ transient (T-90c; an index of the rate of SR Ca2+ pumping). Not only is the average LCR period prolonged, but the LCR period variability increases. The increase in LCR variability, in turn, results in a peak ensemble LCR Ca2+ signal that not only occurs later in diastole but is of lower amplitude (due to a reduced synchronization of individual LCR periods). This weaker LCR signal to M clock proteins reports less-efficient clock coupling. On average, the activation of INCX is delayed, and the average AP BI therefore is prolonged. On a beat-to-beat basis, increased variation in LCR Ca2+ cycling results in beat-to-beat variation of this less-effectual LCR Ca2+ signal, producing beat-to-beat variation in the efficiency of clock coupling and thus an increase in AP BIV.
Several mechanisms are involved in the extent of efficiency to which the M and Ca2+ clocks are coupled in response to IVA or CPA. At concentrations that directly inhibit only the M clock channels (i.e., L-type, K+, and funny current) (Fig. S1), IVA indirectly suppresses the Ca2+ clock. At low concentration of IVA (3 μM), IVA selectively inhibits only the If of the M clock [7, 14]. Under this condition, the indirect reduction in Ca2+ influx is only due to prolongation of AP BI: The increase in AP BI induces a net reduction in Ca2+ influx per unit time due to less frequent ICa,L activation (due to fewer beats per unit time). Reduction in Ca2+ influx simultaneously leads to: (1) a reduction in SR Ca2+ load due to a reduction in Ca2+ available for pumping into the SR; (2) prolongation of the LCR period; (3) a shift in Ca2+ activation of INCX to later during diastolic depolarization; and (4) possible reduction in Ca2+-calmodulin activation of AC-cAMP/PKA and CaMKII signaling axes (for review, see [19]), although this was not measured directly in the present study, and will require documentation in future studies. This reduction in phosphorylation of Ca2+ cycling proteins further reduces the net Ca2+ influx and SR Ca2+ load. At high concentrations of IVA (>10μM), the increase in AP BI together with a reduction in Ca2+ influx reduced the Ca2+ SR load, and informed a similar feedback as the low IVA concentration to entrain the M clock to further increase the AP BI.
Other sarcolemmal voltage-activated K+ channels, Ca2+-activated K+ channels and Na+ currents inform a similar feedback to entrain the M clock to further increase the AP BI. The contribution of the decay of rapid delayed rectifier current (HERK) to the diastolic depolarization phase and its essential role in maintaining the spontaneous AP firing rate have been demonstrated in mammals (e.g. rabbit [20] [21], guinea pig [22], etc). Moreover, the inactivation rate of other voltage-dependent K+ channels is an essential component of the diastolic depolarization phase [23]. The increase in AP BI in response to IVA or CPA indirectly induces a net reduction in K+ efflux per unit time due to less frequent IK activation (due to fewer beats per unit time). This leads to 1) prolongation of the deactivation time of K+ channels and therefore indirectly to a reduction of INCX activation, and 2) a reduction in NaK pump current (which reduces the INCX). Ca2+-activated K+ channels are also present in pacemaker-like cells [24]. Thus, in response to the indirect or direct effect on the Ca2+ cycling by IVA or CPA, respectively, the Ca2+-activated K+ channels can be directly suppressed. Finally, although the sarcolemmal Na+ current is absent in cells from the center of the rabbit sinoatrial node, it is abundant in its periphery [25]. The increase in AP BI in response to IVA or CPA induces a net reduction in Na+ influx during the AP per unit time, due to less frequent INa activation (due to lower number beats per unit time). This reduction in Na+ influx simultaneously leads to 1) a reduction of INCX activation, and 2) a reduction in NaK pump current, similar to the effects of a reduction in K+ outflow. Therefore, in this case, a change in the degree to which coupled-clock mechanisms are synchronized is indirectly affected by changes in the sarcolemmal voltage-activated Na channel current.
In contrast to IVA, at both tested concentrations, CPA directly suppresses only the Ca2+ clock and indirectly suppresses the M clock channels. CPA affects neither ICa nor If (Fig. S3). Similarly CPA does not affect ICa measured in skeletal muscle [26] or in the heart [27]. Moreover, at similar concentrations, CPA does not affect the Ca2+-dependent K+ currents in guinea pig smooth muscle cells [28]. Similar to the entrainment effect of the increase in AP BI by IVA on the Ca2+ clock, the increase in AP BI in response to CPA also involves crosstalk between the M and Ca2+ clocks. In both cases (IVA or CPA), the new steady-state equilibrium in AP BI and AP BIV is achieved due to three factors: (1) the balance is achieved between Ca2+ efflux via INCX and the reduced Ca2+ influx [29]; (2) the extent to which reduction in AP firing rate allows the If to increase (increase the activation) [30] and IK to decrease; (3) the extent to which a reduction in Ca2+ decreases the L-type channel inactivation [31].
Although our paper is focused on how intrinsic properties of single isolated pacemaker cells affect the beating interval and beating interval variability, one cannot exclude the fact that the pacemaker cells reside in the sinoatrial node. Isolation of single cells from the sinoatrial node precludes cell-to-cell interactions within the tissue increasing both intrinsic clock period and the variability of beating intervals in single SANC compared to the sinoatrial node [17]. Pacemaker cells within intact SAN tissue that have the shortest clock periods entrain cells with more prolonged periods, reducing the BIV among cells within the SAN tissue. This “neighborhood” effect within SAN tissue affects the AP BIV by reducing the variability of properties intrinsic to the entrained cells [32].
5. Limitations
A large literature reporting the effects of pharmacological maneuvers and molecular properties of proteins demonstrates that a diversity of cell types is present within SAN (for review, cf [33]). Specifically, primary and peripheral cell types have different distributions of ionic channels although their “Ca2+ clock” components are similar [34]. Because IVA and CPA act directly and indirectly on both components of the coupled-clock system, these interventions may indeed have different effects on beating intervals and beating interval variability in different cell types. Unfortunately, the exact in vivo location or function of cells isolated from the SAN, using the tools of the present study, cannot be determined.
6. Summary
While earlier seminal papers, including those of our own lab, provide a substantial understanding of and novel mechanistic insights into sinoatrial node AP firing and how it is regulated by coupled-clock mechanisms, the majority of these papers have focused only on those mechanisms that control the average sinoatrial node AP BI. However, how, and to what extent, these intrinsic coupled-clock mechanisms control the beat-to-beat variability of AP BI had not been thoroughly investigated. The present study shows that a reduction in the efficacy of clock coupling effected by direct M or Ca2+ clock inhibition not only increases the AP BI but also the AP BIV. The most important findings of our study are (1) when the clock mechanisms become impaired an increase in LCR period variability is linked to the increase in AP BIV, and (2) LCR period variability increases as the average LCR period and AP BI increase. Thus, the pattern of variability in LCR period in response to graded inhibition of either clock is similar to that of AP BIV. Consequently, modulation the stochasticity within the coupled-clock system regulates the entire range of not only physiological AP firing rate but also its rhythms. Finally, our paper, in demonstrating that variability of functions intrinsic to pacemaker cells, provides definitive evidence that the complexity of heart rate variability measured in vivo goes well beyond the autonomic impulses to the SAN and response of pacemaker cells to autonomic receptor stimulation, but also depends upon mechanisms (e.g. phosphorylation mechanisms, opening and closing of ion channels and ryanodine receptors, etc.) intrinsic to the pacemaker cells embedded within the sinoatrial node tissue.
Supplementary Material
Highlights.
Local Ca2+ release period reports the stochasticity of coupled-clock mechanisms.
Heart rate variability is determined by both membrane and Ca2+ clock mechanisms.
Coupled-clock system stochasticity modulates clock coupling effectiveness.
Acknowledgments
Sources of Funding
The work was supported in part by the Intramural Research Program of the National Institute on Aging, National Institutes of Health and by Technion V.P.R Fund – Krbling Biomedical Engineering Research Fund (Y.Y).
We thanks Ms. Ruth Sadler for text editing.
Non-standard abbreviations and acronyms
- AC
Adenylyl-cyclases
- AP
Action potential
- BI
Beating interval
- BIV
Beating interval variability
- CaMKII
Calmodulin-dependent protein kinase II
- CPA
Cyclopiazonic acid
- HR
Heart rate
- HRV
Heart rate variability
- IVA
Ivabradine
- LCR
Local Ca2+ release
- M
Membrane
- PKA
Protein kinase A
- PLB
Phospholamban
- RyR
Ryanodine receptor
- SANC
Sinoatrial-node cell
- SR
Sarcoplasmic reticulum
- T-50c
50% decay time of intracellular Ca2+
- T-90c
90% decay time of intracellular Ca2+
Footnotes
Disclosures
None.
Publisher's Disclaimer: This is a PDF file of an unedited manuscript that has been accepted for publication. As a service to our customers we are providing this early version of the manuscript. The manuscript will undergo copyediting, typesetting, and review of the resulting proof before it is published in its final citable form. Please note that during the production process errors may be discovered which could affect the content, and all legal disclaimers that apply to the journal pertain.
References
- 1.Rocchetti M, Malfatto G, Lombardi F, Zaza A. Role of the input/output relation of sinoatrial myocytes in cholinergic modulation of heart rate variability. Journal of cardiovascular electrophysiology. 2000;11:522–30. doi: 10.1111/j.1540-8167.2000.tb00005.x. [DOI] [PubMed] [Google Scholar]
- 2.Zaza A, Lombardi F. Autonomic indexes based on the analysis of heart rate variability: a view from the sinus node. Cardiovascular research. 2001;50:434–42. doi: 10.1016/s0008-6363(01)00240-1. [DOI] [PubMed] [Google Scholar]
- 3.Verheijck EE, Wilders R, Joyner RW, Golod DA, Kumar R, Jongsma HJ, et al. Pacemaker synchronization of electrically coupled rabbit sinoatrial node cells. The Journal of general physiology. 1998;111:95–112. doi: 10.1085/jgp.111.1.95. [DOI] [PMC free article] [PubMed] [Google Scholar]
- 4.Papaioannou VE, Verkerk AO, Amin AS, de Bakker JM. Intracardiac origin of heart rate variability, pacemaker funny current and their possible association with critical illness. Current cardiology reviews. 2013;9:82–96. doi: 10.2174/157340313805076359. [DOI] [PMC free article] [PubMed] [Google Scholar]
- 5.Yaniv Y, Lyashkov AE, Lakatta EG. The fractal-like complexity of heart rate variability beyond neurotransmitters and autonomic receptors: signaling intrinsic to sinoatrial node pacemaker cells. Cardiovascular Pharmacology: Open Access. 2013;2:11–4. doi: 10.4172/2329-6607.1000111. [DOI] [PMC free article] [PubMed] [Google Scholar]
- 6.Reil JC, Robertson M, Ford I, Borer J, Komajda M, Swedberg K, et al. Impact of left bundle branch block on heart rate and its relationship to treatment with ivabradine in chronic heart failure. Eur J Heart Fail. 2013;15:1044–52. doi: 10.1093/eurjhf/hft072. [DOI] [PubMed] [Google Scholar]
- 7.Yaniv Y, Sirenko S, Ziman BD, Spurgeon HA, Maltsev VA, Lakatta EG. New evidence for coupled clock regulation of the normal automaticity of sinoatrial nodal pacemaker cells: bradycardic effects of ivabradine are linked to suppression of intracellular Ca(2)(+) cycling. Journal of molecular and cellular cardiology. 2013;62:80–9. doi: 10.1016/j.yjmcc.2013.04.026. [DOI] [PMC free article] [PubMed] [Google Scholar]
- 8.Monfredi O, Maltseva LA, Spurgeon HA, Boyett MR, Lakatta EG, Maltsev VA. Beat-to-Beat Variation in Periodicity of Local Calcium Releases Contributes to Intrinsic Variations of Spontaneous Cycle Length in Isolated Single Sinoatrial Node Cells. PLoS One. 2013;8:e67247. doi: 10.1371/journal.pone.0067247. [DOI] [PMC free article] [PubMed] [Google Scholar]
- 9.Monfredi OJ, Maltseva LA, Boyett MR, Lakatta EG, Maltsev VA. Stochastic Beat-To-Beat Variation in Periodicity of Local Calcium Releases Predicts Intrinsic Cycle Length Variability in Single Sinoatrial Node Cells. Biophysical journal. 2011;100:558a. doi: 10.1371/journal.pone.0067247. [DOI] [PMC free article] [PubMed] [Google Scholar]
- 10.Maltsev VA, Lakatta EG. The funny current in the context of the coupled-clock pacemaker cell system. Heart Rhythm. 2013;9:302–7. doi: 10.1016/j.hrthm.2011.09.022. [DOI] [PMC free article] [PubMed] [Google Scholar]
- 11.Stern MD, Maltseva LA, Juhaszova M, Sollott SJ, Lakatta EG, Maltsev VA. Hierarchical clustering of ryanodine receptors enables emergence of a calcium clock in sinoatrial node cells. The Journal of general physiology. 2014;143:577–604. doi: 10.1085/jgp.201311123. [DOI] [PMC free article] [PubMed] [Google Scholar]
- 12.Lakatta EG, Maltsev VA, Vinogradova TM. A coupled SYSTEM of intracellular Ca2+ clocks and surface membrane voltage clocks controls the timekeeping mechanism of the heart’s pacemaker. Circulation research. 2010;106:659–73. doi: 10.1161/CIRCRESAHA.109.206078. [DOI] [PMC free article] [PubMed] [Google Scholar]
- 13.Yaniv Y, Maltsev VA, Ziman BD, Spurgeon HA, Lakatta EG. The “Funny” Current Inhibition by Ivabradine at Membrane Potentials Encompassing Spontaneous Depolarization in Pacemaker Cells. Molecules. 2012;17:8241–54. doi: 10.3390/molecules17078241. [DOI] [PMC free article] [PubMed] [Google Scholar]
- 14.Thollon C, Cambarrat C, Vian J, Prost JF, Peglion JL, Vilaine JP. Electrophysiological effects of S 16257, a novel sino-atrial node modulator, on rabbit and guinea-pig cardiac preparations: comparison with UL-FS 49. British journal of pharmacology. 1994;112:37–42. doi: 10.1111/j.1476-5381.1994.tb13025.x. [DOI] [PMC free article] [PubMed] [Google Scholar]
- 15.Vinogradova TM, Brochet DX, Sirenko S, Li Y, Spurgeon H, Lakatta EG. Sarcoplasmic reticulum Ca2+ pumping kinetics regulates timing of local Ca2+ releases and spontaneous beating rate of rabbit sinoatrial node pacemaker cells. Circulation research. 2010;107:767–75. doi: 10.1161/CIRCRESAHA.110.220517. [DOI] [PMC free article] [PubMed] [Google Scholar]
- 16.Yaniv Y, Stern MD, Lakatta EG, Maltsev VA. Mechanisms of beat-to-beat regulation of cardiac pacemaker cell function by Ca(2)(+) cycling dynamics. Biophysical journal. 2013;105:1551–61. doi: 10.1016/j.bpj.2013.08.024. [DOI] [PMC free article] [PubMed] [Google Scholar]
- 17.Yaniv Y, Ahmet I, Liu J, Lyashkov AE, Guiriba TR, Okamoto Y, et al. Synchronization of sinoatrial node pacemaker cell clocks and its autonomic modulation impart complexity to heart beating intervals. Heart Rhythm. 2014;11:1210–9. doi: 10.1016/j.hrthm.2014.03.049. [DOI] [PMC free article] [PubMed] [Google Scholar]
- 18.Lyashkov AE, Vinogradova TM, Zahanich I, Li Y, Younes A, Nuss HB, et al. Cholinergic receptor signaling modulates spontaneous firing of sinoatrial nodal cells via integrated effects on PKA-dependent Ca(2+) cycling and I(KACh) Am J Physiol Heart Circ Physiol. 2009;297:H949–59. doi: 10.1152/ajpheart.01340.2008. [DOI] [PMC free article] [PubMed] [Google Scholar]
- 19.Mattiazzi A, Mundina-Weilenmann C, Guoxiang C, Vittone L, Kranias E. Role of phospholamban phosphorylation on Thr17 in cardiac physiological and pathological conditions. Cardiovascular research. 2005;68:366–75. doi: 10.1016/j.cardiores.2005.08.010. [DOI] [PubMed] [Google Scholar]
- 20.Verheijck EE, Wilders R, Bouman LN. Atrio-sinus interaction demonstrated by blockade of the rapid delayed rectifier current. Circulation. 2002;105:880–5. doi: 10.1161/hc0702.104128. [DOI] [PubMed] [Google Scholar]
- 21.Sato N, Tanaka H, Habuchi Y, Giles WR. Electrophysiological effects of ibutilide on the delayed rectifier K(+) current in rabbit sinoatrial and atrioventricular node cells. Eur J Pharmacol. 2000;404:281–8. doi: 10.1016/s0014-2999(00)00603-8. [DOI] [PubMed] [Google Scholar]
- 22.Ding WG, Toyoda F, Matsuura H. Blocking action of chromanol 293B on the slow component of delayed rectifier K(+) current in guinea-pig sino-atrial node cells. British journal of pharmacology. 2002;137:253–62. doi: 10.1038/sj.bjp.0704861. [DOI] [PMC free article] [PubMed] [Google Scholar]
- 23.Irisawa H, Brown HF, Giles W. Cardiac pacemaking in the sinoatrial node. Physiological reviews. 1993;73:197–227. doi: 10.1152/physrev.1993.73.1.197. [DOI] [PubMed] [Google Scholar]
- 24.Weisbrod D, Peretz A, Ziskind A, Menaker N, Oz S, Barad L, et al. SK4 Ca2+ activated K+ channel is a critical player in cardiac pacemaker derived from human embryonic stem cells. Proceedings of the National Academy of Sciences of the United States of America. 2013;110:E1685–94. doi: 10.1073/pnas.1221022110. [DOI] [PMC free article] [PubMed] [Google Scholar]
- 25.Dobrzynski H, Boyett MR, Anderson RH. New insights into pacemaker activity: promoting understanding of sick sinus syndrome. Circulation. 2007;115:1921–32. doi: 10.1161/CIRCULATIONAHA.106.616011. [DOI] [PubMed] [Google Scholar]
- 26.Meme W, Leoty C. Cyclopiazonic acid and thapsigargin reduce Ca2+ influx in frog skeletal muscle fibres as a result of Ca2+ store depletion. Acta physiologica Scandinavica. 2001;173:391–9. doi: 10.1046/j.1365-201X.2001.00918.x. [DOI] [PubMed] [Google Scholar]
- 27.Badaoui A, Huchet-Cadiou C, Leoty C. Effects of cyclopiazonic acid on membrane currents, contraction and intracellular calcium transients in frog heart. Journal of molecular and cellular cardiology. 1995;27:2495–505. doi: 10.1006/jmcc.1995.0237. [DOI] [PubMed] [Google Scholar]
- 28.Suzuki M, Muraki K, Imaizumi Y, Watanabe M. Cyclopiazonic acid, an inhibitor of the sarcoplasmic reticulum Ca(2+)-pump, reduces Ca(2+)-dependent K+ currents in guinea-pig smooth muscle cells. British journal of pharmacology. 1992;107:134–40. doi: 10.1111/j.1476-5381.1992.tb14475.x. [DOI] [PMC free article] [PubMed] [Google Scholar]
- 29.Eisner DA, Trafford AW. What is the purpose of the large sarcolemmal calcium flux on each heartbeat? Am J Physiol Heart Circ Physiol. 2009;297:H493–4. doi: 10.1152/ajpheart.00423.2009. [DOI] [PMC free article] [PubMed] [Google Scholar]
- 30.DiFrancesco D. Characterization of single pacemaker channels in cardiac sino-atrial node cells. Nature. 1986;324:470–3. doi: 10.1038/324470a0. [DOI] [PubMed] [Google Scholar]
- 31.Kohlhardt M, Krause H, Kubler M, Herdey A. Kinetics of inactivation and recovery of the slow inward current in the mammalian ventricular myocardium. Pflugers Archiv : European journal of physiology. 1975;355:1–17. doi: 10.1007/BF00584795. [DOI] [PubMed] [Google Scholar]
- 32.Jalife J. Mutual entrainment and electrical coupling as mechanisms for synchronous firing of rabbit sino-atrial pace-maker cells. The Journal of physiology. 1984;356:221–43. doi: 10.1113/jphysiol.1984.sp015461. [DOI] [PMC free article] [PubMed] [Google Scholar]
- 33.Boyett MR. ‘And the beat goes on.’ The cardiac conduction system: the wiring system of the heart. Experimental physiology. 2009;94:1035–49. doi: 10.1113/expphysiol.2009.046920. [DOI] [PubMed] [Google Scholar]
- 34.Lyashkov AE, Juhaszova M, Dobrzynski H, Vinogradova TM, Maltsev VA, Juhasz O, et al. Calcium cycling protein density and functional importance to automaticity of isolated sinoatrial nodal cells are independent of cell size. Circulation research. 2007;100:1723–31. doi: 10.1161/CIRCRESAHA.107.153676. [DOI] [PubMed] [Google Scholar]
Associated Data
This section collects any data citations, data availability statements, or supplementary materials included in this article.


