

Abstract
We have enhanced photoacoustic microscopy with three-dimensional arbitrary trajectory (3-DAT) scanning, which can rapidly image selected vessels over a large field of view (FOV) and maintain a high signal-to-noise ratio (SNR) despite the depth variation of the vessels. We showed that hemoglobin oxygen saturation (sO2) and blood flow can be measured simultaneously in a mouse ear in vivo at a frame rate 67 times greater than that of a traditional two-dimensional raster scan. We also observed sO2 dynamics in response to switching from systemic hypoxia to hyperoxia.

3-DAT-scanning photoacoustic microscopy. Schematic diagram of the 3D scanning stage and method.
Keywords: Optical-resolution photoacoustic microscopy, 3-D arbitrary trajectory scanning, raster scanning, metabolic rate of oxygen, hemoglobin oxygen saturation
Dynamic physiological and pathological phenomena involving the oxygen consumption of tissue may occur over a wide field of view (FOV) and at small time scales. For example, vessel dilation and contraction, a process of physiological interest, occurs at a frequency of 1.5 Hz in mice [1]. Processes of pathologic interest include the spreading of neural firing and subsequent vascular coupling of oxygen consumption during epileptiform activities or cortical ischemia. Specifically, such spreading waves travel at 2–5 mm/min [2, 3] under cortical ischemia and 3.2–6.8 mm/min during epileptiform activities [4, 5]. Recently, optical-resolution photoacoustic microscopy (OR-PAM) has proven to be capable of high-resolution, noninvasive, and label-free imaging of oxygen metabolism in vivo over a wide FOV [6–10]. However, the monitoring of rapid hemodynamic processes on the second-to-minute timescale has been limited by the inability to simultaneously achieve a high scanning speed and a wide FOV; therefore, improvements in scanning speed and FOV have remained major research interests for OR-PAM.
Laser-scanning OR-PAM has demonstrated a high scanning speed, but with a limited scanning range of ~200 μm [11]. An unfocused ultrasonic transducer can expand the scanning range to a few millimeters, but at the expense of detection sensitivity and working distance. For a 500 μm scanning range (equal to the transducer size), the reduction was only 6 dB [12]. But larger scanning ranges will require larger transducers which passively load the amplifier input, further reducing voltage sensitivity in proportion to the scanning range. Simultaneous scanning of the optical-acoustic dual foci based on a novel water-immersible microelectromechanical system (MEMS) mirror has achieved rapid scanning (4 frames/second) over an extended FOV (0.3 × 1 mm2). However, the fixed scanning path often requires MEMS OR-PAM to raster-scan the entire object, thereby limiting the overall scanning speed if only a small arbitrarily shaped region is of interest [13]. Furthermore, to the best of our knowledge, current OR-PAM systems cannot overcome the reduced signal-to-noise ratio (SNR) arising from the depth variations of uneven features.
In this letter, we present three-dimensional arbitrary trajectory (3-DAT) OR-PAM to address the aforementioned challenges. In 3-DAT OR-PAM, the scanning path follows the selected vessels. Such a technical innovation significantly improves the scanning speed by excluding extraneous regions.
The system, based on second-generation OR-PAM, has a 3-D scanning stage [14]. As shown in (Figure 1(a, b)), the system consists of two solid-state lasers (SPOT, Elforlight: 532 nm; INNOSLAB, Edgewave: 559 nm) for spectroscopic imaging. The combined laser beam first passes through an iris (ID25SS, Thorlabs, 2 mm aperture), then a 50 μm-diameter pinhole (P50C, Thorlabs). The beam is focused by a condenser lens (LA1131, Thorlabs) before entering a single-mode fiber (LMA-10, NKT Photonics). The output from the fiber is collimated by a microscope objective (RMS4X, Thorlabs), reflected by a stationary mirror, and focused by another identical objective. The generated photoacoustic wave is reflected by a layer of silicone oil sandwiched between two prisms. The wave is then detected by an ultrasonic transducer (V214-BB-RM, Olympus-NDT, 50 MHz center frequency, 35 MHz nominal bandwidth). The optical-acoustic scanning head is fully motorized by two linear motor stages (PLS-85, PI miCos) in the x–y plane and a linear stage (VT-21 S, PI miCos) in the z-direction.
Figure 1.

3-DAT-scanning photoacoustic microscopy. (a) Schematic diagram of OR-PAM. ConL, condenser lens; FC, fiber collimator; ND, neutral density; SMF, single-mode fiber. (b) Schematic diagram of the 3D scanning stage and method. A raster scan acquires a global map for offline data processing. A vessel of interest is selected, then the maximum amplitude of the PA signal along the vessel is projected onto the x–y and x–z planes. The projected curves are then each fitted with b-spline interpolation, respectively, and assembled into a 3D map [x, y(x), z(x)]. The 3D map guides the 3D scanning stage to follow the vessel of interest.
The 3-DAT scanning requires a 3-D adjustment of both the optical and the acoustic foci at each position. To determine the path of the foci, a coarse scouting raster scan is first acquired as a global map. Second, the vessels of interest are identified by inspection of the global map and manually segmented in MATLAB (R2012b, MathWorks). Third, the segmented mask is further thresholded via the Otsu method [15, 16] to refine the shape of the selection and is morphologically thinned to attain the approximate 3-D coordinates of the vessel’s centerline. Fourth, the maximum amplitude of the photoacoustic signal along the centerline is then projected onto the x–y and x–z planes, yielding two projections, which are each fitted with b-spline interpolation to predefine the 3-D trajectory of the focus. Finally, the trajectory is exported from MATLAB into Lab-View (National Instruments), and converted into trigger pulses, which orchestrate the three-axis scanning stages for real-time control of the focal position.
To experimentally compare traditional raster scanning and 3-DAT scanning in OR-PAM, we imaged an obliquely oriented human hair within a 3.5 × 2.0 mm2 region. Figure 2(a) shows the maximum-amplitude projection (MAP) of the hair acquired by raster scanning. To obtain the 3-D trajectories of targeted vessels, we first acquired a global map with a large step size (50 μm), which took about 30 seconds. Then, we traced the trajectory of the same hair and shortened the data acquisition time by 18 times (Figure 2(b)). The axial position of the hair, z, from the ultrasonic transducer is plotted as a function of distance along the hair in Figure 2(c). As expected, the raster scanning lost focus as the hair moved outside the optical depth of focus, while 3-DAT scanning preserved the optimal focus, as demonstrated by the nearly constant depth along the hair relative to the focal plane of the ultrasonic transducer. Additionally, the 3-DAT scanning preserved a nearly constant SNR, with a maximum SNR improvement of 132% over that of the raster scanning (Figure 2(d)). Here, SNR is calculated from each A-line and compared between raster scanning and 3-DAT.
Figure 2.
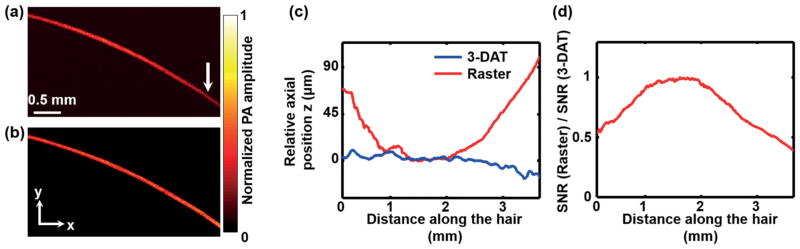
Imaging of a human hair. The maximum amplitude projection (MAP) of the PA signal along the z direction of (a) the raster scan image and (b) the 3-DAT scan image. The out-of-focus hair image in (a), as indicated by the arrow, was clearly resolved in the 3-DAT scanning image. (c) Relative axial position of the hair from the focal plane of the ultrasonic transducer versus lateral position of the raster scan (blue line) and the 3-DAT scan (red line). (d) SNR versus lateral position.
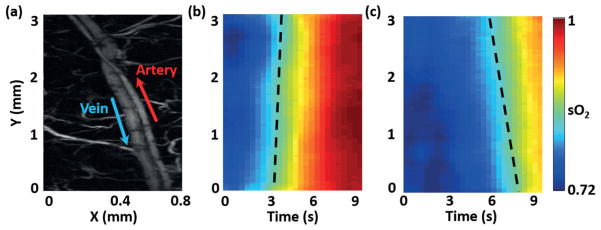
For in vivo OR-PAM, a 2.30 × 0.55 mm2 region on the ear of a living mouse was imaged by raster and 3-DAT scanning at two wavelengths (532 nm and 559 nm). The mouse was anesthetized with isoflurane (1.0–1.5% isoflurane, airflow rate of 1 l/min) and body temperature of the animal was maintained at a 37 °C heating pad. All experimental animal procedures were carried out in conformity with the laboratory animal protocol approved by the Animal Studies Committee at Washington University in St. Louis. Raster scanning acquired the structural and sO2 maps of the main vascular trunk within 103.9 seconds (Figure 3(a, b)). The trajectories of the artery-vein pair were computed as described above. The artery was imaged first, and then the vein was imaged. The 3-DAT scanning took only 17 seconds to scan the selected vessels, 6 times faster than raster scanning (Table 1). The blood flow speed (Figure 3(c)) was calculated by two adjacent B-scans using photo-acoustic Doppler bandwidth broadening [17–21], and the sO2 map was computed from the dual-wavelength measurement (Figure 3(d)). The vessel diameter and blood flow flux were also calculated from the 3-DAT scanning image (Figure 3(e, f)). While the diameter and flux of the artery decreased slightly after bifurcation, those of the vein decreased dramatically, which agrees with well-known physiology [22]. For normal mice, while the diameter of a vessel decreases with each bifurcation, the total cross sectional area of a vessel system increases. Therefore, according to the continuity equation, the blood flow speed decreases. In most situations, the sO2 and flow speed at a vessel’s cross section can be approximated by the values at the center of the cross section. By following only the center lines of the vessels of interest, 3-DAT scanning acquired the sO2 and flow maps within 0.8 and 1.6 seconds, respectively, which were 134 times and 67 times shorter than those by raster scanning, respectively (Table 1).
Figure 3.

For in vivo measurement, a 2.3 × 0.55 mm2 region in the ear of a living mouse was imaged by OR-PAM with raster and 3-DAT scanning. Global raster scanning acquired (a) a structural image and (b) a sO2 map of the main vascular trunk. The artery-vein pair was selected as the region of interest to guide 3-DAT scanning, yielding (c) the blood flow speed, (d) the sO2 map, (e) the diameter, and (f) the flow flux. The asterisks indicate the locations of bifurcations.
Tabelle 1.
Comparison of raster scanning and 3-DAT scanning over a 2.3 × 0.55 mm2 region in the ear of a living mouse.
| Raster scan (s) | 3-DAT scan (s) | 3-DAT scan, Central line (s) | |
|---|---|---|---|
| sO2 map | 103.9 | 17.3 (6×)* | 0.8 (134×)* |
| Flow map | 103.9 | 17.3 (6×)* | 1.6 (67×)* |
| Diameter | 103.9 | 17.3 (6×)* | NA |
Speed improvement over that by raster scanning.
To further demonstrate the advantages of 3-DAT OR-PAM, we imaged an artery-vein pair in a nude mouse ear (Hsd:Athymic Nude-FoxnlNU, Harlan) to monitor physiological states in vivo (Figure 4(a)). In this experiment, the mouse was breathing 8% oxygen gas for over 1 min. Then the physiological state was switched from hypoxia to hyperoxia by altering the inhalation gas from 8% O2 gas mixture to 100% O2. The 3-DAT scanning was completed in 0.39 seconds, which was 320 times faster than global raster scanning. The sO2 changes in the spatial and temporal domains were clear (Figure 4(b, c)). The spatial change in sO2 is related to oxygen transportation via the blood flow. Thus, the blood flow speed can be calculated from the slope of the sO2 contour map. From only the functional sO2 map, we were able to determine the flow speeds in the artery and vein. First, the contour lines of constant sO2 across the sO2 map were determined in MATLAB. The step for two adjacent contour lines was 0.5%. Due to the limited motor speed, the time delay (Δt) between the start and end A-lines of one B-scan is 0.39 seconds. If the total number of A-lines in a given B-scan is N, the corresponding time interval between two adjacent A-lines was estimated to be Δt/N by linear interpolation. The B-scans of sO2 formed (Figure 4(b, c)), where the slopes of sO2 contours encoded blood flow speeds. The slopes of the contour lines were then averaged to estimate the average speed of blood travelling in the vessels. The arterial and venous flow speeds were 2.26 ± 0.22 mm/s and −1.37 ± 0.12 mm/s, respectively, which agreed with measurements (artery: 1.85 ± 0.19 mm/s; vein: −1.20 ± 0.15 mm/s) obtained using photoacoustic Doppler bandwidth broadening [17, 18].
Figure 4.
sO2 change in response to switching the physiological state from hypoxia (8% O2 gas mixture inspiration) to hyperoxia (100% O2): (a) Globally raster scanned image. The arrows denote the blood flow directions. Monitoring the changes of sO2 in (b) the selected artery and (c) the selected vein using 3-DAT scanning. The 3-DAT scanning was 320 times faster than the global raster scanning. The dashed lines indicate slopes of the contour lines.
In summary, we have developed three-dimensional arbitrary trajectory (3-DAT) optical-resolution photoacoustic microscopy (OR-PAM), which enhances the scanning speed compared to traditional raster scanning, and also dynamically focuses on an uneven or user-selected region of interest. The maximum speed improvement, depending on the object’s (vessel) geometry and size, can be estimated by td/tr = AdZ/ArZ0, where td is the scanning time for raster scanning, tr is the scanning time for 3-DAT scanning, Ad is the area of the object of interest, Ar is the minimal rectangular region encompassing the object, Z is the depth range occupied by the object, and Z0 is the depth of optical focusing. Given a special case, the improvement can be estimated by td/tr ≈ (L2/8Rd + 1)(z/z0), where L is object’s length, d is its diameter, R is its radius of curvature, z is the depth range occupied by the object, and z0 ≈ 40 μm is the depth of optical focusing. For a representative case of a 50 μm diameter, 5 mm long vessel with 10 mm curvature in the x–y plane and occupying 1 mm in the z direction, the imaging time can be up to 150 times faster than raster scanning. We further demonstrated that blood flow speed can be derived from time-variant sO2 maps, a new approach that can potentially be used even beyond the optical diffusion limit. 3-DAT scanning is a promising tool for investigating rapid physiological processes in vivo. In the future, we can further extend the frame rate via a high speed motor such as a voice-coil motor [23] and/or a hybrid scanning method such as galvo-motor scanning [24]. Either of them can further improve the scanning speed by at least 5 times.
Acknowledgments
The authors appreciate the close reading of the manuscript by Prof. James Ballard. We also thank Junjie Yao, Liren Zhu, Wenxin Xing, Jinyang Liang, Yong Zhou and Lidai Wang for helpful discussions. This work was sponsored by National Institutes of Health Grants DP1 EB016986 (NIH Director’s Pioneer Award), R01 CA186567 (NIH Director’s Transformative Research Award), R01 CA159959, and R01 EB016963.
Footnotes
L.V.W. has financial interests in Microphotoacoustics, Inc. and Endra, Inc., neither of which supported this work. K. Maslov has a financial interest in Microphotoacoustics, Inc.
References
- 1.Porooshani H, Porooshani A, Gannon L, Kyle G. Speed of progression of migrainous visual aura measured by sequential field assessment. Neuro-Ophthalmology. 2004;28:101. [Google Scholar]
- 2.Leo AAP. SPREADING DEPRESSION OF ACTIVITY IN THE CEREBRAL CORTEX. Journal of Neurophysiology. 1944;7:359. doi: 10.1152/jn.1947.10.6.409. [DOI] [PubMed] [Google Scholar]
- 3.Lauritzen M, et al. Clinical relevance of cortical spreading depression in neurological disorders: migraine, malignant stroke, subarachnoid and intracranial hemorrhage, and traumatic brain injury. Journal of Cerebral Blood Flow & Metabolism. 2011;31:17. doi: 10.1038/jcbfm.2010.191. [DOI] [PMC free article] [PubMed] [Google Scholar]
- 4.Macé E, et al. Functional ultrasound imaging of the brain. Nature Methods. 2011;8:662. doi: 10.1038/nmeth.1641. [DOI] [PubMed] [Google Scholar]
- 5.Busija DW, Bari F, Domoki F, Horiguchi T, Shimizu K. Mechanisms involved in the cerebrovascular dilator effects of cortical spreading depression. Progress in Neurobiology. 2008 Dec 11;86:417. doi: 10.1016/j.pneurobio.2008.09.008. [DOI] [PMC free article] [PubMed] [Google Scholar]
- 6.Shi W, Shao P, Hajireza P, Forbrich A, Zemp RJ. In vivo dynamic process imaging using real-time optical-resolution photoacoustic microscopy. Journal of Biomedical Optics. 2013;18:026001. doi: 10.1117/1.JBO.18.2.026001. [DOI] [PubMed] [Google Scholar]
- 7.Xie Z, Jiao S, Zhang HF, Puliafito CA. Laser-scanning optical-resolution photoacoustic microscopy. Optics Letters. 2009 Jun 15;34:1771. doi: 10.1364/ol.34.001771. [DOI] [PubMed] [Google Scholar]
- 8.Ntziachristos V. Going deeper than microscopy: the optical imaging frontier in biology. Nature methods. 2010;7:603. doi: 10.1038/nmeth.1483. [DOI] [PubMed] [Google Scholar]
- 9.Jiao S, et al. Photoacoustic ophthalmoscopy for in vivo retinal imaging. Opt Express. 2010 Feb 15;18:3967. doi: 10.1364/OE.18.003967. [DOI] [PMC free article] [PubMed] [Google Scholar]
- 10.Liang J, et al. Random-access optical-resolution photoacoustic microscopy using a digital micromirror device. Optics Letters. 2013 Aug 01;38:2683. doi: 10.1364/OL.38.002683. [DOI] [PMC free article] [PubMed] [Google Scholar]
- 11.Hajireza P, Shi W, Zemp R. Label-free in vivo fiber-based optical-resolution photoacoustic microscopy. Optics letters. 2011;36:4107. doi: 10.1364/OL.36.004107. [DOI] [PubMed] [Google Scholar]
- 12.Rao B, et al. Real-time four-dimensional optical-resolution photoacoustic microscopy with Au nanoparticle-assisted subdiffraction-limit resolution. Optics Letters. 2011 Apr 01;36:1137. doi: 10.1364/OL.36.001137. [DOI] [PMC free article] [PubMed] [Google Scholar]
- 13.Yao J, et al. Wide-field fast-scanning photoacoustic microscopy based on a water-immersible MEMS scanning mirror. Journal of biomedical optics. 2012;17:0805051. doi: 10.1117/1.JBO.17.8.080505. [DOI] [PMC free article] [PubMed] [Google Scholar]
- 14.Hu S, Maslov K, Wang LV. Second-generation optical-resolution photoacoustic microscopy with improved sensitivity and speed. Optics letters. 2011;36:1134. doi: 10.1364/OL.36.001134. [DOI] [PMC free article] [PubMed] [Google Scholar]
- 15.Soetikno B, et al. Vessel segmentation analysis of ischemic stroke images acquired with photoacoustic microscopy. Proceedings of SPIE, Photons Plus Ultrasound: Imaging and Sensing. 2012;8233:822345. [Google Scholar]
- 16.Otsu N. A threshold selection method from gray-level histograms. Automatica. 1975;11:23. [Google Scholar]
- 17.Yao J, Wang LV. Transverse flow imaging based on photoacoustic Doppler bandwidth broadening. Journal of biomedical optics. 2010;15:021304. doi: 10.1117/1.3339953. [DOI] [PMC free article] [PubMed] [Google Scholar]
- 18.Ren H, et al. Imaging and quantifying transverse flow velocity with the Doppler bandwidth in a phase-resolved functional optical coherence tomography. Optics Letters. 2002 Mar 15;27:409. doi: 10.1364/ol.27.000409. [DOI] [PubMed] [Google Scholar]
- 19.Zhao Y, et al. Doppler standard deviation imaging for clinical monitoring of in vivo human skin blood flow. Optics Letters. 2000 Sep 15;25:1358. doi: 10.1364/ol.25.001358. [DOI] [PubMed] [Google Scholar]
- 20.Kasai C, Namekawa K, Koyano A, Omoto R. Real-Time Two-Dimensional Blood Flow Imaging Using an Autocorrelation Technique. Sonics and Ultrasonics, IEEE Transactions on. 1985;32:458. [Google Scholar]
- 21.Kasai C, Harada A, Namekawa K. Real-time blood-flow imaging system using ultrasonic doppler techniques. Systems and Computers in Japan. 1988;19:13. [Google Scholar]
- 22.Klabunde RE. Cardiovascular Physiology Concepts. Lippincott Williams & Wilkins; 2005. [Google Scholar]
- 23.Wang L, Maslov K, Yao J, Rao B, Wang LV. Fast voice-coil scanning optical-resolution photo-acoustic microscopy. Optics Letters. 2011 Jan 15;36:139. doi: 10.1364/OL.36.000139. [DOI] [PMC free article] [PubMed] [Google Scholar]
- 24.Li L, et al. Fully motorized optical-resolution photo-acoustic microscopy. Optics Letters. 2014 Apr 01;39:2117. doi: 10.1364/OL.39.002117. [DOI] [PMC free article] [PubMed] [Google Scholar]