Abstract
Purpose
This work intends to demonstrate a new method for quantifying concentration of sodium (23Na) of bi-exponential T2 relaxation in patients on MRI scanners at 3.0 Tesla.
Theory
Two single-quantum (SQ) sodium images acquired at very-short and short echo times (TE=0.5 and 5.0ms) are subtracted to produce an image of the short-T2 component of the bi-exponential (or bound) sodium. An integrated calibration on the SQ and short-T2 images quantifies both total and bound sodium concentrations.
Methods
Numerical models were used to evaluate signal response of the proposed method to the short-T2 components. MRI scans on agar phantoms and brain tumor patients were performed to assess accuracy and performance of the proposed method, in comparison with a conventional method of triple-quantum filtering.
Results
A good linear relation (R2=0.98) was attained between the short-T2 image intensity and concentration of bound sodium. A reduced total scan time of 22min was achieved under the SAR restriction for human studies in quantifying both total and bound sodium concentrations.
Conclusion
The proposed method is feasible for quantifying bound sodium concentration in routine clinical settings at 3.0 Tesla.
Keywords: sodium MRI, short-T2 sodium imaging, intracellular sodium imaging, sodium quantification, brain tumor
INTRODUCTION
Sodium ions (Na+) in human body are either in fast and free motion in fluids (blood and cerebrospinal fluid, CSF), or in slow and restricted motion in cells and tissues due to binding to macromolecules such as intracellular proteins and extracellular matrix (1–6). Concentration of bound sodium is tightly regulated in normal cells and tissues but not properly regulated in abnormal ones such as cancer cells and degenerative cartilages (4, 6, 7). Noninvasive measurement of bound sodium concentration has the potential to establish an endogenous imaging biomarker for detecting early pathological changes in a wide range of conditions and diseases, from cartilage degeneration to brain tumors and neurological disorders such as bipolar, epilepsy, concussion, and others.
MRI quantification of the bound sodium (23Na) is based on its unique bi-exponential decay of transverse (T2) relaxation, with 60% of total intensity for the short- and 40% for the long-T2 components (8–11). The bi-exponential decay results from electrical and dynamic micro-environment around spins. A sodium nucleus has electric quadrupole and spin 3/2 (12, 13). The electric quadrupole moment interacts with electric field gradient at sodium binding site and generates four degenerative energy states (or levels): 3/2, 1/2, −1/2, and −3/2. Transitions between the energy levels produce single-, double- or triple-quantum coherences. A 90°-radiofrequency (RF) pulse excites the spins and produces single-quantum (SQ) coherences from transitions between the outer levels (3/2 → 1/2; −1/2 → −3/2) and between the inner levels (1/2 → −1/2). The outer-level SQ transverse relaxation has an exponential decay, exp(−t/T2S), faster than the inner one, exp(−t/T2L), with T2L>T2S (8, 14). The two exponential decays degenerate to one decay with a T2 time larger than T2L (14), if sodium nuclei are in free motion or move very fast (i.e., motion correlation time among sodium nuclei is much shorter than the inverse of Larmor frequency, τc≪1/ω0). A series of 90°-RF pulses generates double- or triple-quantum coherences from transitions between the non-adjacent energy levels, which are selectively detectable via phase cycling (15–17) or pulsed field gradients (18). These multiple-quantum coherences are used to detect bound sodium in slow motion via the bi-exponential decay. Triple-quantum filtering (TQF) has been used for this purpose more frequently than double-quantum filtering due to its 50% higher signal output (19). It is worth mentioning that bound sodium gives rise to the bi-exponential decay regardless of whether the sodium is intra- or extracellular.
The TQF imaging, when used for patient studies in clinical setting, is facing three major challenges. The first is the low signal-to-noise ratio (SNR) because triple-quantum (TQ) signal is about 10% of corresponding single-quantum signal (20–22). The second is the high specific absorption rate (SAR) that results in long acquisition time (~40min) to meet the SAR constraints on humans. Such a long acquisition time is difficult to tolerate by patients. The third challenge is the heavy dependence of TQ signal on T2 times of both short- and long-T2 components, limiting TQF imaging to the detection, rather than quantification, of bound sodium (22, 23).
To address these challenges alternative approaches have been proposed. The inversion recovery (IR) approach, adopted from proton (1H) MR imaging, was proposed to highlight bound sodium signal by suppressing free sodium signal from fluid (24). It takes advantage of the difference in T1 relaxation of sodium in tissues, such as in human brain where T1 is 20–40ms in CSF, ~17ms in white matter, and ~11ms in gray matter at 1.5 T (25). Although the IR approach significantly reduces RF power and completely suppresses unwanted fluid signal (26, 27), it is not suitable for quantification of bound sodium due to concurrent partial suppression of tissue signals. In addition, the IR pulse still has significant SAR-related limitations on total scan time. Low amplitude and long duration (~10ms) IR pulses may ameliorate this difficulty (26).
Another alternative approach was recently proposed, in which a bi-exponential-decay-related sodium image was attained by subtracting an SQ image acquired at a long echo time (11ms) from a spin-density-weighted image acquired at a very short echo time (0.3ms) (28). This approach increases SNR by up to 3-folds over the TQF imaging, but it does not reduce the SAR as it still requires three RF pulses for excitation. A version of this sequence with two RF pulses has been proposed to ease the SAR issue (29).
In this work, we propose a new approach that simultaneously addresses the three challenges (SAR, SNR and quantification) faced by the TQF approach. Our method, referred to as the short-T2 imaging, detects bound sodium through short-T2 component by subtracting two SQ sodium images acquired at very-short (0.5ms) and short (5.0ms) echo times. As a single RF pulse is used for each SQ image, the SAR limitation is mitigated. Signal intensity from the short-T2 component is about 60% of the SQ signal, and thus the new method has the potential to increase SNR by 6-folds over the TQF approach. More importantly, it can quantify the concentration of bound sodium as it has a nearly-uniform signal response to both short and long T2 relaxations in the range of interest.
The subtraction methodology, although widely used in proton (1H) MR imaging (30), was first proposed in sodium (23Na) MR imaging by Hilal et al (31, 32). However, their method is different from ours in the design in which our goal is to achieve a uniform response to all the T2 components of interest for the quantification of bound sodium concentration.
THEORY
Signal model
A two-compartment model is proposed here to describe single-quantum sodium signal in a voxel: bound and free sodium. In the compartment of bound sodium, T2 relaxation decays bi-exponentially with short- and long-T2 times of T2b,S and T2b,L. In the compartment of free sodium, T2 relaxation decays mono-exponentially with a long T2 time of T2fr. The total signal in a voxel of unit volume is described by the following equation.
| Eq. [1] |
In Eq.[1], V is volumetric fraction (percentage) of a compartment and C is sodium concentration. a is intensity fraction of a T2 component, with ab,S + ab,L = 1. η = 1−exp(−TR/T1) is saturation factor related to T1 relaxation in a compartment at a repetition time of TR. It is known that sodium T1 relaxation also decays bi-exponentially. However, the short-T1 component is about 20% of total intensity and is usually ignored in imaging practice (14, 22). n(t) is random noise of Gaussian distribution N(0, σ2).
Short-T2 sodium image
The short-T2 sodium image is defined here as the subtraction between two single-quantum sodium images acquired at very short (TE1) and short (TE2) echo times, respectively. Based on the Eq. [1], the short-T2 sodium image, sT2,S, is described as:
| Eq. [2a] |
| Eq. [2b] |
| Eq. [2c] |
| Eq. [2d] |
| Eq. [2e] |
where ΔTE=TE2−TE1. When TE1 < TE2 < T2b,L < T2fr and at typical T2 relaxations in the brain (33–35), Eqs. [2a–e] yield
| Eq. [2f] |
Optimization of TE1 and TE2
To make the estimation of sT2,S in Eq. [2f] as accurate as possible, the residual quantities in Eqs. [2d], [2e] should be minimized by selecting an optimal TE2 while keeping TE1 as short as possible. This leads to
| Eq. [3a] |
The optimal TE1 and TE2 should also make a uniform (or flat) response of sT2,S to a range of T2b,S and T2b,L values of interest, that is,
| Eq. [3b] |
For the optimization of TE1 and TE2, TR is also a key parameter but there is a limitation on adjusting TR due to SAR restriction.
Off-resonance correction (ORC)
The SQ images may suffer image blurring from a combination of long readout time and inhomogeneity of the main magnetic field B0. Artificial changes in adjacent voxels may appear in the subtraction image which are not relevant to actual changes of bound sodium concentration. It is important to correct image blurring before the subtraction.
To correct image blurring, an accurate 3D B0-field map, ΔB(r), or frequency map, Δf(r) = γ̶ ΔB(r), is needed, where γ̶ is gyromagnetic ratio in Hz/Tesla for sodium nuclei and r = (x, y, z) is spatial coordinates of a voxel. The field map can be estimated by taking phase difference between the two TE-images, m(r, TE1) and m(r, TE2),
| Eq. [4] |
The function phase() takes the phase of its complex variable and the operator * performs conjugate operation. Phase wrapping is less likely happening in this estimate because of small gyromagnetic ratio of sodium nuclei. For instance, a phase change of π in 4.5ms (=TE2−TE1) for sodium (23Na) corresponds to 111Hz offset in B0 field, or 422Hz for proton (1H). This offset is very large, and may be only possible with air cavities and sinus regions. The estimated frequency map is then employed to correct image blurring via the conjugate phase algorithm (36, 37), as described below with the acquired k-space data, s(k), and corrected image, m̂(r).
| Eq. [5] |
k(tj) is trajectory in the k-space at a readout time tj. h(k) is 3D Hann window, the same as used in image reconstruction before the image blurring correction. Δkj is volume element surrounding the sampling point in the k-space.
To accelerate the calculation in Eq. [5] via fast Fourier transformation (FFT), a time-segmentation algorithm is used. The k-space data, s(k(tj)), are grouped, first in the spatial-frequency directions (kx, ky, kz) and then in the time direction tj at a constant time step, tStep. At each time step, a constant phase is applied to the field term in Eq. [5].
T2* correction of the TE2 image
After the off-resonance correction, the TE2 image may need extra correction for T2* decay during the time period between TE1 and TE2. The TE2 image is weighted by T2* decay, rather than by T2 decay, as spin echo is usually not applicable to sodium imaging. The T2* decay stems from both macroscopic and microscopic inhomogeneity of the B0 field within a voxel and may change from scan to scan. Macroscopic inhomogeneity becomes substantial when subjects have pathological lesions in an imaging volume. To minimize fluctuation of the T2* decay across scans, the TE2 image should be corrected from T2*-weighted to T2-weighted. This can be accomplished with an empirical relation between T2 and T2* (30),
| Eq. [6] |
κ is a unitless constant depending on relative scale of the macroscopic inhomogeneity of the B0 field compared to the voxel size and shape of spin density distribution within a voxel. When voxel size is small (e.g., 3.44 mm in this study), a good first-order approximation to κ is 0.5 (30). With the estimated field map in Eq. [4], the TE2 image is then corrected by multiplying with a factor,
| Eq. [7] |
Quantification of bound sodium concentration
Accurate quantification of bound sodium concentration is difficult due to lack of measurement of volumetric fraction in a voxel. We quantify instead volume-fraction weighted bound sodium concentration (vBSC), Cvb =VbCb. An integrated linear calibration on the short-T2 image and TE1 image is used to quantify the bound sodium concentration, as well as total sodium concentration (TSC), Ctotal.
| Eq. [8a] |
| Eq. [8b] |
Cfr is the known sodium concentration in a pure free sodium compartment, such as 145mM in human cerebrospinal fluid (35). ITE1 is image intensity at a pixel on the TE1 image and Īnoise,TE1 is the mean of image intensities in a noise-only region. Īfr,TE1 is the T1-saturation (ηfr) corrected mean of image intensities in a pure fluid region of known concentration Cfr on the TE1 image. IST2 is image intensity in real part at a pixel on the short-T2 image while Īnoise,ST2 is the mean of real-part image intensities in a noise-only region. g is gain of the short-T2 imaging over a range of short T2 values of interest, which will be determined later in the results section.
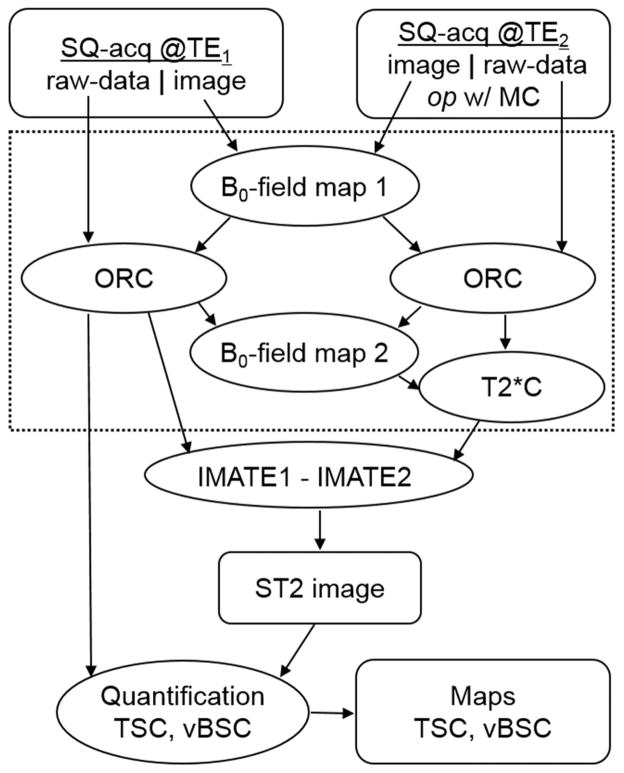
The whole process for the short-T2 sodium imaging is summarized in Figure 1.
Fig. 1.
Flowchart for the short-T2 sodium imaging. SQ-acq: single-quantum data acquisition; op w/ MC: optional selection with motion correction; ORC: off-resonance correction; T2*C: T2* correction; IMATE1/TE2: image at TE1/TE2; TSC: total sodium concentration; vBSC: volume-fraction weighted bound sodium concentration. The processes in the dashed box are optional.
METHODS
Pulse sequence
The proposed short-T2 sodium imaging requires pulse sequences capable of producing high SNR because random noise is increased by a factor of √2 after the subtraction. The twisted projection imaging (TPI) sequence is a good candidate for this purpose (38), which produces an isotropic 3D sodium image of the brain in a 10-min scan at 3 T and a high SNR of >40 in the CSF regions. This remarkable achievement in SNR is based on a long readout time of ~36ms which may raise concern on image blurring of the short-T2 component. This concern can be addressed by looking into the special design of TPI trajectory and its point spread function (PSF) as detailed below.
Image blurring of the short-T2 component
Image blurring was quantified for a short-T2 component, a long-T2 component, and a bi-component via the point spread function (PSF) of the TPI acquisition:
| Eq. [9] |
where k(tj) is TPI trajectory in the 3D k-space at a readout time of tj. h(k) is 3D Hann window the same as used in the TPI image reconstruction. Δkj is volumetric element surrounding a sampling point. The bi-component term will be replaced with mono-exponential term when the single-component is under investigation. Full width at half maximum (FWHM) of the PSF was used to quantify image blurring. A linear interpolation between pixels was used in the FWHM measurement. TE1 and TE2 are not included in Eq. [9], because they do not change with readout time. They scale magnitude but do not change shape of the TPI’s PSF.
Phantoms
To validate quantification of the bound sodium, ten 50mL centrifuge tube phantoms (90mm length × 25mm diameter) were custom-built with distilled water, 10% w/w agar powder, and NaCl at 10 different concentrations in a range of 15–150mM. The 10% w/w agar provides sufficient binding sites for sodium ions at the high-end concentration (11, 39). The range of 15–150mM simulates human brain tissues. To simulate free sodium in brain fluids, an extra tube phantom was built at 150mM NaCl without agar. This saline water phantom also served as image quality control of the short-T2 and TQF imaging. To measure spatial resolution of the short-T2 imaging under the TPI acquisitions we used a larger cylindrical agarose phantom (120mm length ×140mm diameter) filled with 10% w/w agarose gel and 66.6mM saline water.
Human subjects
Seven patients with brain tumors of high grade gliomas including both anaplastic glioma (WHO III) and glioblastoma multiforme (GBM) (5 pediatric patients of age 12–23 years, and 2 adults of age 56–60 years), were investigated in this study which was approved by the IRB of the University of Pittsburgh. The consent forms were signed by the subjects or their parents.
MRI scans
For the short-T2 imaging, two single-quantum sodium images were acquired on a clinical 3T MRI scanner (Magnetom Trio Tim, Siemens Medical Solutions, Erlangen, Germany) with gradient amplitude of 40 mT/m and slew rate of 170 mT/m/ms. A dual-tuned (1H-23Na) volume head coil (Advanced Imaging Research, Cleveland, OH, USA) was used for the B0-field shimming via the 1H channel and the sodium imaging via the 23Na channel. Acquisition parameters of the TPI sequence for the phantoms and human subjects were the same: rectangular RF pulse of 0.8ms duration (which was the minimum value available under the SAR restriction), flip angle=80° (which was limited by SAR and TR), field of view (FOV)=220mm, matrix size=64 (which led to a nominal isotropic resolution of 3.44mm, i.e., 220mm/64), TPI readout time =36.32ms, total TPI projections=1596, p=0.4, TR=100ms, TE1/TE2= 0.5/5ms, 4 averages, and total acquisition time per TE-image TA= 10min39sec.
The TQF imaging was only performed on the phantoms with a lower-resolution TPI trajectory: flip angle=90°, FOV=220mm, matrix size=64, TPI readout time=36.16ms, total TPI projections=204, p=0.2, 4 averages, three rectangular RF pulses of 1.0ms duration for each pulse, preparation time τ=3.0ms, evolution time δ=0.1ms, TE=4.0ms, TR=312ms at SAR=100%, phase cycling steps=6 (initial phase=30° and phase step=60°), and TA= 25min28sec. The preparation time τ and echo time TE were optimized via a real-time calibration process, respectively.
Measurement of spatial resolution
Actual spatial resolution in the single-quantum or short-T2 image was measured directly on the images (40). The width, d, of the image intensity decay along the diameter at the edge of the large agarose phantom was measured at its half way down to the bottom. The top and bottom of an edge were determined by averaging image intensity along their flat portions respectively. The width was an estimate of the actual spatial resolution defined by the full width at half maximum (FWHM) of point spread function (40–43). This estimate is accurate when PSF is a triangle function. The measured resolution, slightly larger than the nominal resolution defined by the sampling in the k-space, consists of contributions from entire imaging process including B0-field inhomogeneity, T2* decay, and filtering during image reconstruction.
Measurement of SNR
Because a quadrature volume head coil was used in this study, SNR was directly measured on the magnitude images (40, 44) via the following equations:
| Eq. [10a] |
| Eq. [10b] |
| Eq. [10c] |
Mavg (or Mavg(0)) is the mean of magnitude image intensity in a signal (or noise-only) region of interest. A is the mean signal amplitude in the signal region of interest and σ is the noise standard deviation in the real or imaginary part of the original complex image.
Quantification of sodium concentrations
Quantification was performed for both total and bound sodium concentrations. The TSC was calculated via Eq. [8a] on the SQ-image at TE1. The vBSC was computed via Eq. [8b] on the short-T2 image with an intensity fraction of ab,S =0.6 and a gain of g=0.76 (which was determined in the Results Section below). The noise-only image intensity, Īnoise, was measured on the SQ and short-T2 image, respectively.
Statistical analysis
Statistical significance (p-value) of the measurements attained in this study was evaluated using the unpaired Student’s t-test with two-tailed distribution. A standard threshold (P=0.05) was chosen to define statistical significance in this study.
RESULTS
Signal response and TE optimization
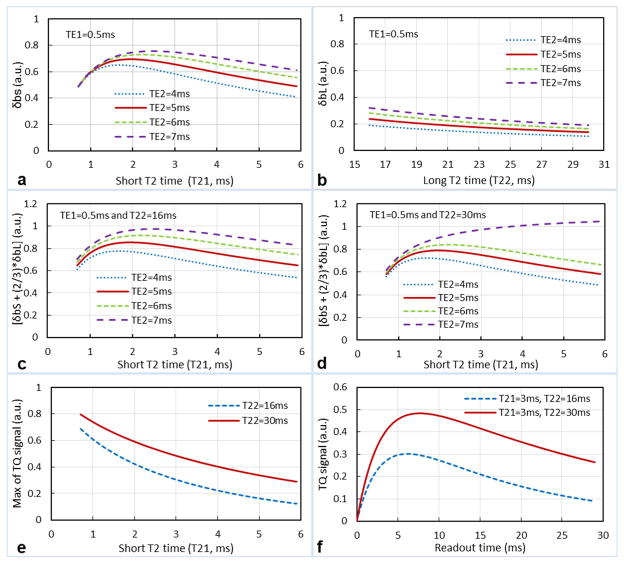
The signal response in the short-T2 imaging to T2 times is shown in Figure 2. For the short-T2 component in a typical range of 0.7–6ms in human brain (45), the signal response δb,S is nearly flat (Fig. 2a), with a gain of g=0.61±0.07 (mean±SD) relative to the intensity of the short-T2 component at TE1/TE2=0.5/5ms. For the long-T2 component in a typical range of 16–30ms (45), the signal response δb,L is also nearly flat (Fig. 2b) with a gain of g=0.18±0.03 relative to the intensity of the long-T2 component, showing a uniform suppression of the long-T2 signal. For a combination of the short- and long-T2 components (i.e., δb=0.6δb,S+0.4δb,L), the signal response δb is closer to a flat one (Fig. 2c, d), with a gain of g=0.76±0.07 relative to the intensity of the short-T2 component. Consequently, optimal TEs for achieving a flat signal response are TE1=0.5ms and TE2=5–6ms. In this study TE2=5ms was chosen for minimizing T2* decay.
Fig. 2.
Simulated signal response of the short-T2 imaging: (a) single component of short T2 time, (b) single component of long T2 time, (c) two components of a long T2 time at low-end, and (d) two components of a long T2 time at high-end. (e) Signal response of TQF imaging. (f) Two of TQF signals used in e. A nearly-flat signal response is achieved in the short-T2 imaging at TE1=0.5ms and TE2=5–6ms (red lines in c, d), but not achieved in the TQF imaging (e).
In contrast, signal response in TQF imaging shows much larger variation (>30%) with T2 times: g=0.32±0.16 relative to the intensity of either short- or long-T2 component at the low end of T22= 16ms, but g=0.49±0.15 at the high end of T22=30ms (Fig. 2e, f).
Image blurring of the short-T2 component
When the TPI acquisitions were performed on a sample of bi-component relaxation, the point spread function (PSF) was dominated by the long T2* component (Fig. 3a). When on a sample of single-component relaxation, the PSF doubled its full width at half maximum (FWHM) for the short T2* component, compared with the long T2* component (Fig. 3c). These results suggest that image blurring for short T2* components is two times larger than for long T2* components (Fig. 3d). The larger blurring also caused spreading of energy and reduced PSF amplitude, such as 0.02 vs. 0.40 at T2*=2ms vs. 20ms (Fig. 3b). It is worth mentioning that the subtraction of PSFs at TE1 and TE2 is still a single-peak, rather than two-peak, function because both PSFs share the same shape (but have different amplitude).
Fig. 3.
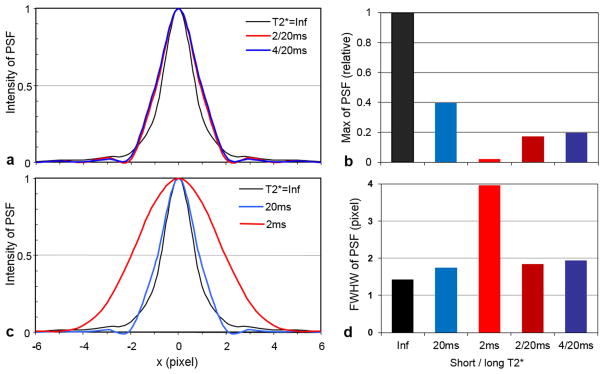
Point spread function (PSF) of the TPI acquisition on (a) bi-exponential T2* decay and (c) mono-exponential T2* decay, compared with no T2* decay (T2*=Inf). The maximum intensity and full-width-at-half-maximum (FWHM) of the PSF are shown in (b) and (d), respectively.
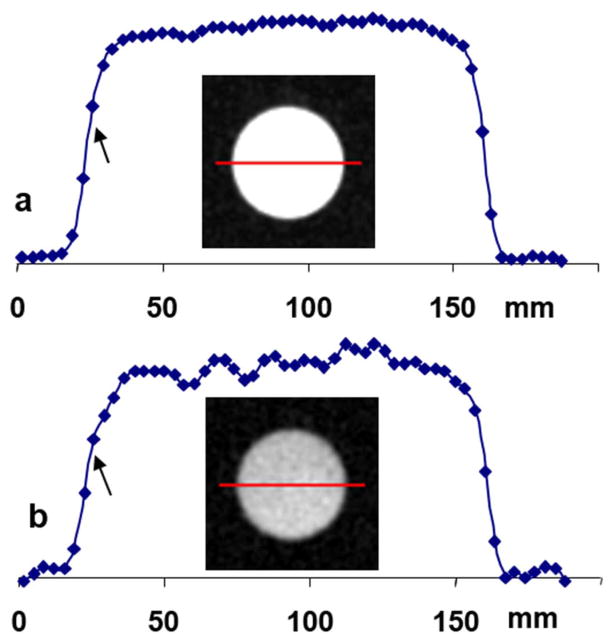
Image blurring (or spatial resolution) of the short-T2 imaging was measured on the cylindrical agarose phantom in Figure 4. A profile along the diameter reflects radial symmetry, as shown in the inset images. At the left side of the profiles, the measured resolution was 1.75 pixels (or 6.02 mm) for the SQ-image at TE1 (Fig. 4a), and 3.30 pixels (or 11.35 mm) for the short-T2 sodium image (Fig. 4b). These measurements are in good agreement with those predicted by the TPI’s PSF in Fig. 3d.
Fig. 4.
Sodium images of the agarose phantom and intensity profiles throughout the diameters (red lines). (a) SQ image at TE1 of a measured resolution of 6.0mm (arrow) or 1.75 pixels. (b) ST2 image of a measured resolution of 11.35 mm (arrow) or 3.30 pixels.
Imaging on phantoms
The short-T2 imaging and TQF imaging on a group of tube phantoms are shown in Figure 5. To reduce noise, the TQF image was reconstructed with a smaller k-space filter of 1/4 width for the SQ images. As expected, the short-T2 image clearly shows the four tubes and the TQF imaging completely suppressed the signal from the saline water (Fig. 5e). In contrast, the short-T2 imaging did not completely suppress the saline water signal as significant residual signals remain (Fig. 5d).
Fig. 5.
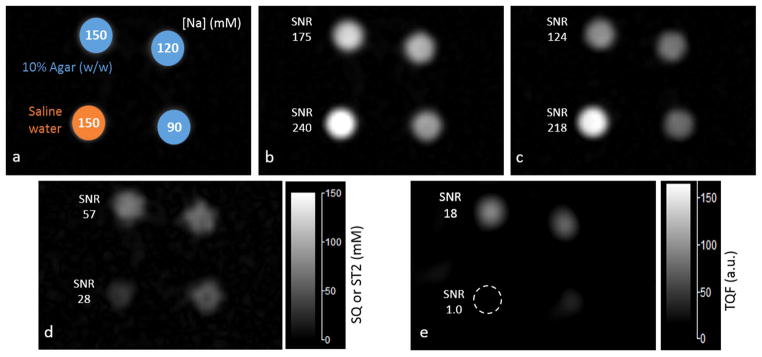
Sodium images of the agar tube phantoms. (a) Four tube phantoms: one filled with saline water of 150mM NaCl and the other three filled with 10% w/w agar gels of 150, 120 and 90mM NaCl, respectively. (b) Single-quantum (SQ) image at TE1=0.5ms. (c) SQ image at TE2=5ms. (d) Short-T2 (ST2) image from the subtraction between (b) and (c). (e) Triple-quantum filtered (TQF) image of a nominal resolution 4 times lower than in the ST2 image in d. Image intensities in b–d were calibrated to sodium concentration. The measured SNR in b–e shows advantages of the short-T2 imaging over conventional TQF imaging in SNR and resolution.
Quantification on phantoms
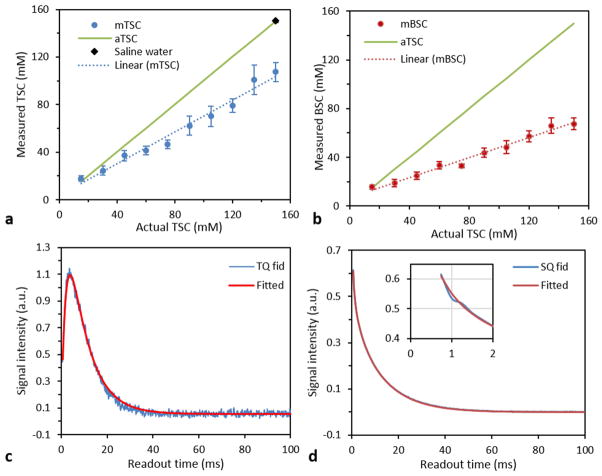
Figure 6 shows the quantification of both total and bound sodium concentrations on the SQ and short-T2 images, respectively. The spatial variation of coil sensitivity was measured relative to the location of the saline water tube by switching the 150mM agar tube at these locations. The relative coil sensitivity was found as (0.95, 1.0; 1.0, 1.06), fairly uniform at the locations investigated. A linear relationship between the measured and actual sodium concentrations was well established (R2=0.98) on both images (Figs. 6a, b), although they had a different line slop due to the difference in image resolution. These linear relations demonstrate that quantification of bound sodium on short-T2 images is feasible. The binding of total sodium in the agar phantoms was confirmed by the FID signals for the SQ and TQF imaging (Figs. 6c, d).
Fig. 6.
Quantification on the agar tube phantoms: (a) total sodium concentration (TSC) quantified on the SQ images at TE1 (for the linear fitting: mTSC=0.6681*aTSC+3.5952, R2=0.9777), (b) bound sodium concentration (BSC) quantified on the ST2 images (for the linear fitting: mBSC=0.4095*aTSC+7.0248, R2=0.9838), (c) TQF fid signal of the agar tubes showing existence of the bound sodium [for the fitting curve: T2*= (2.0, 8.4)ms, R2=0.9925], and fitting model s(t)=A*(exp(-t/T2*L)–exp(-t/T2*S) ), and (d) SQ fid signal of the agar tubes showing that all the sodium ions in the agar gels were bound [for the fitting curve: T2*=(2.8, 12.6)ms, a=(57.5, 42.5)%, R2=0.9995], when compared with free sodium in the saline water which showed a much larger T2* of 37.0ms in this study.
Human brain imaging: off-resonance correction
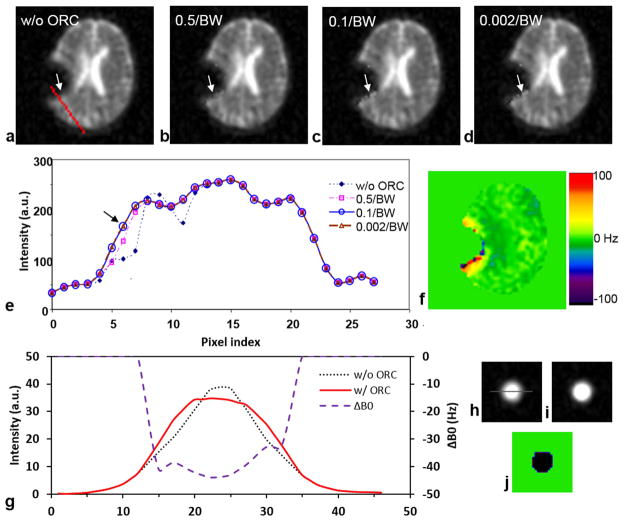
A number of time steps were investigated to find an optimal value for the time step. Figure 7 shows an example of the off-resonance correction in a worst case of pediatric patient where large off-resonance frequencies (40–100 Hz, Fig. 7e) appear around a programmable Silastic shunt (Medtronic, Minneapolis, MN, USA) implanted in the brain. The intensity profiles across the region (Fig. 7f) shows the improvement in the off-resonance correction when reducing the time step from 0.5 to 0.1 periods of the frequency bandwidth (BW) in the B0-field map. However, further reducing time step from 0.1 to 0.002/BW (i.e., single data point) did not further improve the correction. Consequently, the time step of 0.1/BW (or 0.5ms) was used in this study to reduce total computation time. The study on a uniform tube phantom confirmed the effectiveness of the ORC correction (Figs. 7g–j). The computation time for a single time step was 1.644s on our network server of eight node Linux CPU cluster with 16 Intel Xeon E5-2667 2.90GHz six-core processors. This led to total ORC computing time of 2.0min in this study at a time step of 0.5ms or 50 data points, or otherwise 100min at a time step of single data point.
Fig. 7.
Off-resonance correction (ORC) by the conjugate phase algorithm: (a) without ORC, (b–d) with ORC at a time step of 0.5, 0.1 or 0.002 periods of frequency bandwidth (BW), (e) intensity profiles along the red line in (a), and (f) a masked B0-field map for the ORC. A smaller time step produced better ORC (arrows in a–e). The time step of 0.1/BW (or 0.5ms or 50 data points) was as good as the time step of 0.002/BW (0.01ms or 1 data point) for the ORC (arrow in e). (g–j) ORC (0.5ms in time step) on the tube phantom of saline water at 150mM NaCl, showing recovery of the flat intensity within the tube which has a frequency offset of −40Hz: (g) Intensity profiles along the line as shown in h, (h) image of the tube phantom before ORC, (i) image after ORC, and (j) B0-field map used for the ORC.
Human brain imaging: T2* correction
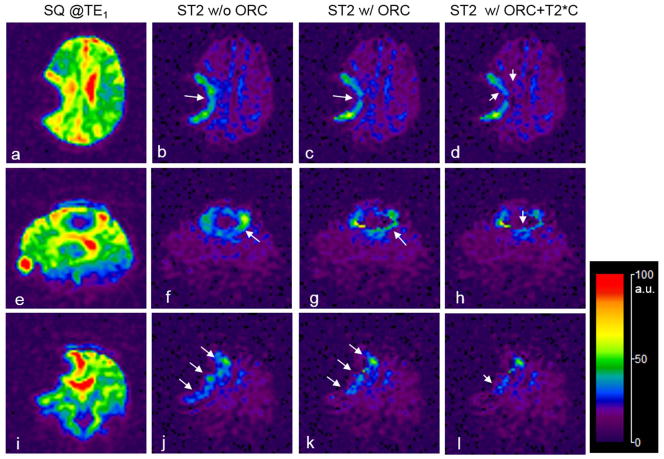
The T2* correction was implemented on the TE2 images after the off-resonance correction. The B0-field map for the T2* correction was estimated on the off-resonance corrected SQ images. Figure 8 demonstrates a T2* correction on the short-T2 images. While the ORC reduced artifacts in the background of short-T2 images (Figs. 8c, g, k), the T2* correction reduced intensity of the residual artifacts as shown in Figs. 8d, h, l.
Fig. 8.
Off-resonance correction (ORC) and T2* correction (T2*C) for the short-T2 (ST2) image of a pediatric brain tumor patient, with the SQ images as reference (a, e, i). The ST2 images were produced without ORC (b, f, j), with ORC (c, g, k), or with both ORC and T2*C (d, h, l). While the ORC minimized image blurring (long arrows in c, g, k), the T2*C reduced image intensity as expected (short arrows in d, h, l).
Human brain imaging: quantification of TSC and vBSC
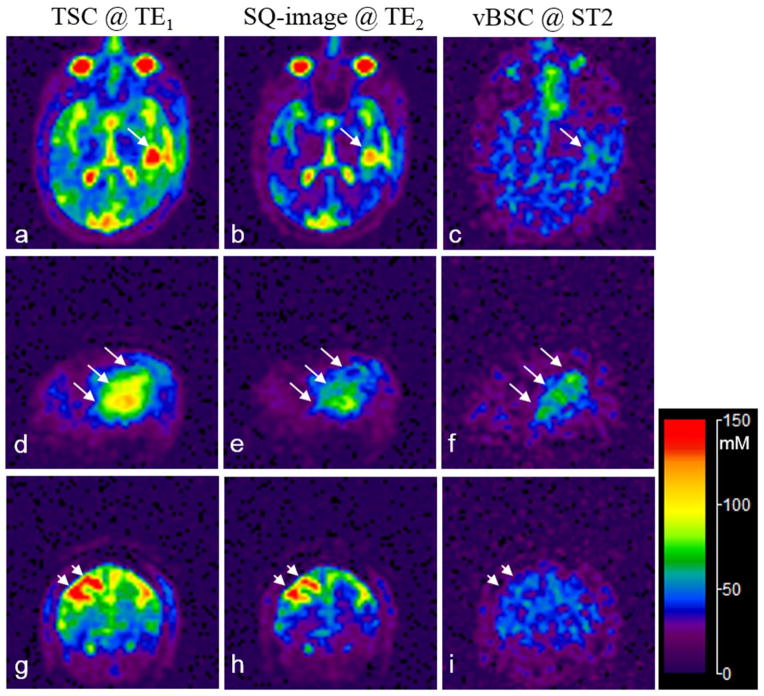
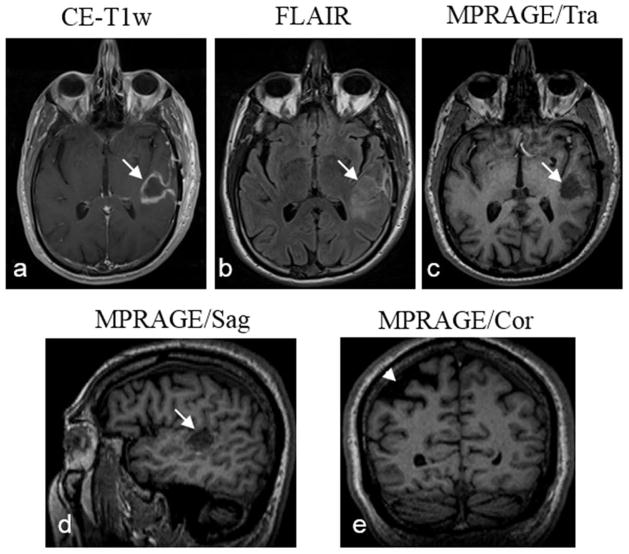
Quantification of total and volume-fraction weighted bound sodium concentrations was implemented on both SQ- and short-T2 images after the off-resonance and T2* corrections. Figure 9 demonstrates an example from an adult brain tumor patient with glioblastoma before anti-cancer treatment. The tumor region was confirmed by the proton MR images in Fig. 10, showing enhancement on both contrast-enhanced T1-weighted (CE-T1w) image and fluid attenuated inversion recovery (FLAIR) image. The sodium SNR is 39.7 in the CSF region on the SQ-image at TE1, and 15.3 in the tumor region on the short-T2 image, compared with 4.2 outside the tumor region (sagittal, Fig. 9f). The tumor region has TSC of 86.7±13.5 mM (mean±SD) and vBSC of 59.6±11.3 mM. The vBSC value is 3.6 times (P<0.0001) higher than outside the tumor region where vBSC=16.6±11.1 mM. The variance in the TSC or vBSC value reflects inhomogeneity in the tumor/non-tumor regions measured, rather than the noise-related variance which is much smaller. For instance, vBSC is 25.9±1.2 mM in a region of normal gray matter outside the tumor.
Fig. 9.
Sodium images of quantified total sodium concentration (TSC) and volume-fraction weighted bound sodium concentration (vBSC) for an adult brain tumor patient: (a–c) transverse, (d–f) sagittal, and (g–i) coronal views. The tumor region (long arrows, d–f) shows an increase not only in TSC (a, d) but also in vBSC (c, f). The CSF-filled cavity (short arrows, g–i) shows an increase in TSC (g) but not in vBSC (i). The calibrated SQ-images (b, e, h) at TE2 (=5.0ms) show visible decays in intensity of the short-T2 component compared with the corresponding images (a, d, g) at TE1 (=0.44ms). The tumor and cavity was confirmed in the proton (1H) images in Fig. 10.
Fig. 10.
Proton (1H) MR images of the same patient as shown in Fig. 9 for confirming the tumor (arrows) and cavity (arrowhead) in the brain. The tumor has hyperintensity in both CE-T1w (a) and FLAIR (b) images, but has hypointensity in the MPRAGE image in transverse or sagittal view (c, d). The cavity has low intensity in the MPRAGE image in coronal view (e).
DISCUSSION
The short-T2 sodium imaging, which is a subtraction of two single-quantum sodium images acquired at different TEs, has been demonstrated as an alternative to triple-quantum filtered imaging for measurement of bound sodium concentration in the brain. The key point in this method is that subtraction between the two SQ-images highlights signals from short-T2 relaxation while suppresses signals from long-T2 relaxation. The short-T2 relaxation originates from bound sodium of bi-exponential decay. The bound sodium mainly exists in intracellular space in the brain and thus is of interest for monitoring early response of cancer cells to therapies in brain tumor patients. Major advantages of the short-T2 imaging over TQF imaging are the lower SAR production (single vs. triple RF pulses), the shorter scan time (20 vs. 40 min), and the higher SNR (6 vs. 1) or higher spatial resolution. However, the subtraction also raises challenges such as B0-field inhomogeneity induced off-resonance artifacts, T2*-related fluctuation of measurements across scans, and potential motion artifacts between the two TE acquisitions.
Off-resonance correction via the time-domain conjugate phase algorithm has been shown to be effective in minimizing image blurring around the implants (Fig. 7). This correction did not require extra scans because the B0-field map was self-generated by the two-TE acquisitions and no registration was needed between them. However, this correction was still incomplete because large inhomogeneity of the B0-field might not be detectable in the TE2 image due to weak signal from areas such as the sinus regions in Figs. 9a–c.
The T2* decay was corrected to T2 decay in the TE2 image by taking advantage of the spatial resolution shared by the B0-field map and TE-images. The ultimate goal of this correction is to stabilize short-T2 imaging across scans. However, reproducibility of the short-T2 imaging was not investigated in this study as it required a dedicated experimental design which was beyond the scope of this study. However, it is worth mentioning that the T2* correction is for correcting local macroscopic, rather than microscopic, inhomogeneity of the B0 field. Thus, the corrected TE2 image is still T2*-weighted, but should be closer to the T2-weighted and be more reproducible.
The measured spatial resolution of the short-T2 image was 3.30 pixels (or 11.35 mm) on the large cylindrical agarose phantom (Fig. 4b), compared with 1.75 pixels (or 6.02 mm) in the corresponding SQ-image (Fig. 4a). This resolution is specific to the scheme of TPI acquisitions used in this study. It is possible to increase image resolution by using different parameters in the TPI trajectory (38) or by using different schemes for data acquisition at a cost of reduced SNR, such as the acquisition-weighted stack of spirals (AWSOS) (40) and others (41).
Motion may exist between the two TE images as the time gap between the two TE scans is long (~10min). Motion correction may be needed for the TE2 image if it is visually detectable. In this study there was no visible motion detected. In the future, an interleaved acquisition at TE1 and TE2, or a double-TE acquisitions per RF excitation, may be used to minimize the motion.
Quantification for total and bound sodium concentrations can be implemented in the short-T2 imaging simultaneously. TSC and vBSC share the same internal calibration for quantification. This eliminates the need for a separate calibration for vBSC and simplifies imaging procedures in clinical setting. This unique feature stems from the short-T2 images sharing the same signal scale with the SQ images. In contrast, TQF images have completely different signal scale from corresponding SQ images and are not suitable for quantification of bound sodium.
A major drawback of the short-T2 imaging is the incomplete suppression of long T2 signal (Fig. 5d). This restricts its application to high concentrations (>45mM) of bound or intracellular sodium (Fig. 6), such as cancer cells and injured/damaged cells. Bound sodium at low concentrations will join the free sodium in the background of the short-T2 image.
Further improvements for the short-T2 imaging are needed. First, the spatial resolution needs to be increased at least as high as that for the SQ imaging. This may be achieved by using shorter readout time which in turn reduces SNR unfortunately. Increasing SNR is thus the key issue. Multi-channel receiver array has the potential to increase SNR by a factor of 2.0 (46). The higher field strength such as 7 Tesla has the potential to double SNR over the 3T field. A combination of both strategies holds great promise to address the resolution issue. Second, motion between the two TE acquisitions need to be minimized. This may be realized by alternating TE acquisitions in a single scan, or by performing two TE acquisitions in one RF excitation.
CONCLUSIONS
The proposed short-T2 sodium imaging has been demonstrated through phantom and human studies at 3T as a feasible approach to quantification of bi-exponential (or bound) sodium. It has advantages over triple-quantum filtered imaging, such as low SAR, short acquisition time, and high SNR and resolution. It has limitations as well, such as residual long-T2 signal. This restricts its application to large changes in concentration (>45mM) of bound or intracellular sodium in the brain, such as in cancer cells, injured cells or degenerative neurons. Nevertheless, the short-T2 sodium imaging may have substantial use in non-surgical treatment monitoring of both pediatric and adult brain tumors and in detection of neurological disorders caused by nerve cell injury, damage or degeneration.
Acknowledgments
This work was supported in part by NIH grant U01 CA140230 (Y.Q., C.M.L., J.D., F.S.L, J.M.M.), by Children’s Hospital of Pittsburgh Foundation and Ian’s Friends Foundation (A.P., V.K.L.), and by the Department of Radiology Development Fund, University of Pittsburgh (Y.Q.).
The authors thank Dr. Tiejun Zhao at MR R&D Collaborations (Pittsburgh, Pennsylvania), Siemens Healthcare USA for his helpful discussions on the work described in this paper. This work was financially supported in part by NIH grant U01 CA140230 (Y.Q., C.M.L., J.D., F.S.L, J.M.M.), by Children’s Hospital of Pittsburgh Foundation and Ian’s Friends Foundation (A.P., V.K.L.), and by the Department of Radiology Development Fund, University of Pittsburgh (Y.Q.).
References
- 1.Cope F. NMR evidence for complexing of Na+ in muscle, kidney, and brain, and by actomyosin. The relation of cellular complexing of Na+ to water structure and to transport kinetics. J Gen Physiol. 1967;50:1353–75. doi: 10.1085/jgp.50.5.1353. [DOI] [PMC free article] [PubMed] [Google Scholar]
- 2.Shinar H, Navon G. NMR relaxation studies of intracellular Na+ in red blood cells. Biophys Chem. 1984;20:275–283. doi: 10.1016/0301-4622(84)80018-6. [DOI] [PubMed] [Google Scholar]
- 3.Gupta RK, Gupta P. Direct observation of resolved resonances from intra- and extracellular sodium-23 ions in NMR studies of intact cells and tissues using dysprosium(III)tripoly-phosphate as a paramagnetic shift reagent. J Magn Reson. 1982;47:344–350. [Google Scholar]
- 4.Borthakur A, Shapiro EM, Beers J, Kudchodkar S, Kneeland JB, Reddy R. Effect of IL-1β-induced macromolecular depletion on residual quadrupolar interaction in articular cartilage. J Magn Reson Imaging. 2002;15:315–323. doi: 10.1002/jmri.10074. [DOI] [PMC free article] [PubMed] [Google Scholar]
- 5.Eliav U, Shinar H, Navon G. The formation of a second-rank tensor in 23Na double-quantum-filtered NMR as an indicator for order in a biological tissue. J Magn Reson. 1992;98:223–229. [Google Scholar]
- 6.Thulborn KR, Davis D, Adams H, Gindin T, Zhou J. Quantitative tissue sodium concentration mapping of the growth of focal cerebral tumors with sodium magnetic resonance imaging. Magn Reson Med. 1999;41:351–359. doi: 10.1002/(sici)1522-2594(199902)41:2<351::aid-mrm20>3.0.co;2-h. [DOI] [PubMed] [Google Scholar]
- 7.Cameron IL, Smith NK, Pool TB, Sparks RL. Intracellular concentration of sodium and other elements as related to mitogenesis and oncogenesis in vivo. Cancer Res. 1980;40(5):1493–500. [PubMed] [Google Scholar]
- 8.Hubbard PS. Nonexponential nuclear magnetic relaxation by quadrupole interactions. J Chem Phys. 1970;53:985–987. [Google Scholar]
- 9.Shporer M, Civan MM. Nuclear magnetic resonance of sodium-23 linoleate-water. Biophysical Journal. 1972;12:114–122. doi: 10.1016/S0006-3495(72)86074-0. [DOI] [PMC free article] [PubMed] [Google Scholar]
- 10.Berendsen HJC, Edzes HT. Observation and general interpretation of sodium magnetic resonance in biological material. Ann NY Acad Sci. 1973;204:459–480. doi: 10.1111/j.1749-6632.1973.tb30799.x. [DOI] [PubMed] [Google Scholar]
- 11.Andrasko J. Nonexponential relaxation of 23Na+ in agarose gels. J Magn Reson. 1974;16:502–504. [Google Scholar]
- 12.Cohen BL. Concepts of nuclear physics. New York: McGraw-Hill; 1971. p. 435. [Google Scholar]
- 13.Joffe J, Urey HC. The spin of the sodium nucleus. Physical Review. 1933;43:761. [Google Scholar]
- 14.Jaccard G, Wimperis S, Bodenhausen G. Multiple-quantum NMR spectroscopy of S=3/2 spins in isotropic phase: A new probe for multiexponential relaxation. J Chem Phys. 1986;85:6282–6293. [Google Scholar]
- 15.Pekar J, Leigh JS. Detection of biexponential relaxation in sodium-23 facilitated by double-quantum filtering. J Magn Reson. 1986;69:582–584. [Google Scholar]
- 16.Bull TE. Nuclear magnetic relaxation of spin-3/2 nuclei involved in chemical exchange. J Magn Reson. 1972;8:344–353. [Google Scholar]
- 17.Reddy R, Shinnar M, Wang Z, Leigh JS. Multiple-quantum filters of spin-3/2 with pulses of arbitrary flip angle. J Magn Reson. 1994;104:148–152. doi: 10.1006/jmrb.1994.1068. [DOI] [PubMed] [Google Scholar]
- 18.Bax A, de Jong PG, Mehlkopf AF, Smidt J. Separation of the different orders of NMR multiple-quantum transitions by the use of pulsed filed gradients. Chem Phys Lett. 1980;69:567–570. [Google Scholar]
- 19.Chung C, Wimperis S. Optimum detection of spin-3/2 biexponential relaxation using multiple-quantum filteration techniques. J Magn Reson. 1990;88:440–447. [Google Scholar]
- 20.Hancu I, Boada FE, Shen GX. Three-dimensional triple-quantum-filtered 23Na imaging of in vivo human brain. Magn Reson Med. 1999;42:1146–1154. doi: 10.1002/(sici)1522-2594(199912)42:6<1146::aid-mrm20>3.0.co;2-s. [DOI] [PubMed] [Google Scholar]
- 21.Tsang A, Stobbe RW, Beaulieu C. Triple-quantum-filtered sodium imaging of the human brain at 4. 7T. Magn Reson Med. 2012;67:1633–1643. doi: 10.1002/mrm.23147. [DOI] [PubMed] [Google Scholar]
- 22.Navon G. Complete elimination of the extracellular 23Na NMR signal in triple quantum filtered spectra of rat heart in the presence of shift reagents. Magn Reson Med. 1993;30:503–506. doi: 10.1002/mrm.1910300415. [DOI] [PubMed] [Google Scholar]
- 23.Allis JL, Seymour AL, Radda GK. Absolute quantification of intracellular Na+ using triple-quantum-filtered sodium-23 NMR. J Magn Reson. 1991;93:71–76. [Google Scholar]
- 24.Kline RP, Wu EX, Petrylak DP, Szabolcs M, Alderson PO, Weisfeldt ML, Cannon P, Katz J. Rapid in vivo monitoring of chemotherapeutic response using weighted sodium magnetic resonance imaging. Clin Cancer Res. 2000;6:2146–2156. [PubMed] [Google Scholar]
- 25.Ouwerkerk R, Bleich KB, Gillen JS, Pomper MG, Bottomley PA. Tissue sodium concentration in human brain tumors as measured with 23Na MR imaging. Radiology. 2003;227:529–537. doi: 10.1148/radiol.2272020483. [DOI] [PubMed] [Google Scholar]
- 26.Stobbe R, Beaulieu C. In vivo sodium magnetic resonance imaging of the human brain using soft inversion recovery fluid attenuation. Magn Reson Med. 2005;54:1305–1310. doi: 10.1002/mrm.20696. [DOI] [PubMed] [Google Scholar]
- 27.Rong P, Regatte RR, Jerschow A. Clean demarcation of cartilage tissue 23Na by inversion recovery. J Magn Reson. 2008;193:207–209. doi: 10.1016/j.jmr.2008.04.036. [DOI] [PMC free article] [PubMed] [Google Scholar]
- 28.Benkhedah N, Bachert P, Semmler W, Nagel AM. Three-dimensional biexponential weighted 23Na imaging of the human brain with higher SNR and shorter acquisition time. Magn Reson Med. 2013;70:754–765. doi: 10.1002/mrm.24516. [DOI] [PubMed] [Google Scholar]
- 29.Benkhedah N, Bachert P, Nagel AM. Two-pulse biexponential-weighted 23Na imaging. J Magn Reson. 2014;240:67–76. doi: 10.1016/j.jmr.2014.01.007. [DOI] [PubMed] [Google Scholar]
- 30.Haacke EM, Brown RW, Thompson MR, Venkatesan R. Magnetic resonance imaging-Physical principles and sequence design. New York: John Wiley & Sons, Inc; 1999. p. 914. [Google Scholar]
- 31.Hilal SK, Maudsley AA, Ra JB, Simon HE, Roschmann P, Wittekoek, Cho ZH, Mun SK. In vivo NMR imaging of sodium-23 in the human head. J Comput Assist Tomogr. 1985;9:1–7. doi: 10.1097/00004728-198501000-00001. [DOI] [PubMed] [Google Scholar]
- 32.Ra JB, Hilal SK, Oh CH. An algorithm for MR imaging of the short T2 fraction of sodium using the FID signal. J Comput Assist Tomogr. 1989;13:302–309. doi: 10.1097/00004728-198903000-00022. [DOI] [PubMed] [Google Scholar]
- 33.Perman WH, Thomasson DM, Bernstein MA, Turski PA. Multiple short-echo (2. 5ms) quantitation of in vivo sodium T2 relaxation. Magn Reson Med. 1989;9:153–160. doi: 10.1002/mrm.1910090202. [DOI] [PubMed] [Google Scholar]
- 34.Batha R, Menon RS. Long component time constant of 23Na T2* relaxation in healthy human brain. Magn Reson Med. 2004;52:407–410. doi: 10.1002/mrm.20144. [DOI] [PubMed] [Google Scholar]
- 35.Harrington MG, Salomon RM, Pogoda JM, Oborina E, Okey N, Johnson B, Schmidt D, Fonteh AN, Dalleska NF. Cerebrospinal fluid sodium rhythms. Cerebrospinal Fluid Res. 2010;7:3. doi: 10.1186/1743-8454-7-3. [DOI] [PMC free article] [PubMed] [Google Scholar]
- 36.Noll DC, Fessler JA, Sutton BP. Conjugate phase MRI reconstruction with spatially variant sample density correction. IEEE Trans Med Imaging. 2005;24:325–336. doi: 10.1109/tmi.2004.842452. [DOI] [PubMed] [Google Scholar]
- 37.Sutton BP, Noll DC, Fessler JA. Fast, iterative image reconstruction for MRI in the presence of field inhomogeneities. IEEE Trans Med Imaging. 2003;22:178–188. doi: 10.1109/tmi.2002.808360. [DOI] [PubMed] [Google Scholar]
- 38.Boada FE, Gillen JS, Shen GX, Chang SY, Thulborn KR. Fast three dimensional sodium imaging. Magn Reson Med. 1997;37:706–715. doi: 10.1002/mrm.1910370512. [DOI] [PubMed] [Google Scholar]
- 39.Fiege DP, Romanzetti S, Mirkes CC, Brenner D, Shah NJ. Simultaneous single-quantum and triple-quantum-fitered MRI of 23Na (SISTINA) Magn Reson Med. 2013;69:1691–1696. doi: 10.1002/mrm.24417. [DOI] [PubMed] [Google Scholar]
- 40.Qian Y, Zhao T, Zheng H, Weimer J, Boada FE. High-resolution sodium imaging of human brain at 7 T. Magn Reson Med. 2012;68:227–233. doi: 10.1002/mrm.23225. [DOI] [PMC free article] [PubMed] [Google Scholar]
- 41.Rahmer J, Börnert P, Groen J, Bos C. Three-dimensional radial ultrashort echo-time imaging with T2 adapted sampling. Magn Reson Med. 2006;55:1075–1082. doi: 10.1002/mrm.20868. [DOI] [PubMed] [Google Scholar]
- 42.Nagel AM, Laun FB, Weber MA, Matthies C, Semmler W, Schad LR. Sodium MRI using a density-adapted 3D radial acquisition technique. Magn Reson Med. 2009;62:1565–1573. doi: 10.1002/mrm.22157. [DOI] [PubMed] [Google Scholar]
- 43.Atkinson IC, Lu A, Thulborn KR. Clinically constrained optimization of flexTPI acquisition parameters for the tissue sodium concentration. Magn Reson Med. 2011;66:1089–1099. doi: 10.1002/mrm.22908. [DOI] [PMC free article] [PubMed] [Google Scholar]
- 44.Gudbjartsson H, Patz S. The Rician distribution of noisy MRI data. Magn Reson Med. 1995;34:910–914. doi: 10.1002/mrm.1910340618. Erratum in Magn Reson Med 1996; 36: 332. [DOI] [PMC free article] [PubMed] [Google Scholar]
- 45.Ra JB, Hilal SK, Cho ZH. A method for in vivo MR imaging of the short T2 component of sodium-23. Magn Reson Med. 1986;3:296–302. doi: 10.1002/mrm.1910030213. [DOI] [PubMed] [Google Scholar]
- 46.Qian Y, Zhao T, Wiggings GC, Wald LL, Zheng H, Weimer J, Boada FE. Sodium imaging of human brain at 7T with 15-channel array coil. Magn Reson Med. 2012;68(6):1807–1814. doi: 10.1002/mrm.24192. [DOI] [PubMed] [Google Scholar]


